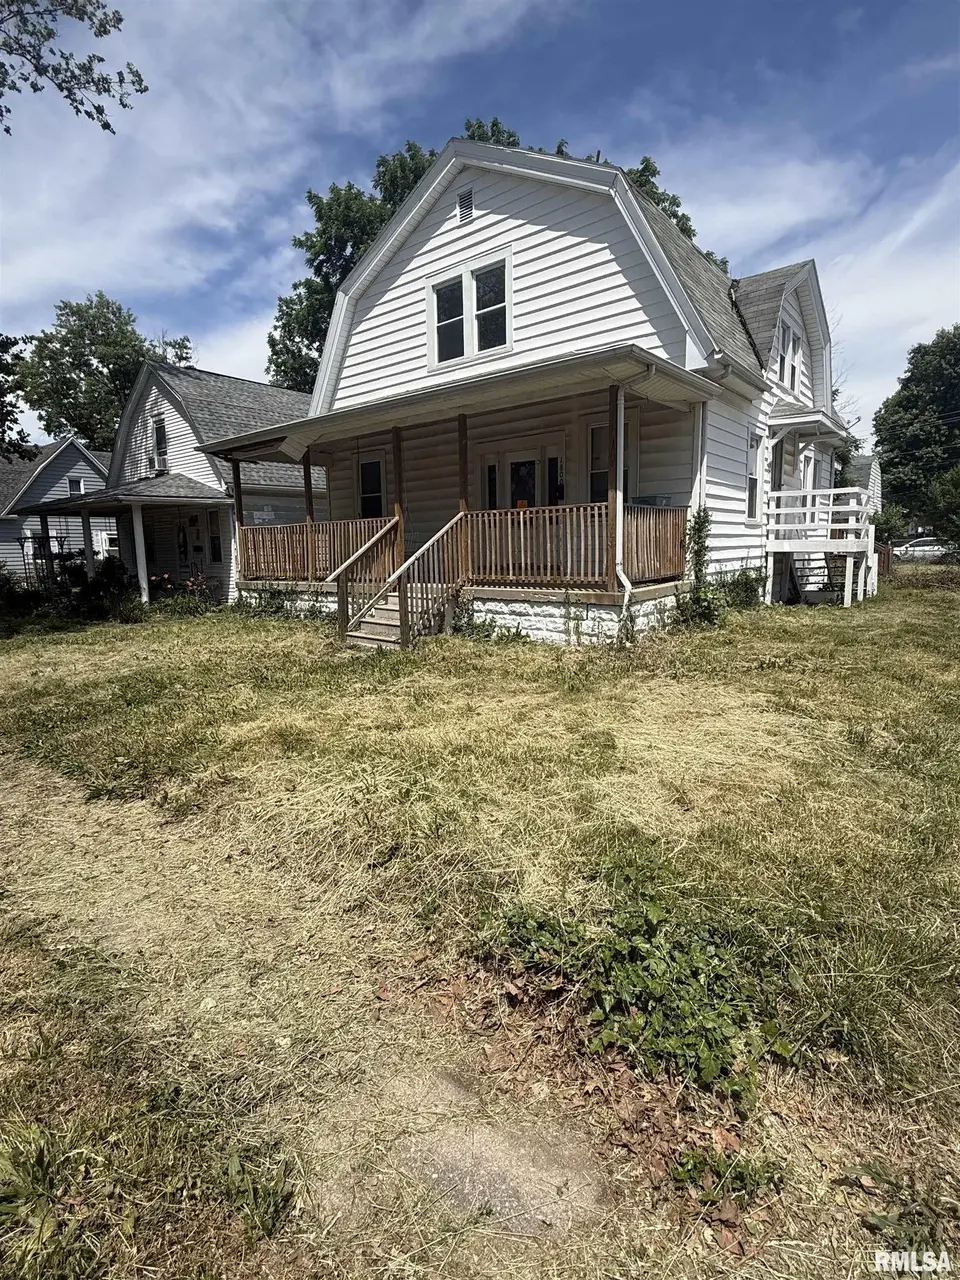
1800 N 9th St · Springfield, IL
Flood risk 1/10 · Minimal
- FEMA flood zone
- X (unshaded)
- Chance of flooding over 30 yrs
- 0.0%
- Est. flood insurance / yr
- $473 – $860
Fire risk 1/10 · Minimal
- Est. fire insurance / yr
- $804 – $1,492
Heat risk 4/10 · Minor
- Hot days now (above 104°F)
- 7 days/yr
- Hot days in 30 yrs
- 20 days/yr
Wind risk 2/10 · Minimal
- Chance of severe wind over 30 yrs
- 1.0%
Air-quality risk 2/10 · Minimal
- Unhealthy air days now
- 1 days/yr
- Unhealthy air days in 30 yrs
- 1 days/yr
Risk factors via First Street. Map © Google.
Why this score? — see what drove the B- grade
The composite is a weighted blend of 9 inputs, each scored 0–100. Each bar is that input's sub-score; the figure is the points it added to the 100-point composite (weight × sub-score).
- Cash flow +30.0/30.0
- 1% rule +10.0/10.0
- DSCR +10.0/10.0
- ARV discount +7.5/15.0
- Livability +4.0/5.0
- Rent growth +3.7/5.0
- Condition / age +2.5/5.0
- Schools +1.7/10.0
- Appreciation +0.0/10.0
$70,000
🖨 Deal sheet 📄 Offer letter ✓ Due diligence
Listing remarks MLS
HURRY! Don't miss this large 2 story home on the north side of Springfield. This home is on a double corner lot with a deck off of the back of the house and a newly fenced in yard in 2018. Take advantage of the detached 2 car garage with a wood burner. Garage roof has been replaced in 2018. A/c and furnace replaced in 2015 along with fresh paint 2021. There is first floor laundry off the master bedroom along with a full, dry basement. You could leave it as a large single family home or easily convert it back to a duplex. Home is being sold as-is
Key facts
- 6,080 sq ft lot
- 2 garage spots
- Built 1915
Property features AI
Exterior
- Parking: Detached gravel garage with 2 garage spaces
- Utilities: Public water; Public sewer
- Home design: Single family residence; Two levels
- Construction: Shingle roof; Built in 1915
- Exterior features: Level lot; Paved road access
Interior
- Kitchen: Kitchen with vinyl flooring
- Bedrooms: Three bedrooms (one on the main level, others on upper level)
- Flooring: Carpet in bedrooms; Vinyl in kitchen
- Bathrooms: Two full bathrooms
- Heating & cooling: Forced air heating; Central air conditioning
- Interior features: Full, unfinished basement; No fireplaces
Neighborhood map
What this means for you Summary
Snapshot
- This is a 3-bed/2.0-bath single-family listed at $70k.
Deal economics
- At list price, monthly cash flow is $644 ($8k/yr) — positive.
- The deal already cash-flows at list — no discount required.
- Meets the 1% rule at list price ($2k rent vs $70k).
- Cap rate 17.3% vs local median 4.9% in Springfield — top-decile yield for the area; either an underpriced asset or a hidden risk that comps aren't pricing in. Stress-test before assuming the spread holds.
Location & tenants
- Location reads 79/100 on livability (#122 in IL, #2,138 nationally) — a middle-class / working-renter tenant base. Strengths: amenities A+, commute A+, cost of living A+; Watch: crime F.
- Springfield SD 186 (urban): math 17% / reading 22% proficiency, ranked #438 of 620 in IL (top 71%) — low school quality limits family demand, transient renter base, plan for 1-2y turnover; 64% free/reduced lunch — lower-income household profile, screen leases tightly.
- Zoned schools: Lanphier High School (math 10% / reading 16%, grade F, #501 of 693 statewide, top 73%, 1,058 students, 0% FRL) — zoned schools average 0% FRL vs 64% district-wide (64 pts lower); this property's tenant base skews higher-income than the district average.
- Market conditions: Rents rising fast (+5.0%/yr); 131 active listings in the ZIP; 225 units permitted in Sangamon County in 2024 (48 in 5+ unit buildings).
- This rent runs 35% of the median local income ($51k/yr) — at the standard rent-burdened threshold; future hikes will face affordability resistance.
Forward outlook
- Local home prices are declining (-3.0%/yr); year-one equity from $484 of loan paydown is wiped out by about $2k of value loss. Plan a longer hold.
- Sangamon County population projected to shrink 9% by 2050 — rents likely to lag national; underwrite the cash flow, not the appreciation.
- At projected returns (-3.0% appreciation + 5.0% rent growth), your $20k cash investment doubles in ~3 years — after that, you're playing with house money.
Negotiation context
- Only 14 days on market — expect competitive offers; lowballing is unlikely to land.
- 2 sale attempts since 5y ago with the ask held roughly flat each time — persistent listings suggest the price (not the market) is what's stuck; bring a comps-based counter.
Risks & watch-outs
- Watch-outs: property tax is 2.6% of price; built in 1915 — expect roof / HVAC / electrical / plumbing capex.
Questions for the listing agent
- Built in 1915 — when were the roof, HVAC, electrical panel, plumbing, and water heater last replaced?
- Property tax is high relative to price — has the assessment been appealed recently, and will the sale trigger a re-assessment?
- Is there a deadline driving the sale (1031 exchange, divorce, estate, relocation)? That informs how much negotiation room exists.
- Schools are D-rated, which usually means shorter tenancies and higher turnover. Who's the typical renter profile here, and what's been the actual vacancy rate?
- Crime grade is F in this area — have there been break-ins, vandalism, or insurance claims at this property in the last 3 years? What carrier currently insures it and at what premium?
- What's the average days-on-market for RENTAL listings here right now (not sales)? A rising rental-DOM trend means longer vacancies and softer asking-rent achievability than the comps imply.
- What's the recent tenant-quality profile in this submarket — average credit score on applications, eviction rate, late-payment / NSF rate, and stable-employment percentage? A property-management company in the area should have these aggregated.
- How much new for-sale + rental construction is in the pipeline within 1–3 miles? Heavy new supply typically softens prices + rents 12–24 months out; constrained supply supports both.
Investment metrics
- 1% rule
- 2.16% ✓
- Cap rate
- 17.33%
- Cash-on-cash
- 39.40%
- DSCR
- 2.75
- GRM
- 3.9
CMA / ARV
- ARV (on-the-fly)
- $150,984
- Comps found
- 12
Show comp detail 12 sales within ~0.75 mi
| Address | Dist | Beds/Ba | Sqft | Sold | Price | $/sf | Match |
|---|---|---|---|---|---|---|---|
| 1920 N 9th St | 0.11mi | 2/1.0 (-1) | 1,915 (+3%) | 10mo | $65,000 | $34 | 73 |
| 2001 Marland St | 0.28mi | 3/2.0 | 1,820 (-2%) | 15mo | $165,000 | $91 | 71 |
| 1928 N 5th St | 0.34mi | 3/2.5 | 1,812 (-3%) | 11mo | $135,000 | $75 | 68 |
| 1531 N 9th St | 0.20mi | 2/1.5 (-1) | 1,793 (-4%) | 15mo | $82,297 | $46 | 65 |
| 2136 N 6th St | 0.46mi | 3/2.0 | 1,787 (-4%) | 10mo | $75,000 | $42 | 64 |
| 1916 Fairmont Dr | 0.56mi | 3/2.0 | 1,805 (-3%) | 11mo | $154,000 | $85 | 60 |
| 1915 N 6th St | 0.31mi | 3/1.5 | 1,625 (-13%) | 8mo | $191,000 | $118 | 56 |
| 1804 Fairfield Dr | 0.49mi | 3/1.5 | 1,670 (-10%) | 5mo | $125,000 | $75 | 53 |
| 1815 Fairfield Dr | 0.47mi | 3/1.0 | 1,615 (-13%) | 1mo | $165,000 | $102 | 51 |
| 2104 N 6th St | 0.41mi | 4/3.0 (+1) | 2,091 (+12%) | 2mo | $185,000 | $88 | 49 |
| 1916 Fairfield Dr | 0.50mi | 3/1.0 | 1,723 (-8%) | 13mo | $139,900 | $81 | 49 |
| 1443 N 3rd St | 0.59mi | 3/1.0 | 1,608 (-14%) | 11mo | $125,000 | $78 | 37 |
Match score weights: distance 35% · size 25% · config 20% · recency 20%. Top-matched comps best support the ARV.
Projected returns pro-forma
-3.0% appreciation · 4.95% rent growth · sell at horizon
- IRR
- 38.0%
- Equity multiple
- 2.67×
- Total profit
- $32,731
- Equity at exit
- $10,437
- IRR
- 45.6%
- Equity multiple
- 5.82×
- Total profit
- $94,441
- Equity at exit
- $6,052
Cash invested: $19,600 (down + closing). Projections, not guarantees.
Landlord ↔ Tenant lean methodology
- Overall (STATE)
- 43 Moderately Tenant-Leaning
- State Illinois
- 43 Moderately Tenant-Leaning · D+7
- County
- — inherits STATE
- City
- — inherits STATE
ZIP-level market 62702
- Home prices YoY
- -34.9%
- Rents YoY
- 5.0%
- Active inventory
- 131
- Price-to-rent
- 3.9×
Monthly cashflow live
- Estimated rent
- $1,510 medium interval (Pro) →
- Mortgage (P&I)
- −$367
- Tax from tax record
- −$153 /mo · $1,841/yr
- Insurance
- −$29
- HOA
- −$0
- Vacancy / Maint / Mgmt
- −$317
- Net cashflow
- $644
Break-even live
UW: 25.0% down · 7.5% · 30yr · 1.5% tax · 5.0% vac · 8.0% maint · 8.0% mgmt
Financing live
Cash to close
- Down payment
- $17,500
- Closing costs
- $2,100
- Reserves months
- —
- Total cash needed
- —
Loan-product check · same deal, 3 products live
Conventional
25% down · 7.5% · 30yr
- Down + closing
- —
- Monthly P&I
- —
- Monthly cashflow
- —
- DSCR
- —
- Eligible?
- —
Personal DTI + credit; lowest rate.
DSCR
20% down · 8.5% · 30yr
- Down + closing
- —
- Monthly P&I
- —
- Monthly cashflow
- —
- DSCR
- —
- Eligible?
- —
No personal income docs; deal must DSCR.
Hard money
10% down · 12.0% · 12mo
- Down + closing
- —
- Monthly P&I
- —
- Monthly cashflow
- —
- DSCR
- —
- Eligible?
- —
Short-term bridge; refi at stabilization.
Listing history 12 events
-
2026-06-19days on market $70,000 Active 14 DOM
-
2026-06-18days on market $70,000 Active 13 DOM
-
2026-06-17days on market $70,000 Active 12 DOM
-
2026-06-16days on market $70,000 Active 11 DOM
-
2026-06-15days on market $70,000 Active 10 DOM
-
2026-06-14days on market $70,000 Active 8 DOM
-
2026-06-13days on market $70,000 Active 7 DOM
-
2026-06-10days on market $70,000 Active 5 DOM
-
2026-06-09days on market $70,000 Active 4 DOM
-
2026-06-08days on market $70,000 Active 3 DOM
-
2026-06-07remarks 567-char remark
-
2026-06-07$70,000 Active 2 DOM
ⓘ Source: listings_history table (triggers on properties + properties_extension) + one-shot
backfill from property_details.listing_events for pre-trigger history.
Tax reassessment forecast IL · Partial reset (capped growth)
- Current annual tax
- $1,841 · $153/mo
- Projected year-2 tax
- $1,841 · $153/mo
- Expected delta
- $0/yr ($0/mo · 0.0%)
ⓘ Screening estimate from a state-policy table — verify with the county assessor before closing.
Climate risk First Street
- Flood 1/10 Low FEMA zone X (unshaded) · 0% chance over 30 yrs
- Wildfire 1/10 Low
- Heat 4/10 Moderate 7 d/yr ≥104°F today · 20 d/yr by 30 yrs out
- Wind 2/10 Low 100% chance of damaging wind over 30 yrs
- Air quality 2/10 Low 1 unhealthy d/yr today · 1 by 30 yrs out
Nearby sold comps map
Loading sold comps map…
Walkable amenities ~0.75 mi
Loading nearby amenities…
Taxation est. · year 1
- Rental income
- $18,125
- − Mortgage interest
- −$3,921
- − Property taxes
- −$1,841
- − Insurance
- −$350
- − Repairs & maintenance
- −$1,450
- − Management
- −$1,450
- − Depreciation
- −$2,036
- Taxable income
- $7,077
- Est. tax owed @ 24.0%
- −$1,698
- After-tax cash flow
- $6,025/yr
For passive investors: Depreciation is non-cash, so a rental often shows a tax loss while cash-flowing — sheltering income. Rental losses are passive: they offset passive income freely, and up to $25,000/yr can offset ordinary (W-2) income if you actively participate and your MAGI is under $100k (phasing out to $0 by $150k); unused losses carry forward. On sale, claimed depreciation is recaptured at up to 25%, and gains may owe capital-gains tax (a 1031 exchange can defer both). Figures are a year-1 estimate at your 24.0% rate — not tax advice; consult a CPA.
Schools (NCES district)
- District
- Springfield SD 186
- NCES district ID
- 1737080
- Math proficiency
- 17% ▼ -7.00%
- Reading proficiency
- 22% ▼ -5.00%
- Median HH income
- $43,744
- Composite
- 16.89/100
- National rank
- #9142
- State rank
- #438 of 620 in IL
Livability — Springfield
- Score
- 79/100
- State rank
- #122
- US rank
- #2138
Category grades
Schools grade is shown separately in the Schools card above.
Census & demographics
- Census place
- Springfield, IL
- County
- Sangamon County · 115,414 people
- City population
- 59,955
- Metro
- Springfield, IL
- Population (ZIP)
- 31,033
- Household income
- $51,136
- Rent vs Own
- Severe rent burden
- 1230.0
Population outlook (Sangamon County) Hauer SSP2
- Today (2025)
- 198,317 people
- By 2030
- 196,127 · -1.1%
- By 2040
- 188,664 · -4.9%
- By 2050
- 179,624 · -9.4%
- By 2075
- 155,027 · -21.8%
- By 2100
- 122,588 · -38.2%
Race, ethnicity, and origin ACS 2023
- Neighborhood character
- Predominantly White (72%)
- Race & ethnicity
- White 72% Black 17% Two or more races 8% Hispanic / Latino 3%
- Common ancestry
- Romanian 2% Slovak 2% Serbian 1%
- Foreign-born
- 2% · Canada
- Languages at home
- 96% English-only · Spanish 1% French/Haitian/Cajun 1% Other Indo-European 1%
Political lean MEDSL · Sangamon
- 2024 margin
- Toss-up / Even · D 46.6% · R 51.6% · Other 1.8%
- 2008→2024 swing
- -9.3pp toward R · 2008: 4.4pp · 2024: -5.0pp
- All cycles
- 2024: R+5.0 2020: R+4.4 2016: R+9.4 2012: R+8.7 2008: D+4.4
Not yet ingested
- Civics
- —
Market trends
- HPI YoY
- ▼ -79.98%
- Current HPI
- 149.1926
- Rent YoY
- ▲ 4.95%
- Metro
- Springfield, IL
- State GDP YoY
- ▲ 1.59%
- F500 in state
- 60
Industry mix (Fortune 500 HQ in IL)
| Industry | F500 HQs | Revenue |
|---|---|---|
| Insurance | 4 | $201B |
|
||
| Consumer Goods | 4 | $87B |
|
||
| Industrial Machinery | 3 | $64B |
|
||
| Healthcare | 2 | $55B |
|
||
| Retail / Pharmacy | 1 | $148B |
|
||
| Agriculture / Food | 1 | $86B |
|
||
Price history
+16.7% since first listed7 events — show timeline
- 2026-06-05 Listed $70,000 RMLSA as Distributed by MLS Grid
- 2022-03-01 Sold (Public Records) $65,000 Public Records
- 2022-02-25 Sold (MLS) $65,000 RMLSA as Distributed by MLS Grid
- 2021-11-05 Listed $61,500 RMLSA as Distributed by MLS Grid
- 2021-08-06 Listing Removed — RMLSA as Distributed by MLS Grid
- 2021-08-06 Listing Removed — RMLSA as Distributed by MLS Grid
- 2004-03-18 Sold (Public Records) $60,000 Public Records
Property tax history
+3.6%/yrLatest (2025): $1,841 · +5.4% YoY. Source: county tax records.
Cash-flow waterfall
monthlySold comps — $/sqft
last 12 mo · ≤1 miLoading sold comps…