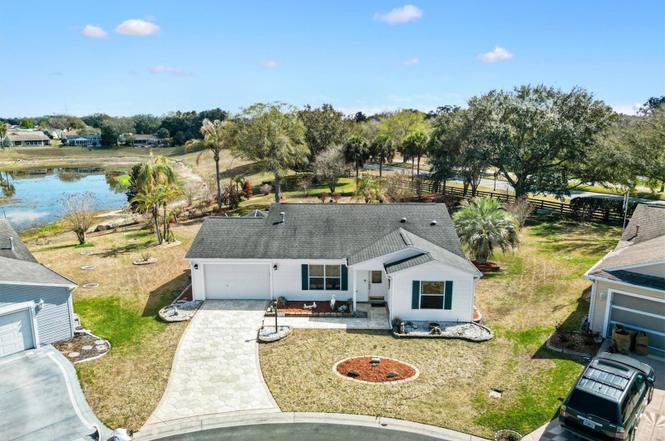
1611 Alhambra Way · The Villages, FL
Flood risk 1/10 · Minimal
- FEMA flood zone
- X (unshaded)
- Chance of flooding over 30 yrs
- 0.0%
- Est. flood insurance / yr
- $507 – $1,088
Fire risk 3/10 · Minor
- Est. fire insurance / yr
- $947 – $1,759
Heat risk 8/10 · Major
- Hot days now (above 109°F)
- 7 days/yr
- Hot days in 30 yrs
- 20 days/yr
Wind risk 9/10 · Severe
- Chance of severe wind over 30 yrs
- 99.0%
Air-quality risk 3/10 · Minor
- Unhealthy air days now
- 2 days/yr
- Unhealthy air days in 30 yrs
- 2 days/yr
Risk factors via First Street. Map © Google.
Why this score? — see what drove the F grade
The composite is a weighted blend of 9 inputs, each scored 0–100. Each bar is that input's sub-score; the figure is the points it added to the 100-point composite (weight × sub-score).
- Cash flow +12.4/30.0
- Schools +5.2/10.0
- DSCR +3.7/10.0
- Rent growth +3.5/5.0
- Livability +3.5/5.0
- 1% rule +3.3/10.0
- Condition / age +2.5/5.0
- ARV discount +0.0/15.0
- Appreciation +0.0/10.0
$349,000
🖨 Deal sheet (PDF) 📄 Offer letter ✓ Due diligence
Listing remarks
Endless possibilities! Add your personal touches and creativity to this oversized lot to create your own backyard oasis. You won’t find many properties that will provide the space and perfect location if you would like to put in a pool, extend the lanai or design a custom patio so that you can entertain family and friends. The home is already hard-wired for a hot tub under the added bird cage. This beautifully maintained 2/2 Austin model is being offered turnkey if you choose, has a water view and is perfectly positioned on a cul-de-sac lot in the desirable Village of Alhambra. NO BOND. Roof 2019. A decorative paver driveway and sidewalk lead to your covered front porch, welcoming you
Key facts
- Covered front porch
- Ceramic tile floors
- Wood-look laminate
Tags
Property features AI
Finance
- Other: Turnkey furnished option available
- Financial info: Total monthly association fees reported; Total annual association fees reported
- HOA & community: Association amenities include pool, fitness center, tennis, pickleball, basketball, racquetball, shuffleboard, golf and recreation facilities; Association fees cover pool and recreational facilities; Community features include deed restrictions, irrigation with reclaimed water, sidewalks, golf and golf cart access; Senior community; Pets allowed
Exterior
- Parking: Attached garage (1 car) with garage door opener; Garage dimensions approximately 18 x 26; Driveway parking
- Utilities: Public water; Public sewer; Electricity connected and available; Natural gas connected and available; Cable available; Phone available; Broadband / high-speed internet available; Sewer connected; Water connected
- Home design: Single family residence; One story; Northwest facing; Entry model: Austin; Property in a PUD; Homestead property; CDD present
- Construction: Vinyl siding over frame construction; Shingle roof; Slab foundation; Built as model 'Austin'
- Exterior features: Covered front and rear porches; Screened porch; Rain gutters; Sidewalk; Sliding doors; Trees and landscaped yard; Cul-de-sac lot; Irregular, oversized lot; Paved road access
Interior
- Kitchen: Dishwasher; Microwave; Range; Refrigerator; Solid wood cabinets
- Bedrooms: 2 bedrooms
- Flooring: Ceramic tile; Laminate
- Bathrooms: 2 full bathrooms
- Heating & cooling: Central heating; Central air conditioning
- Interior features: Ceiling fans; High ceilings; Living room / dining room combo; Open floorplan; Solid wood cabinets; Split bedroom layout; Vaulted ceilings; Walk-in closets; Window treatments
- Laundry & utility: Washer and dryer included; Laundry located in garage; Gas water heater
Neighborhood map
What this means for you Summary
Snapshot
- This is a 2-bed/2.0-bath single-family listed at $349k.
Deal economics
- At list price, monthly cash flow is $-56 ($-676/yr) — negative.
- To cash-flow at today's rent, offer at most $339k (2.9% below list).
- To meet the 1% rule (rent ≥ 1% of price), the offer needs to be $291k (16.7% below list).
- Recommended offer: $291k (16.7% below list) — sets the bar for 1% rule.
- Cap rate 6.1% vs local median 5.0% in The Villages — meaningfully above typical; check what's discounted (condition, days-on-market, listing class) to confirm the premium yield is real.
Location & tenants
- Location reads 70/100 on livability (#431 in FL) — a middle-class / working-renter tenant base. Strengths: crime A+, housing A, employment B+; Watch: amenities F, commute F, health & safety F.
- Sumter (rural): math 61% / reading 61% proficiency, ranked #11 of 73 in FL (top 15%) — acceptable for families but not a draw, mixed tenant base, ~2y average lease.
- Zoned schools: Wildwood Elementary School (math 49% / reading 52%, grade D+, #1,055 of 2,144 statewide, top 50%, 940 students, 76% FRL); South Sumter Middle School (math 55% / reading 54%, grade B-, #183 of 571 statewide, top 34%, 897 students, 61% FRL) — zoned schools average 68% FRL vs 51% district-wide (18 pts higher); higher-poverty schools than district average — tighter screening recommended.
- Market conditions: Rents rising (+3.9%/yr); 551 active listings in the ZIP; 13 comparable units currently listed for rent nearby; rentals at typical pace (median 23d on market — plan ~3-4 weeks tenant-placement turnaround); 3,961 units permitted in Sumter County in 2024 (248 in 5+ unit buildings).
- At $2,907/mo this rent would consume 47% of the median local household income ($74k/yr) (locally 987% of renters already pay >50% of income on rent) — very limited rent-growth headroom before tenants either downsize or default.
Forward outlook
- Local home prices are declining (-3.0%/yr); year-one equity from $2k of loan paydown is wiped out by about $10k of value loss. Plan a longer hold.
- Sumter County population projected at +45% by 2050 — long-run rental-demand tailwind backs the buy-and-hold thesis.
Negotiation context
- It's been on market 107 days — a 9% lower offer ($318k) is reasonable based on typical stale-listing flexibility.
Risks & watch-outs
- Climate carrying-cost: severe wind risk, 99% chance of damaging wind over 30y; extreme-heat days projected 7→20/yr by 2055 (HVAC capex compounding) — expect insurance premiums to compound above CPI over the hold.
Questions for the listing agent
- What do current leases actually rent for vs. the listed asking? Can we see a recent rent roll and the last 12 months of T-12 income?
- It's been on market 107 days. Have you received any prior offers? Is the seller open to a 17% concession, seller financing, or rate buy-down credit?
- What does the HOA fee cover, when was the last increase, and are there any pending special assessments or reserve-fund shortfalls?
- Why hasn't it sold? Are there any deal-killer items the seller is aware of (foundation, flood, title, zoning, code violations)?
- Is there a deadline driving the sale (1031 exchange, divorce, estate, relocation)? That informs how much negotiation room exists.
- Schools are A-rated — typically a magnet for longer-tenancy family renters. What's the average tenant stay here, and is there a school-zone premium baked into asking?
- The area grade is low — what's the realistic commute time and amenity access for the typical tenant pool here? Any planned neighborhood developments (good or bad) we should know about?
- What's the average days-on-market for RENTAL listings here right now (not sales)? A rising rental-DOM trend means longer vacancies and softer asking-rent achievability than the comps imply.
- What's the recent tenant-quality profile in this submarket — average credit score on applications, eviction rate, late-payment / NSF rate, and stable-employment percentage? A property-management company in the area should have these aggregated.
- How much new for-sale + rental construction is in the pipeline within 1–3 miles? Heavy new supply typically softens prices + rents 12–24 months out; constrained supply supports both.
Investment metrics
- 1% rule
- 0.83% ✗
- Cap rate
- 6.10%
- Cash-on-cash
- -0.69%
- DSCR
- 0.97
- GRM
- 10.0
CMA / ARV
- ARV (on-the-fly)
- $258,300
- Comps found
- 12
Show comp detail 12 sales within ~0.75 mi
| Address | Dist | Beds/Ba | Sqft | Sold | Price | $/sf | Match |
|---|---|---|---|---|---|---|---|
| 2632 Moncayo Ave | 0.18mi | 2/2.0 | 1,143 (-0%) | 2mo | $220,000 | $192 | 89 |
| 2603 Olivarez Way | 0.26mi | 2/2.0 | 1,121 (-2%) | 2mo | $252,000 | $225 | 82 |
| 1423 Conchas Dr | 0.36mi | 2/2.0 | 1,150 (+0%) | 2mo | $282,000 | $245 | 82 |
| 1612 Campos Dr | 0.29mi | 2/2.0 | 1,121 (-2%) | 1mo | $230,000 | $205 | 82 |
| 1647 Campos Dr | 0.31mi | 2/2.0 | 1,121 (-2%) | 1mo | $250,000 | $223 | 81 |
| 2981 Fair Oak Ter | 0.41mi | 2/2.0 | 1,164 (+1%) | 0mo | $330,000 | $284 | 78 |
| 1480 Azteca Loop | 0.35mi | 2/2.0 | 1,185 (+3%) | 1mo | $270,000 | $228 | 78 |
| 1487 Azteca Loop | 0.38mi | 2/2.0 | 1,192 (+4%) | 0mo | $299,900 | $252 | 76 |
| 2604 Privada Dr | 0.23mi | 3/2.0 (+1) | 1,210 (+5%) | 0mo | $269,000 | $222 | 75 |
| 2731 Privada Dr | 0.22mi | 2/2.0 | 1,248 (+9%) | 2mo | $250,000 | $200 | 74 |
| 1418 Azteca | 0.43mi | 2/1.0 | 986 (-14%) | 2mo | $249,000 | $253 | 51 |
| 3024 Macon Ct | 0.73mi | 2/2.0 | 1,270 (+11%) | 1mo | $270,000 | $213 | 48 |
Match score weights: distance 35% · size 25% · config 20% · recency 20%. Top-matched comps best support the ARV.
Projected returns pro-forma
-3.0% appreciation · 3.92% rent growth · sell at horizon
- IRR
- -16.4%
- Equity multiple
- 0.41×
- Total profit
- $-57,417
- Equity at exit
- $52,037
- IRR
- -6.7%
- Equity multiple
- 0.56×
- Total profit
- $-43,232
- Equity at exit
- $30,175
Cash invested: $97,720 (down + closing). Projections, not guarantees.
Landlord ↔ Tenant lean methodology
- Overall (STATE)
- 87 Strongly Landlord-Friendly
- State Florida
- 87 Strongly Landlord-Friendly · R+3
- County
- — inherits STATE
- City
- — inherits STATE
ZIP-level market 32162
- Home prices YoY
- -6.9%
- Rents YoY
- 3.9%
- Active inventory
- 551
- Price-to-rent
- 10.0×
Monthly cashflow live
- Estimated rent
- $2,907 high interval (Pro) →
- Mortgage (P&I)
- −$1,830
- Tax from tax record
- −$173 /mo · $2,081/yr
- Insurance
- −$145
- HOA
- −$204
- Vacancy / Maint / Mgmt
- −$611
- Net cashflow
- $-56
Break-even live
Sensitivity live
| Price | -10% $141 | -5% $42 | +0% $-56 | +5% $-155 | +10% $-254 |
|---|---|---|---|---|---|
| Rent | -10% $-286 | -5% $-171 | +0% $-56 | +5% $59 | +10% $173 |
| Rate | -1.0pp $119 | -0.5pp $32 | base $-56 | +0.5pp $-147 | +1.0pp $-239 |
UW: 25.0% down · 7.5% · 30yr · 1.5% tax · 5.0% vac · 8.0% maint · 8.0% mgmt
Financing live
Cash to close
- Down payment
- $87,250
- Closing costs
- $10,470
- Reserves months
- —
- Total cash needed
- —
Loan-product check · same deal, 3 products live
Conventional
25% down · 7.5% · 30yr
- Down + closing
- —
- Monthly P&I
- —
- Monthly cashflow
- —
- DSCR
- —
- Eligible?
- —
Personal DTI + credit; lowest rate.
DSCR
20% down · 8.5% · 30yr
- Down + closing
- —
- Monthly P&I
- —
- Monthly cashflow
- —
- DSCR
- —
- Eligible?
- —
No personal income docs; deal must DSCR.
Hard money
10% down · 12.0% · 12mo
- Down + closing
- —
- Monthly P&I
- —
- Monthly cashflow
- —
- DSCR
- —
- Eligible?
- —
Short-term bridge; refi at stabilization.
Rent comps 13 comps
| Address | Beds | Baths | Sqft | Rent | $/sqft | DOM | Units | Dist |
|---|---|---|---|---|---|---|---|---|
| 2909 Meadow Lawn Ln The Villages, FL | 2.0 | 2.0 | 1132 | $4,300 | $3.80 | 23d | 1 | 0.34mi |
| 1648 Belle Grove Dr The Villages, FL | 2.0 | 2.0 | 1132 | $4,250 | $3.75 | 23d | 1 | 0.34mi |
| 1808 Peachtree Ave The Villages, FL | 2.0 | 2.0 | 1182 | $2,500 | $2.12 | 23d | 1 | 0.65mi |
| 17713 SE 95th Cir Summerfield, FL | 3.0 | 2.0 | 1450 | $2,000 | $1.38 | 23d | 1 | 0.69mi |
| 2829 Burgos Dr The Villages, FL | 2.0 | 2.0 | 1156 | $1,850 | $1.60 | 23d | 1 | 0.73mi |
| 1129 Santa Cruz Dr The Villages, FL | 2.0 | 2.0 | 1102 | $2,350 | $2.13 | 23d | 1 | 0.76mi |
| 17532 SE 100th Ct Summerfield, FL | 2.0 | 2.0 | 1217 | $1,800 | $1.48 | 23d | 1 | 1.04mi |
| 10397 SE 176th St Summerfield, FL | 2.0 | 2.0 | 1296 | $2,150 | $1.66 | 23d | 1 | 1.15mi |
| 2006 Cardona Way Lady Lake, FL | 2.0 | 2.0 | 1428 | $3,900 | $2.73 | 23d | 1 | 1.24mi |
| 17199 SE 97th Ter Summerfield, FL | 3.0 | 2.0 | 1404 | $1,990 | $1.42 | 23d | 1 | 1.31mi |
| 888 Radclife Berea Pl The Villages, FL | 2.0 | 2.0 | 1288 | $4,200 | $3.26 | 23d | 1 | 1.35mi |
| 8544 SE 177th Bartram Loop The Villages, FL | 2.0 | 2.0 | 1265 | $1,900 | $1.50 | 23d | 1 | 1.38mi |
| 971 Kingmont Ter The Villages, FL | 3.0 | 2.0 | 1392 | $3,400 | $2.44 | 23d | 1 | 1.41mi |
HOA detail
- Monthly dues
- $204 · $2,448/yr
- Likely covers
- waterpool
Listing history 19 events
-
2026-06-22days on market $349,000 Active 107 DOM
-
2026-06-19days on market $349,000 Active 105 DOM
-
2026-06-18days on market $349,000 Active 104 DOM
-
2026-06-17days on market $349,000 Active 103 DOM
-
2026-06-16days on market $349,000 Active 102 DOM
-
2026-06-15days on market $349,000 Active 101 DOM
-
2026-06-14days on market $349,000 Active 99 DOM
-
2026-06-13days on market $349,000 Active 98 DOM
-
2026-06-10days on market $349,000 Active 96 DOM
-
2026-06-09days on market $349,000 Active 95 DOM
-
2026-06-08days on market $349,000 Active 94 DOM
-
2026-06-07days on market $349,000 Active 93 DOM
-
2026-06-02days on market $349,000 Active 88 DOM
-
2026-06-01days on market $349,000 Active 87 DOM
-
2026-05-31days on market $349,000 Active 86 DOM
-
2026-05-30days on market $349,000 Active 85 DOM
-
2026-04-27price $349,000
-
2026-03-31price $370,000
-
2026-03-06$395,000 Active
ⓘ Source: listings_history table (triggers on properties + properties_extension) + one-shot
backfill from property_details.listing_events for pre-trigger history.
Tax reassessment forecast FL · Resets to sale price
- Current annual tax
- $2,081 · $173/mo
- Projected year-2 tax
- $2,897 · $241/mo
- Expected delta
- +$816/yr (+$68/mo · 39.2%)
ⓘ Screening estimate from a state-policy table — verify with the county assessor before closing.
Climate risk First Street
- Flood 1/10 Low FEMA zone X (unshaded) · 0% chance over 30 yrs
- Wildfire 3/10 Moderate
- Heat 8/10 Severe 7 d/yr ≥109°F today · 20 d/yr by 30 yrs out
- Wind 9/10 Extreme 99% chance of damaging wind over 30 yrs
- Air quality 3/10 Moderate 2 unhealthy d/yr today · 2 by 30 yrs out
Nearby sold comps map
Loading sold comps map…
Walkable amenities ~0.75 mi
Loading nearby amenities…
Taxation est. · year 1
- Rental income
- $34,887
- − Mortgage interest
- −$19,549
- − Property taxes
- −$2,081
- − Insurance
- −$1,745
- − Repairs & maintenance
- −$2,791
- − Management
- −$2,791
- − HOA
- −$2,448
- − Depreciation
- −$10,153
- Taxable loss
- −$6,671
- Est. tax savings @ 24.0%
- +$1,601
- After-tax cash flow
- $925/yr
For passive investors: Depreciation is non-cash, so a rental often shows a tax loss while cash-flowing — sheltering income. Rental losses are passive: they offset passive income freely, and up to $25,000/yr can offset ordinary (W-2) income if you actively participate and your MAGI is under $100k (phasing out to $0 by $150k); unused losses carry forward. On sale, claimed depreciation is recaptured at up to 25%, and gains may owe capital-gains tax (a 1031 exchange can defer both). Figures are a year-1 estimate at your 24.0% rate — not tax advice; consult a CPA.
Schools (NCES district)
- District
- Sumter
- NCES district ID
- 1201800
- Math proficiency
- 61% ▼ -4.00%
- Reading proficiency
- 61% ▼ -2.00%
- Median HH income
- $48,240
- Composite
- 51.74/100
- National rank
- #1682
- State rank
- #11 of 73 in FL
Livability — The Villages
- Score
- 70/100
- State rank
- #431
- US rank
- #7363
Category grades
Schools grade is shown separately in the Schools card above.
Census & demographics
- Census place
- The Villages, FL
- County
- Sumter County · 110,591 people
- City population
- 83,973
- Metro
- The Villages, FL
- Population (ZIP)
- 55,424
- Household income
- $74,119
- Rent vs Own
- Severe rent burden
- 987.0
Population outlook (Sumter County) Hauer SSP2
- Today (2025)
- 161,172 people
- By 2030
- 180,083 · +11.7%
- By 2040
- 209,892 · +30.2%
- By 2050
- 234,186 · +45.3%
- By 2075
- 284,602 · +76.6%
- By 2100
- 317,039 · +96.7%
Race, ethnicity, and origin ACS 2023
- Neighborhood character
- Predominantly White (95%)
- Race & ethnicity
- White 95% Two or more races 2% Hispanic / Latino 2% Asian 1% Black 1%
- Common ancestry
- Romanian 7% Slovak 4% Lithuanian 4%
- Foreign-born
- 5% · Canada
- Languages at home
- 96% English-only · Spanish 1% Tagalog/Filipino 1%
Political lean MEDSL · Sumter
- 2024 margin
- Solid R (+37.6) · D 30.9% · R 68.6%
- 2008→2024 swing
- -10.6pp toward R · 2008: -27.0pp · 2024: -37.6pp
- All cycles
- 2024: R+37.6 2020: R+36.1 2016: R+39.2 2012: R+34.9 2008: R+27.0
Not yet ingested
- Civics
- —
Market trends
- HPI YoY
- ▼ -16.16%
- Current HPI
- 218.1956
- Rent YoY
- ▲ 3.92%
- Metro
- The Villages, FL
- State GDP YoY
- ▲ 3.28%
- F500 in state
- 36
Industry mix (Fortune 500 HQ in FL)
| Industry | F500 HQs | Revenue |
|---|---|---|
| Industrial Technology | 2 | $29B |
|
||
| Insurance | 2 | $17B |
|
||
| Retail | 1 | $60B |
|
||
| Technology Distribution | 1 | $58B |
|
||
| Homebuilding | 1 | $35B |
|
||
| Technology Manufacturing | 1 | $35B |
|
||
Price history
-11.6% since first listed3 events — show timeline
- 2026-04-27 Price Changed $349,000 Stellar MLS as Distributed by MLS Grid
- 2026-03-31 Price Changed $370,000 Stellar MLS as Distributed by MLS Grid
- 2026-03-06 Listed $395,000 Stellar MLS as Distributed by MLS Grid
Property tax history
+1.9%/yrLatest (2025): $2,081 · +1.3% YoY. Source: county tax records.
Cash-flow waterfall
monthlySold comps — $/sqft
last 12 mo · ≤1 miLoading sold comps…