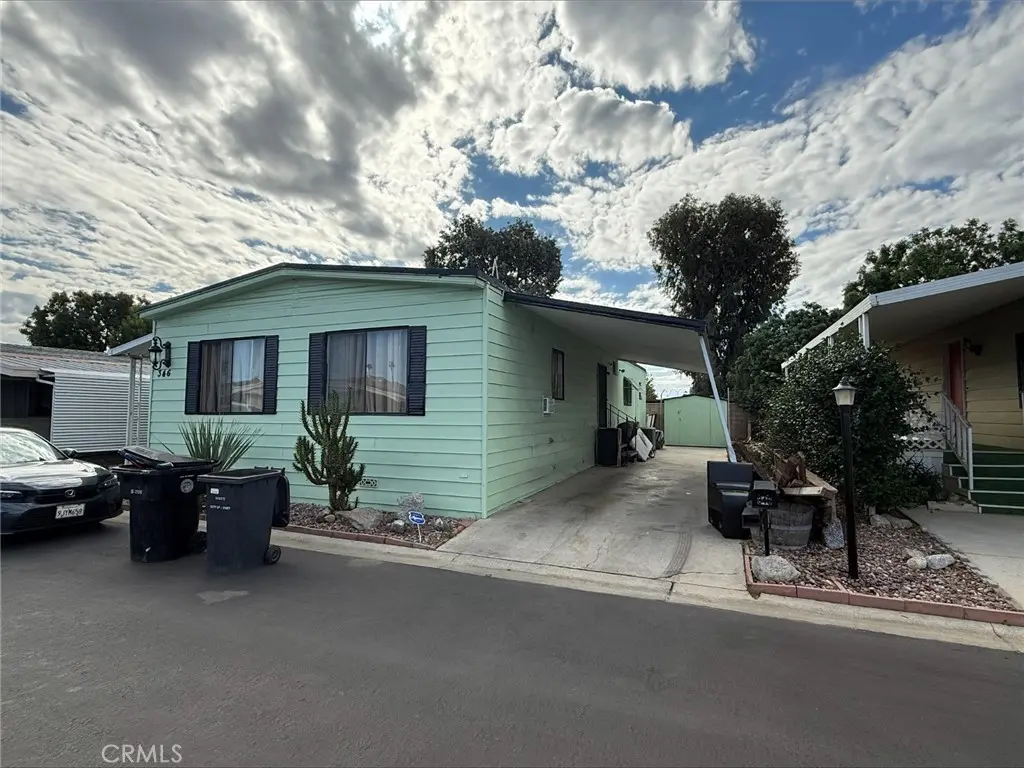
601-Street N Kirby #346 · Hemet, CA
Flood risk 1/10 · Minimal
- FEMA flood zone
- X (unshaded)
- Chance of flooding over 30 yrs
- 0.0%
- Est. flood insurance / yr
- $507 – $1,088
Fire risk 6/10 · Moderate
- Est. fire insurance / yr
- $659 – $1,223
Heat risk 7/10 · Major
- Hot days now (above 104°F)
- 5 days/yr
- Hot days in 30 yrs
- 14 days/yr
Wind risk 1/10 · Minimal
- Chance of severe wind over 30 yrs
- —
Air-quality risk 6/10 · Moderate
- Unhealthy air days now
- 12 days/yr
- Unhealthy air days in 30 yrs
- 14 days/yr
Risk factors via First Street. Map © Google.
Why this score? — see what drove the B- grade
The composite is a weighted blend of 9 inputs, each scored 0–100. Each bar is that input's sub-score; the figure is the points it added to the 100-point composite (weight × sub-score).
- Cash flow +30.0/30.0
- 1% rule +10.0/10.0
- DSCR +10.0/10.0
- ARV discount +7.5/15.0
- Rent growth +3.4/5.0
- Livability +2.6/5.0
- Schools +2.5/10.0
- Condition / age +2.2/5.0
- Appreciation +0.0/10.0
$80,000
🖨 Deal sheet 📄 Offer letter ✓ Due diligence
Listing remarks MLS
A very nice open floor plan, Galley kitchen and a nice size dining room 2 perfect size bedrooms. Laminate flooring. A nice private side patio and a small backyard, a large long driveway, room for 3 cars. Such a nice quiet neighborhood.
Key facts
- Open floor plan
- Galley kitchen
- Small backyard
Tags
Neighborhood map
What this means for you Summary
Snapshot
- This is a 2-bed/2.0-bath manufactured listed at $80k. Condition is rated fair.
Deal economics
- At list price, monthly cash flow is $1k ($13k/yr) — positive.
- The deal already cash-flows at list — no discount required.
- Meets the 1% rule at list price ($2k rent vs $80k).
- Recommended offer: $70k (12.0% below list) — sets the bar for market timing.
- Cap rate 22.6% vs local median 4.9% in Hemet — top-decile yield for the area; either an underpriced asset or a hidden risk that comps aren't pricing in. Stress-test before assuming the spread holds.
Location & tenants
- Location reads 51/100 on livability (#1,056 in CA) — a working-class tenant base; expect higher turnover. Strengths: housing A+; Watch: crime D+, schools F, amenities F.
- Hemet Unified (suburban): math 19% / reading 41% proficiency, ranked #360 of 517 in CA (top 70%) — families likely to look elsewhere, expect single-tenant / working-renter base with shorter leases; 66% free/reduced lunch — lower-income household profile, screen leases tightly.
- Market conditions: Rents rising (+3.7%/yr); 290 active listings in the ZIP; 34 comparable units currently listed for rent nearby; rentals at typical pace (median 24d on market — plan ~3-4 weeks tenant-placement turnaround); 9,195 units permitted in Riverside County in 2024 (1,512 in 5+ unit buildings).
- This rent runs 39% of the median local income ($64k/yr) — at the standard rent-burdened threshold; future hikes will face affordability resistance.
Forward outlook
- Local home prices are declining (-3.0%/yr); year-one equity from $553 of loan paydown is wiped out by about $2k of value loss. Plan a longer hold.
- Riverside County population projected at +22% by 2050 — long-run rental-demand tailwind backs the buy-and-hold thesis.
- At projected returns (-3.0% appreciation + 3.7% rent growth), your $22k cash investment doubles in ~2 years — after that, you're playing with house money.
Negotiation context
- It's been on market 239 days — a 12% lower offer ($70k) is reasonable based on typical stale-listing flexibility.
Risks & watch-outs
- Climate carrying-cost: major wildfire risk; extreme-heat days projected 5→14/yr by 2055 (HVAC capex compounding) — expect insurance premiums to compound above CPI over the hold.
Questions for the listing agent
- It's been on market 239 days. Have you received any prior offers? Is the seller open to a 12% concession, seller financing, or rate buy-down credit?
- Have any recent inspections been done? Can we get a copy of the seller's disclosures and any deferred-maintenance estimates?
- Built in 1972 — when were the roof, HVAC, electrical panel, plumbing, and water heater last replaced?
- Why hasn't it sold? Are there any deal-killer items the seller is aware of (foundation, flood, title, zoning, code violations)?
- Is there a deadline driving the sale (1031 exchange, divorce, estate, relocation)? That informs how much negotiation room exists.
- Schools are F-rated, which usually means shorter tenancies and higher turnover. Who's the typical renter profile here, and what's been the actual vacancy rate?
- Crime grade is D in this area — have there been break-ins, vandalism, or insurance claims at this property in the last 3 years? What carrier currently insures it and at what premium?
- What's the average days-on-market for RENTAL listings here right now (not sales)? A rising rental-DOM trend means longer vacancies and softer asking-rent achievability than the comps imply.
- What's the recent tenant-quality profile in this submarket — average credit score on applications, eviction rate, late-payment / NSF rate, and stable-employment percentage? A property-management company in the area should have these aggregated.
- How much new for-sale + rental construction is in the pipeline within 1–3 miles? Heavy new supply typically softens prices + rents 12–24 months out; constrained supply supports both.
Investment metrics
- 1% rule
- 2.60% ✓
- Cap rate
- 22.61%
- Cash-on-cash
- 58.27%
- DSCR
- 3.59
- GRM
- 3.2
CMA / ARV
- ARV (median comp)
- $51,674
- List price
- $80,000
- Delta
- 54.82%
- Verdict
- OVERPRICED
- Comps
- 20 within 1.0 mi
Show comp detail 12 sales within ~0.75 mi
| Address | Dist | Beds/Ba | Sqft | Sold | Price | $/sf | Match |
|---|---|---|---|---|---|---|---|
| 601 N Kirby St #501 | 0.00mi | 2/2.0 | 1,440 (0%) | 0mo | $49,000 | $34 | 100 |
| 601 Kirby St N #451 | 0.02mi | 2/2.0 | 1,440 (0%) | 0mo | $60,000 | $42 | 99 |
| 601 Kirby St N #235 | 0.00mi | 2/2.0 | 1,440 (0%) | 3mo | $84,000 | $58 | 98 |
| 601 N Kirby St #67 | 0.00mi | 2/2.0 | 1,440 (0%) | 6mo | $73,000 | $51 | 95 |
| 601 N Kirby St #220 | 0.00mi | 2/2.0 | 1,440 (0%) | 6mo | $38,500 | $27 | 95 |
| 601 N Kirby St #159 | 0.04mi | 3/2.0 (+1) | 1,440 (0%) | 5mo | $69,000 | $48 | 89 |
| 601 N Kirby #177 | 0.21mi | 2/2.0 | 1,344 (-7%) | 1mo | $10,000 | $7 | 78 |
| 601 N Kirby St #267 | 0.00mi | 2/2.0 | 1,248 (-13%) | 3mo | $82,250 | $66 | 75 |
| 601 N Kirby #269 | 0.00mi | 3/2.0 (+1) | 1,652 (+15%) | 6mo | $105,000 | $64 | 66 |
| 1895 W Devonshire #20 | 0.75mi | 2/2.0 | 1,344 (-7%) | 1mo | $44,000 | $33 | 53 |
| 1895 W Devonshire Ave #76 | 0.75mi | 2/2.0 | 1,344 (-7%) | 4mo | $55,000 | $41 | 51 |
| 1895 W Devonshire Ave #74 | 0.75mi | 3/2.0 (+1) | 1,344 (-7%) | 2mo | $80,000 | $60 | 47 |
Match score weights: distance 35% · size 25% · config 20% · recency 20%. Top-matched comps best support the ARV.
Projected returns pro-forma
-3.0% appreciation · 3.74% rent growth · sell at horizon
- IRR
- 57.7%
- Equity multiple
- 3.59×
- Total profit
- $57,906
- Equity at exit
- $11,928
- IRR
- 62.8%
- Equity multiple
- 7.53×
- Total profit
- $146,249
- Equity at exit
- $6,917
Cash invested: $22,400 (down + closing). Projections, not guarantees.
Landlord ↔ Tenant lean methodology
- Overall (STATE)
- 18 Strongly Tenant-Friendly
- State California
- 18 Strongly Tenant-Friendly · D+13
- County
- — inherits STATE
- City
- — inherits STATE
ZIP-level market 92545
- Home prices YoY
- -24.6%
- Rents YoY
- 3.7%
- Active inventory
- 290
- Price-to-rent
- 3.2×
Monthly cashflow live
- Estimated rent
- $2,077 high interval (Pro) →
- Mortgage (P&I)
- −$420
- Tax est. 1.5%
- −$100 /mo · $1,200/yr
- Insurance
- −$33
- HOA
- −$0
- Vacancy / Maint / Mgmt
- −$436
- Net cashflow
- $1,088
Break-even live
UW: 25.0% down · 7.5% · 30yr · 1.5% tax · 5.0% vac · 8.0% maint · 8.0% mgmt
Financing live
Cash to close
- Down payment
- $20,000
- Closing costs
- $2,400
- Reserves months
- —
- Total cash needed
- —
Loan-product check · same deal, 3 products live
Conventional
25% down · 7.5% · 30yr
- Down + closing
- —
- Monthly P&I
- —
- Monthly cashflow
- —
- DSCR
- —
- Eligible?
- —
Personal DTI + credit; lowest rate.
DSCR
20% down · 8.5% · 30yr
- Down + closing
- —
- Monthly P&I
- —
- Monthly cashflow
- —
- DSCR
- —
- Eligible?
- —
No personal income docs; deal must DSCR.
Hard money
10% down · 12.0% · 12mo
- Down + closing
- —
- Monthly P&I
- —
- Monthly cashflow
- —
- DSCR
- —
- Eligible?
- —
Short-term bridge; refi at stabilization.
Rent comps 34 comps
| Address | Beds | Baths | Sqft | Rent | $/sqft | DOM | Units | Dist |
|---|---|---|---|---|---|---|---|---|
| 2770 W Devonshire Ave Hemet, CA | 1.0–2.0 | 1.0–2.0 | 707 | $1,945 | $2.75 | 1d | 11 | 0.25mi |
| 743 Via Linda Dr Hemet, CA | 2.0 | 2.0 | 1206 | $1,995 | $1.65 | 5d | 1 | 0.28mi |
| 811 Alondra Dr Hemet, CA | 2.0 | 2.0 | 1166 | $1,875 | $1.61 | 4d | 1 | 0.31mi |
| 853 Ensenada Dr Hemet, CA | 2.0 | 2.0 | 1350 | $1,875 | $1.39 | 24d | 1 | 0.36mi |
| 853 Ensenada Dr Hemet, CA | 2.0 | 2.0 | 1350 | $1,875 | $1.39 | 11d | 1 | 0.36mi |
| 3471 Dublin Ct Hemet, CA | 3.0 | 2.0 | 1276 | $2,895 | $2.27 | 3d | 1 | 0.37mi |
| 1964 W Oakland Ave Hemet, CA | 2.0 | 2.0 | 977 | $1,695 | $1.73 | 17d | 1 | 0.59mi |
| 2014 Iris Way Hemet, CA | 3.0 | 2.0 | 1192 | $2,850 | $2.39 | 43d | 1 | 0.64mi |
| 3800 W Devonshire Ave Hemet, CA | 3.0 | 1.0–2.0 | 816 | $2,055 | $2.52 | 1d | 8 | 0.64mi |
| 1862 Pueblo Dr Unit 1862 Hemet, CA | 2.0 | 2.0 | 977 | $1,750 | $1.79 | 24d | 1 | 0.64mi |
| 1862 Pueblo Dr Hemet, CA | 2.0 | 2.0 | 977 | $1,900 | $1.94 | 43d | 1 | 0.64mi |
| 627 Solano Dr Hemet, CA | 2.0 | 2.0 | 882 | $1,800 | $2.04 | 18d | 1 | 0.64mi |
| 2208 El Grande St Hemet, CA | 2.0 | 2.0 | 1327 | $2,100 | $1.58 | 17d | 1 | 0.67mi |
| 1700 Walden Ln Hemet, CA | 3.0 | 2.0 | 1430 | $2,670 | $1.87 | 24d | 1 | 0.77mi |
| 3030 W Acacia Ave Hemet, CA | 1.0–3.0 | 1.0–2.0 | 892 | $1,895 | $2.12 | 1d | 10 | 0.79mi |
| 543 La Cresta Dr Hemet, CA | 2.0 | 2.0 | 1544 | $1,595 | $1.03 | 43d | 1 | 0.80mi |
| 1245 Millie Dr Hemet, CA | 3.0 | 2.0 | 1392 | $2,850 | $2.05 | 7d | 1 | 0.83mi |
| 2469 W Acacia Ave Hemet, CA | 2.0 | 2.0 | 910 | $1,750 | $1.92 | 24d | 1 | 0.91mi |
| 2403 W Acacia Ave Hemet, CA | 2.0 | 2.0 | 910 | $1,995 | $2.19 | 7d | 1 | 0.92mi |
| 663 Mariposa Dr Hemet, CA | 2.0 | 2.0 | 1440 | $1,500 | $1.04 | 24d | 1 | 0.96mi |
| 2098 W Acacia Ave Hemet, CA | 1.0–3.0 | 1.0–2.0 | 895 | $2,035 | $2.27 | 1d | 1 | 0.96mi |
| 446 N Elk St Unit D Hemet, CA | 2.0 | 1.0 | 980 | $1,675 | $1.71 | 24d | 1 | 1.01mi |
| 1270 Rosalia Ave Unit 1 Hemet, CA | 2.0 | 1.0 | 900 | $1,800 | $2.00 | 43d | 1 | 1.03mi |
| 250 N Elk St Hemet, CA | 2.0 | 1.0 | 900 | $1,625 | $1.81 | 13d | 1 | 1.08mi |
| 1315 W Latham Ave Hemet, CA | 3.0 | 2.5 | 1340 | $2,550 | $1.90 | 43d | 1 | 1.11mi |
| 828 Coramdeo Ct Hemet, CA | 3.0 | 2.0 | 1543 | $3,000 | $1.94 | 43d | 1 | 1.12mi |
| 4400 W Florida Ave Unit 86 Hemet, CA | 3.0 | 2.0 | 1310 | $1,800 | $1.37 | 43d | 1 | 1.15mi |
| 4400 W Florida Ave Spc 26 Hemet, CA | 3.0 | 2.0 | 1193 | $1,699 | $1.42 | 14d | 1 | 1.18mi |
| 1967 Connor Ln San Jacinto, CA | 3.0 | 2.5 | 1708 | $2,950 | $1.73 | 7d | 1 | 1.28mi |
| 1850 Amberwood Dr Hemet, CA | 2.0 | 2.0 | 1170 | $1,561 | $1.33 | 43d | 1 | 1.29mi |
| 471 Whitney Dr Hemet, CA | 2.0 | 2.0 | 1085 | $1,800 | $1.66 | 5d | 1 | 1.30mi |
| 683 Jonquil St Hemet, CA | 3.0 | 2.0 | 1150 | $2,448 | $2.13 | 24d | 1 | 1.33mi |
| 1844 Paradise Way San Jacinto, CA | 3.0 | 2.0 | 1540 | $3,000 | $1.95 | 43d | 1 | 1.34mi |
| 1461 W Mayberry Ave Hemet, CA | 2.0 | 2.0 | 1044 | $1,750 | $1.68 | 43d | 1 | 1.41mi |
Listing history 14 events
-
2026-06-18days on market $80,000 Active 239 DOM
-
2026-06-17days on market $80,000 Active 238 DOM
-
2026-06-16days on market $80,000 Active 237 DOM
-
2026-06-15days on market $80,000 Active 236 DOM
-
2026-06-13days on market $80,000 Active 234 DOM
-
2026-06-09days on market $80,000 Active 230 DOM
-
2026-06-08days on market $80,000 Active 229 DOM
-
2026-06-07days on market $80,000 Active 228 DOM
-
2026-06-04days on market $80,000 Active 225 DOM
-
2026-06-03days on market $80,000 Active 224 DOM
-
2026-06-02days on market $80,000 Active 223 DOM
-
2026-06-01days on market $80,000 Active 222 DOM
-
2026-05-31days on market $80,000 Active 221 DOM
-
2025-10-22$80,000 Active 235-char remark
Show marketing remark (235 chars)
A very nice open floor plan, Galley kitchen and a nice size dining room 2 perfect size bedrooms. Laminate flooring. A nice private side patio and a small backyard, a large long driveway, room for 3 cars. Such a nice quiet neighborhood.
ⓘ Source: listings_history table (triggers on properties + properties_extension) + one-shot
backfill from property_details.listing_events for pre-trigger history.
Climate risk First Street
- Flood 1/10 Low FEMA zone X (unshaded) · 0% chance over 30 yrs
- Wildfire 6/10 Major
- Heat 7/10 Severe 5 d/yr ≥104°F today · 14 d/yr by 30 yrs out
- Wind 1/10 Low
- Air quality 6/10 Major 12 unhealthy d/yr today · 14 by 30 yrs out
Nearby sold comps map
Loading sold comps map…
Walkable amenities ~0.75 mi
Loading nearby amenities…
Taxation est. · year 1
- Rental income
- $24,921
- − Mortgage interest
- −$4,481
- − Property taxes
- −$1,200
- − Insurance
- −$400
- − Repairs & maintenance
- −$1,994
- − Management
- −$1,994
- − Depreciation
- −$2,327
- Taxable income
- $12,525
- Est. tax owed @ 24.0%
- −$3,006
- After-tax cash flow
- $10,047/yr
For passive investors: Depreciation is non-cash, so a rental often shows a tax loss while cash-flowing — sheltering income. Rental losses are passive: they offset passive income freely, and up to $25,000/yr can offset ordinary (W-2) income if you actively participate and your MAGI is under $100k (phasing out to $0 by $150k); unused losses carry forward. On sale, claimed depreciation is recaptured at up to 25%, and gains may owe capital-gains tax (a 1031 exchange can defer both). Figures are a year-1 estimate at your 24.0% rate — not tax advice; consult a CPA.
Condition & rehab AI · 8 photos
This manufactured home requires moderate renovations to update the kitchen and exterior, which would significantly increase its resale value.
Repairs flagged
- Moderate kitchen cabinets — dated and in need of updating
- Moderate kitchen appliances — dated and in need of updating
- Moderate kitchen countertops — dated and in need of updating
- Moderate exterior paint — light exterior paint, some wear
Value-add opportunities
- Resale update kitchen cabinets — modernizing the kitchen
- Resale update kitchen appliances — modernizing the kitchen
- Resale update kitchen countertops — modernizing the kitchen
- Resale paint exterior — enhancing curb appeal
Renovation cost estimate screening
| Repair item | Severity | Est. cost |
|---|---|---|
| kitchen cabinets · dated and in need of updating | Moderate | $3,000–15,000 |
| kitchen appliances · dated and in need of updating | Moderate | $3,000–15,000 |
| kitchen countertops · dated and in need of updating | Moderate | $3,000–15,000 |
| exterior paint · light exterior paint, some wear | Moderate | $3,000–15,000 |
| Total estimated repair cost · 4 items | $12,000–60,000 |
Value-add ROI direction
- Resale update kitchen cabinets — modernizing the kitchen ↑
- Resale update kitchen appliances — modernizing the kitchen ↑
- Resale update kitchen countertops — modernizing the kitchen ↑
- Resale paint exterior — enhancing curb appeal ↑
ⓘ Cost ranges are severity-bucket heuristics (US national rule-of-thumb). Get contractor quotes + a written scope before underwriting a rehab budget.
Schools (NCES district)
- District
- Hemet Unified
- NCES district ID
- 0616920
- Math proficiency
- 19% ▼ -3.00%
- Reading proficiency
- 41% ▲ 4.00%
- Median HH income
- $39,962
- Composite
- 25.16/100
- National rank
- #7517
- State rank
- #360 of 517 in CA
Livability — Hemet
- Score
- 51/100
- State rank
- #1056
- US rank
- #25208
Category grades
Schools grade is shown separately in the Schools card above.
Census & demographics
- Census place
- Hemet, CA
- County
- Riverside County · 2,287,001 people
- City population
- 137,670
- Metro
- Riverside-San Bernardino-Ontario, CA
- Population (ZIP)
- 45,982
- Household income
- $63,770
- Rent vs Own
- Severe rent burden
- 1813.0
Population outlook (Riverside County) Hauer SSP2
- Today (2025)
- 2,664,475 people
- By 2030
- 2,802,692 · +5.2%
- By 2040
- 3,050,904 · +14.5%
- By 2050
- 3,256,783 · +22.2%
- By 2075
- 3,655,058 · +37.2%
- By 2100
- 3,766,594 · +41.4%
Race, ethnicity, and origin ACS 2023
- Neighborhood character
- Diverse neighborhood (Simpson 0.65)
- Race & ethnicity
- Hispanic / Latino 46% White 35% Two or more races 17% Black 8% Asian 5% Native American 1%
- Hispanic origin (detail)
- Mexican 40%
- Common ancestry
- Slovak 2% Lithuanian 2% Portuguese 1%
- Foreign-born
- 19% · Canada, Vietnam, Jamaica
- Languages at home
- 69% English-only · Spanish 27% Tagalog/Filipino 1% Other Indo-European 1%
Political lean MEDSL · Riverside
- 2024 margin
- Toss-up / Even · D 48.0% · R 49.3% · Other 2.6%
- 2008→2024 swing
- -3.6pp toward R · 2008: 2.3pp · 2024: -1.3pp
- All cycles
- 2024: R+1.3 2020: D+8.0 2016: D+4.3 2012: R+0.4 2008: D+2.3
Not yet ingested
- Civics
- —
Market trends
- HPI YoY
- ▼ -116.25%
- Current HPI
- 356.9414
- Rent YoY
- ▲ 3.74%
- Metro
- Riverside-San Bernardino-Ontario, CA
- State GDP YoY
- ▲ 3.21%
- F500 in state
- 116
Industry mix (Fortune 500 HQ in CA)
| Industry | F500 HQs | Revenue |
|---|---|---|
| Technology | 27 | $1,492B |
|
||
| Financial Services | 3 | $174B |
|
||
| Retail | 3 | $44B |
|
||
| Insurance | 3 | $26B |
|
||
| Media / Entertainment | 2 | $115B |
|
||
| Pharmaceuticals / Biotech | 2 | $62B |
|
||
Price history
1 event — show timeline
- 2025-10-22 Listed $80,000 CRMLS
Cash-flow waterfall
monthlySold comps — $/sqft
last 12 mo · ≤1 miLoading sold comps…