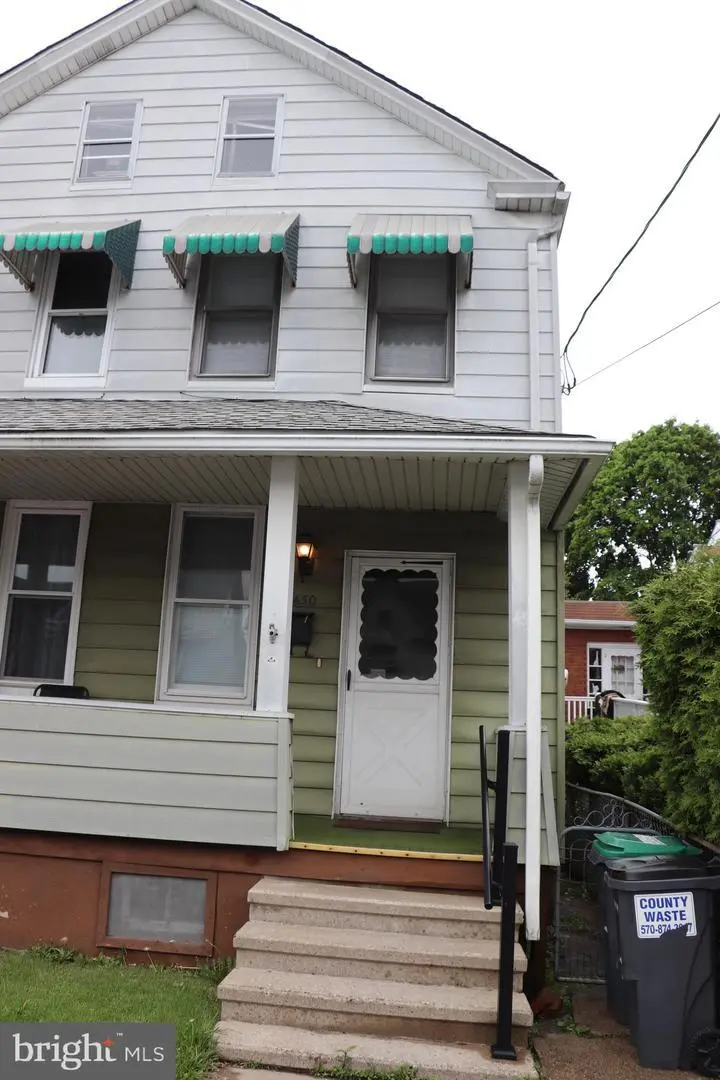
430 Washington St · Freeland, PA
Flood risk 1/10 · Minimal
- FEMA flood zone
- X (unshaded)
- Chance of flooding over 30 yrs
- 0.0%
- Est. flood insurance / yr
- $507 – $1,088
Fire risk 3/10 · Minor
- Est. fire insurance / yr
- $511 – $949
Heat risk 3/10 · Minor
- Hot days now (above 90°F)
- 7 days/yr
- Hot days in 30 yrs
- 17 days/yr
Wind risk 4/10 · Minor
- Chance of severe wind over 30 yrs
- 8.0%
Air-quality risk 2/10 · Minimal
- Unhealthy air days now
- 1 days/yr
- Unhealthy air days in 30 yrs
- 2 days/yr
Risk factors via First Street. Map © Google.
Why this score? — see what drove the B+ grade
The composite is a weighted blend of 9 inputs, each scored 0–100. Each bar is that input's sub-score; the figure is the points it added to the 100-point composite (weight × sub-score).
- Cash flow +26.1/30.0
- ARV discount +15.0/15.0
- Appreciation +10.0/10.0
- DSCR +8.8/10.0
- 1% rule +6.2/10.0
- Livability +3.1/5.0
- Rent growth +2.5/5.0
- Condition / age +2.5/5.0
- Schools +2.0/10.0
$130,000
🖨 Deal sheet (PDF) 📄 Offer letter ✓ Due diligence
Listing remarks MLS
Well kept 3 bedroom half double in great Freeland neighborhood. Enjoy the sunny living room, parlor, eat-in kitchen, small yard and off street parking space. Bonus: full basement & attic for your storage needs. Conveniently located within walking distance to shopping, dining & local entertainment. Wonderful opportunity for first-time buyers, downsizers or investors. Come & See -I've got the key!
Key facts
- Sunny living room
- Full basement
- Eat-in kitchen
Tags
Property features AI
Finance
- Other: Fee simple ownership; Property condition listed as good; Not in a federal flood zone; Pets allowed with no restrictions; Ground rent paid annually
Exterior
- Parking: Paved parking; On-street parking available; One off-street parking space (one total garage/parking space listed)
- Utilities: Public water; Public sewer
- Home design: Detached property; Estimated year built
- Construction: Foundation: Other; Roof: Unknown; Other structures above and below grade; Building not winterized
- Exterior features: Chain link fencing; Cleared lot with rear yard; Lot dimensions approximately 130 x 25
Interior
- Kitchen: Stove
- Bedrooms: Three bedrooms on the upper level
- Bathrooms: One full bathroom
- Heating & cooling: Electric heating (other type listed); Window air conditioning units (electric)
- Interior features: 7 total rooms; Living room and sitting room; Basement with interior access and connecting stairway; Not furnished
- Laundry & utility: Washer and dryer on the main floor
Neighborhood map
What this means for you Summary
Snapshot
- This is a 3-bed/1.0-bath single-family listed at $130k.
Deal economics
- At list price, monthly cash flow is $328 ($4k/yr) — positive.
- The deal already cash-flows at list — no discount required.
- Meets the 1% rule at list price ($1k rent vs $130k).
- Cap rate 9.3% vs local median 6.3% in Freeland — top-decile yield for the area; either an underpriced asset or a hidden risk that comps aren't pricing in. Stress-test before assuming the spread holds.
Location & tenants
- Location reads 61/100 on livability (#1,409 in PA) — a middle-class / working-renter tenant base. Strengths: cost of living A+, crime A, housing A-; Watch: amenities F, commute F, employment F.
- Hazleton Area SD (suburban): math 18% / reading 30% proficiency, ranked #476 of 539 in PA (top 88%) — low school quality limits family demand, transient renter base, plan for 1-2y turnover.
- Zoned schools: West Hazleton El/Ms (math 2% / reading 22%, grade F, #1,362 of 1,518 statewide, top 92%, 949 students, 100% FRL); Hazleton El/Ms (math 2% / reading 19%, grade F, #494 of 512 statewide, top 96%, 879 students, 100% FRL); Hazleton Area Hs (math 53% / reading 8%, grade F, #347 of 437 statewide, top 79%, 3,795 students, 83% FRL) — zoned schools average 94% FRL vs 60% district-wide (35 pts higher); higher-poverty schools than district average — tighter screening recommended.
- Market conditions: 43 active listings in the ZIP; 1 comparable units currently listed for rent nearby; 349 units permitted in Luzerne County in 2024 (16 in 5+ unit buildings).
Forward outlook
- In year one you build about $14k of equity ($899 loan paydown + $13k appreciation (10.0% local appreciation)).
- Luzerne County population projected at +4% by 2050 — modest demand growth; plan on rents tracking national, not racing it.
- At projected returns (10.0% appreciation + 3.0% rent growth), your $36k cash investment doubles in ~2 years — after that, you're playing with house money.
- By year 3, paydown + projected appreciation supports a ~$35k cash-out refi (75% LTV) — recoverable capital for the next deal without selling this one.
Negotiation context
- Only 14 days on market — expect competitive offers; lowballing is unlikely to land.
- 2 sale attempts with the ask held roughly flat each time — persistent listings suggest the price (not the market) is what's stuck; bring a comps-based counter.
Risks & watch-outs
- Watch-outs: built in 1940 — expect roof / HVAC / electrical / plumbing capex.
Questions for the listing agent
- Built in 1940 — when were the roof, HVAC, electrical panel, plumbing, and water heater last replaced?
- Is there a deadline driving the sale (1031 exchange, divorce, estate, relocation)? That informs how much negotiation room exists.
- Schools are F-rated, which usually means shorter tenancies and higher turnover. Who's the typical renter profile here, and what's been the actual vacancy rate?
- What's the average days-on-market for RENTAL listings here right now (not sales)? A rising rental-DOM trend means longer vacancies and softer asking-rent achievability than the comps imply.
- What's the recent tenant-quality profile in this submarket — average credit score on applications, eviction rate, late-payment / NSF rate, and stable-employment percentage? A property-management company in the area should have these aggregated.
- How much new for-sale + rental construction is in the pipeline within 1–3 miles? Heavy new supply typically softens prices + rents 12–24 months out; constrained supply supports both.
Investment metrics
- 1% rule
- 1.12% ✓
- Cap rate
- 9.32%
- Cash-on-cash
- 10.80%
- DSCR
- 1.48
- GRM
- 7.5
CMA / ARV
- ARV (on-the-fly)
- $180,810
- Comps found
- 12
Show comp detail 12 sales within ~0.75 mi
| Address | Dist | Beds/Ba | Sqft | Sold | Price | $/sf | Match |
|---|---|---|---|---|---|---|---|
| 635 Vine St | 0.28mi | 3/1.5 | 1,438 (-2%) | 3mo | $145,000 | $101 | 79 |
| 505 Cedar St | 0.29mi | 3/1.5 | 1,504 (+2%) | 6mo | $212,500 | $141 | 76 |
| 957 Chestnut St | 0.40mi | 2/1.0 (-1) | 1,489 (+1%) | 0mo | $73,825 | $50 | 74 |
| 432 Park St | 0.13mi | 4/1.0 (+1) | 1,328 (-10%) | 8mo | $200,000 | $151 | 66 |
| 909 Birkbeck St | 0.36mi | 3/1.0 | 1,320 (-10%) | 0mo | $110,000 | $83 | 66 |
| 315 Alvin St | 0.52mi | 4/1.0 (+1) | 1,498 (+2%) | 5mo | $130,000 | $87 | 64 |
| 169 Alvin St | 0.54mi | 3/1.0 | 1,392 (-5%) | 5mo | $189,900 | $136 | 62 |
| 546 Johnson St | 0.29mi | 4/2.0 (+1) | 1,550 (+5%) | 9mo | $215,000 | $139 | 61 |
| 710 Walnut St St | 0.24mi | 3/1.0 | 1,260 (-14%) | 8mo | $105,000 | $83 | 59 |
| 942 Burton St | 0.34mi | 3/1.0 | 1,260 (-14%) | 3mo | $75,000 | $60 | 57 |
| 437 Alvin St | 0.53mi | 4/1.5 (+1) | 1,558 (+6%) | 1mo | $191,000 | $123 | 57 |
| 1130 Centre St | 0.55mi | 3/1.5 | 1,680 (+14%) | 6mo | $294,900 | $176 | 44 |
Match score weights: distance 35% · size 25% · config 20% · recency 20%. Top-matched comps best support the ARV.
Projected returns pro-forma
10.0% appreciation · 3.0% rent growth · sell at horizon
- IRR
- 32.2%
- Equity multiple
- 3.52×
- Total profit
- $91,643
- Equity at exit
- $117,114
- IRR
- 27.8%
- Equity multiple
- 7.96×
- Total profit
- $253,407
- Equity at exit
- $252,561
Cash invested: $36,400 (down + closing). Projections, not guarantees.
Landlord ↔ Tenant lean methodology
- Overall (STATE)
- 62 Landlord-Friendly
- State Pennsylvania
- 62 Landlord-Friendly · EVEN
- County
- — inherits STATE
- City
- — inherits STATE
ZIP-level market 18224
- Home prices YoY
- 9.2%
- Active inventory
- 43
- Price-to-rent
- 7.5×
Monthly cashflow live
- Estimated rent
- $1,450 medium interval (Pro) →
- Mortgage (P&I)
- −$682
- Tax from tax record
- −$82 /mo · $983/yr
- Insurance
- −$54
- HOA
- −$0
- Vacancy / Maint / Mgmt
- −$304
- Net cashflow
- $328
Break-even live
Sensitivity live
| Price | -10% $401 | -5% $364 | +0% $328 | +5% $291 | +10% $254 |
|---|---|---|---|---|---|
| Rent | -10% $213 | -5% $270 | +0% $328 | +5% $385 | +10% $442 |
| Rate | -1.0pp $393 | -0.5pp $361 | base $328 | +0.5pp $294 | +1.0pp $260 |
UW: 25.0% down · 7.5% · 30yr · 1.5% tax · 5.0% vac · 8.0% maint · 8.0% mgmt
Financing live
Cash to close
- Down payment
- $32,500
- Closing costs
- $3,900
- Reserves months
- —
- Total cash needed
- —
Loan-product check · same deal, 3 products live
Conventional
25% down · 7.5% · 30yr
- Down + closing
- —
- Monthly P&I
- —
- Monthly cashflow
- —
- DSCR
- —
- Eligible?
- —
Personal DTI + credit; lowest rate.
DSCR
20% down · 8.5% · 30yr
- Down + closing
- —
- Monthly P&I
- —
- Monthly cashflow
- —
- DSCR
- —
- Eligible?
- —
No personal income docs; deal must DSCR.
Hard money
10% down · 12.0% · 12mo
- Down + closing
- —
- Monthly P&I
- —
- Monthly cashflow
- —
- DSCR
- —
- Eligible?
- —
Short-term bridge; refi at stabilization.
Rent comps 1 comps
| Address | Beds | Baths | Sqft | Rent | $/sqft | DOM | Units | Dist |
|---|---|---|---|---|---|---|---|---|
| 109 Terrace Rd Freeland, PA | 3.0 | 1.0 | 1150 | $1,450 | $1.26 | 22d | 1 | 0.56mi |
Listing history 11 events
-
2026-06-19days on market $130,000 Active 14 DOM
-
2026-06-18days on market $130,000 Active 13 DOM
-
2026-06-17days on market $130,000 Active 12 DOM
-
2026-06-16days on market $130,000 Active 11 DOM
-
2026-06-15days on market $130,000 Active 10 DOM
-
2026-06-14days on market $130,000 Active 8 DOM
-
2026-06-12days on market $130,000 Active 7 DOM
-
2026-06-09days on market $130,000 Active 4 DOM
-
2026-06-08days on market $130,000 Active 3 DOM
-
2026-06-07remarks 404-char remark
-
2026-06-07$130,000 Active 2 DOM
ⓘ Source: listings_history table (triggers on properties + properties_extension) + one-shot
backfill from property_details.listing_events for pre-trigger history.
Tax reassessment forecast PA · Partial reset (capped growth)
- Current annual tax
- $983 · $82/mo
- Projected year-2 tax
- $1,519 · $127/mo
- Expected delta
- +$535/yr (+$45/mo · 54.4%)
ⓘ Screening estimate from a state-policy table — verify with the county assessor before closing.
Climate risk First Street
- Flood 1/10 Low FEMA zone X (unshaded) · 0% chance over 30 yrs
- Wildfire 3/10 Moderate
- Heat 3/10 Moderate 7 d/yr ≥90°F today · 17 d/yr by 30 yrs out
- Wind 4/10 Moderate 8% chance of damaging wind over 30 yrs
- Air quality 2/10 Low 1 unhealthy d/yr today · 2 by 30 yrs out
Nearby sold comps map
Loading sold comps map…
Walkable amenities ~0.75 mi
Loading nearby amenities…
Taxation est. · year 1
- Rental income
- $17,400
- − Mortgage interest
- −$7,282
- − Property taxes
- −$983
- − Insurance
- −$650
- − Repairs & maintenance
- −$1,392
- − Management
- −$1,392
- − Depreciation
- −$3,782
- Taxable income
- $1,919
- Est. tax owed @ 24.0%
- −$461
- After-tax cash flow
- $3,471/yr
For passive investors: Depreciation is non-cash, so a rental often shows a tax loss while cash-flowing — sheltering income. Rental losses are passive: they offset passive income freely, and up to $25,000/yr can offset ordinary (W-2) income if you actively participate and your MAGI is under $100k (phasing out to $0 by $150k); unused losses carry forward. On sale, claimed depreciation is recaptured at up to 25%, and gains may owe capital-gains tax (a 1031 exchange can defer both). Figures are a year-1 estimate at your 24.0% rate — not tax advice; consult a CPA.
Schools (NCES district)
- District
- Hazleton Area SD
- NCES district ID
- 4211700
- Math proficiency
- 18% ▼ -3.00%
- Reading proficiency
- 30% ▼ -15.00%
- Median HH income
- $42,247
- Composite
- 20.44/100
- National rank
- #8582
- State rank
- #476 of 539 in PA
Livability — Freeland
- Score
- 61/100
- State rank
- #1409
- US rank
- #17813
Category grades
Schools grade is shown separately in the Schools card above.
Census & demographics
- Census place
- Freeland, PA
- City population
- 5,954
- Population (ZIP)
- 5,954
Population outlook (Luzerne County) Hauer SSP2
- Today (2025)
- 319,505 people
- By 2030
- 319,943 · +0.1%
- By 2040
- 322,643 · +1.0%
- By 2050
- 330,817 · +3.5%
- By 2075
- 379,145 · +18.7%
- By 2100
- 431,908 · +35.2%
Race, ethnicity, and origin ACS 2023
- Neighborhood character
- Predominantly White (85%)
- Race & ethnicity
- White 85% Hispanic / Latino 12% Two or more races 6%
- Hispanic origin (detail)
- Puerto Rican 8% Dominican 3%
- Common ancestry
- Romanian 13% Scotch-Irish 4% Iranian 2%
- Foreign-born
- 3% · Canada
- Languages at home
- 87% English-only · Spanish 10% Russian/Polish/Slavic 1%
Political lean MEDSL · Luzerne
- 2024 margin
- R (+19.2) · D 40.0% · R 59.2%
- 2008→2024 swing
- -27.6pp toward R · 2008: 8.4pp · 2024: -19.2pp
- All cycles
- 2024: R+19.2 2020: R+14.4 2016: R+19.6 2012: D+4.8 2008: D+8.4
Not yet ingested
- Civics
- —
Market trends
- HPI YoY
- ▲ 22.89%
- Current HPI
- 270.8055
- Rent YoY
- —
- Metro
- —
- State GDP YoY
- ▲ 1.68%
- F500 in state
- 34
Industry mix (Fortune 500 HQ in PA)
| Industry | F500 HQs | Revenue |
|---|---|---|
| Healthcare | 2 | $309B |
|
||
| Insurance | 2 | $27B |
|
||
| Telecommunications / Media | 1 | $124B |
|
||
| Industrial Distribution | 1 | $22B |
|
||
| Financial Services | 1 | $20B |
|
||
| Chemicals / Materials | 1 | $18B |
|
||
Price history
+0.0% since first listed2 events — show timeline
- 2026-06-05 Listed $130,000 BRIGHT MLS
- 2026-06-01 Listed $130,000 LCAR
Property tax history
+2.9%/yrLatest (2026): $983 · +3.8% YoY. Source: county tax records.
Cash-flow waterfall
monthlySold comps — $/sqft
last 12 mo · ≤1 miLoading sold comps…