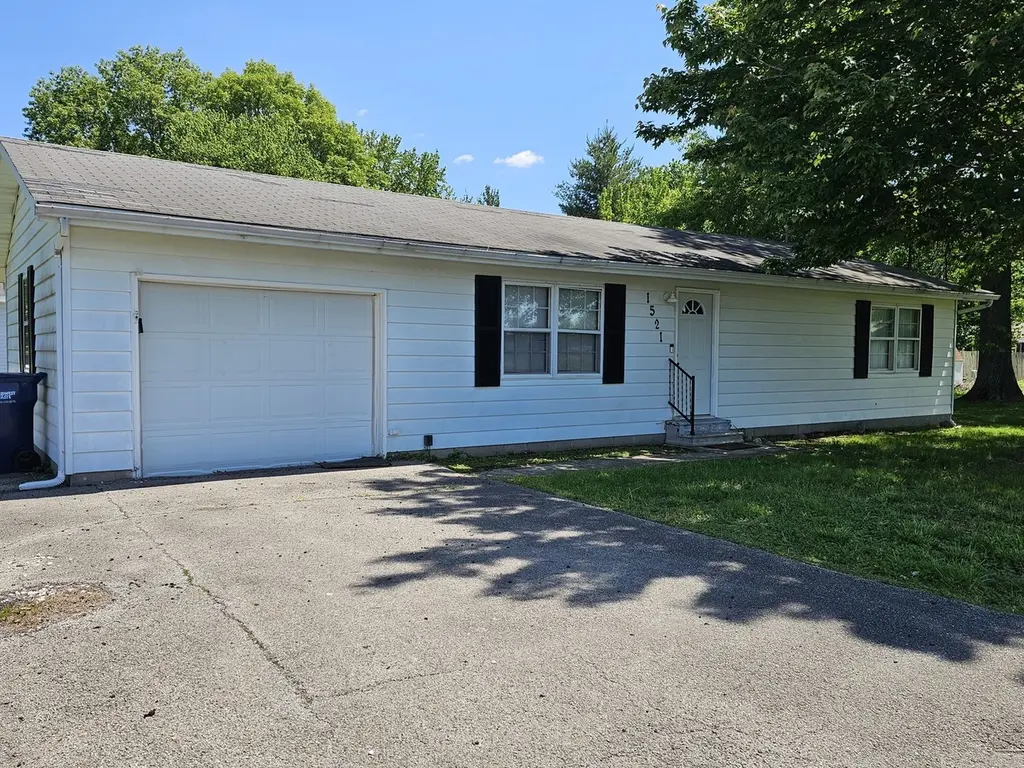
1521 Triangle St · Mount Vernon, IL
Flood risk 1/10 · Minimal
- FEMA flood zone
- X (unshaded)
- Chance of flooding over 30 yrs
- 0.0%
- Est. flood insurance / yr
- $473 – $860
Fire risk 1/10 · Minimal
- Est. fire insurance / yr
- $804 – $1,492
Heat risk 4/10 · Minor
- Hot days now (above 106°F)
- 7 days/yr
- Hot days in 30 yrs
- 20 days/yr
Wind risk 2/10 · Minimal
- Chance of severe wind over 30 yrs
- 3.0%
Air-quality risk 2/10 · Minimal
- Unhealthy air days now
- 0 days/yr
- Unhealthy air days in 30 yrs
- 1 days/yr
Risk factors via First Street. Map © Google.
Why this score? — see what drove the C+ grade
The composite is a weighted blend of 9 inputs, each scored 0–100. Each bar is that input's sub-score; the figure is the points it added to the 100-point composite (weight × sub-score).
- Cash flow +27.3/30.0
- DSCR +9.5/10.0
- ARV discount +7.5/15.0
- 1% rule +7.4/10.0
- Livability +3.5/5.0
- Rent growth +2.5/5.0
- Condition / age +2.2/5.0
- Schools +1.2/10.0
- Appreciation +0.0/10.0
$105,500
🖨 Deal sheet (PDF) 📄 Offer letter ✓ Due diligence
Listing remarks MLS
Nice 2 bedroom home with spacious living room & kitchen, large yard & storage shed. Conveniently located & close to town. Owned by the US Department of HUD. Seller makes no representations or warrants as to the condition of property. Seller may contribute up to 3% of buyers closing costs upon buyers request. Sold AS IS. Equal Housing Opportunity. Case #132-3555941 Insurability Status UI Bids may only be submitted by HUD registered agents/agencies on www.hudhomestore.gov.
Key facts
- Inviting kitchen
- Large vanity
- Updated flooring
Tags
Property features AI
Finance
- Other: Possession negotiable
- HOA & community: No master association fee required
Exterior
- Parking: Attached garage with one garage space, concrete driveway, and garage door opener
- Utilities: Public water; Public sewer
- Home design: Detached single-family home; One-story; Fee simple ownership; Built approximately 41–50 years ago
- Construction: Aluminum siding; Asphalt roof; Block and concrete perimeter foundation
- Exterior features: Patio; Corner, level lot; Lot dimensions approximately 190 x 70 x 190 x 70
Interior
- Kitchen: Main-level kitchen (11 x 9) with laminate flooring
- Bedrooms: Main-level master bedroom (9 x 16) with laminate flooring; Main-level second bedroom (9 x 15) with laminate flooring
- Flooring: Laminate flooring throughout primary rooms
- Bathrooms: One full bathroom
- Heating & cooling: Electric forced-air heating; Central air conditioning
- Interior features: Five total rooms; School bus service available
- Laundry & utility: Main-level laundry room (6 x 9) with laminate flooring
Neighborhood map
What this means for you Summary
Snapshot
- This is a 2-bed/1.0-bath single-family listed at $106k. Condition is rated fair.
Deal economics
- At list price, monthly cash flow is $306 ($4k/yr) — positive.
- The deal already cash-flows at list — no discount required.
- Meets the 1% rule at list price ($1k rent vs $106k).
- Recommended offer: $102k (3.0% below list) — sets the bar for market timing.
- Cap rate 9.8% vs local median 5.2% in Mount Vernon — top-decile yield for the area; either an underpriced asset or a hidden risk that comps aren't pricing in. Stress-test before assuming the spread holds.
Location & tenants
- Location reads 69/100 on livability (#413 in IL) — a middle-class / working-renter tenant base. Strengths: cost of living A+, housing A+, health & safety A+; Watch: schools F, amenities F, commute F.
- Mt Vernon Twp Hsd 201 (town): math 13% / reading 16% proficiency, ranked #532 of 620 in IL (top 86%) — low school quality limits family demand, transient renter base, plan for 1-2y turnover.
- Market conditions: 191 active listings in the ZIP; 1 comparable units currently listed for rent nearby; 6 units permitted in Jefferson County in 2024 (0 in 5+ unit buildings).
Forward outlook
- Local home prices are declining (-3.0%/yr); year-one equity from $729 of loan paydown is wiped out by about $3k of value loss. Plan a longer hold.
- Jefferson County population projected at -14% by 2050 — secular population decline; favor cash flow + early exit over multi-decade hold.
- At projected returns (-3.0% appreciation + 3.0% rent growth), your $30k cash investment doubles in ~10 years — after that, you're playing with house money.
Negotiation context
- It's been on market 47 days — a 3% lower offer ($102k) is reasonable based on typical stale-listing flexibility.
- 2 sale attempts since 7y ago; this cycle's ask is 91% above the opening price — seller raised mid-cycle; expect resistance to lowballs.
- Current owner paid $42k; list at $106k implies a 151% gain — meaningful room to come down on a strong offer.
Questions for the listing agent
- It's been on market 47 days. Have you received any prior offers? Is the seller open to a 3% concession, seller financing, or rate buy-down credit?
- Have any recent inspections been done? Can we get a copy of the seller's disclosures and any deferred-maintenance estimates?
- Is there a deadline driving the sale (1031 exchange, divorce, estate, relocation)? That informs how much negotiation room exists.
- Schools are F-rated, which usually means shorter tenancies and higher turnover. Who's the typical renter profile here, and what's been the actual vacancy rate?
- What's the average days-on-market for RENTAL listings here right now (not sales)? A rising rental-DOM trend means longer vacancies and softer asking-rent achievability than the comps imply.
- What's the recent tenant-quality profile in this submarket — average credit score on applications, eviction rate, late-payment / NSF rate, and stable-employment percentage? A property-management company in the area should have these aggregated.
- How much new for-sale + rental construction is in the pipeline within 1–3 miles? Heavy new supply typically softens prices + rents 12–24 months out; constrained supply supports both.
Investment metrics
- 1% rule
- 1.24% ✓
- Cap rate
- 9.77%
- Cash-on-cash
- 12.42%
- DSCR
- 1.55
- GRM
- 6.7
CMA / ARV
- ARV (on-the-fly)
- $57,024
- Comps found
- 11
Show comp detail 11 sales within ~0.75 mi
| Address | Dist | Beds/Ba | Sqft | Sold | Price | $/sf | Match |
|---|---|---|---|---|---|---|---|
| 1511 Triangle St | 0.07mi | 2/1.0 | 1,008 (-4%) | 7mo | $17,100 | $17 | 84 |
| 1505 Triangle St | 0.11mi | 3/1.0 (+1) | 1,040 (-2%) | 19mo | $80,000 | $77 | 71 |
| 1505 Triangle St | 0.11mi | 3/1.0 (+1) | 1,040 (-2%) | 19mo | $80,000 | $77 | 71 |
| 1509 Triangle St | 0.08mi | 3/1.5 (+1) | 1,064 (+1%) | 22mo | $120,000 | $113 | 70 |
| 2001 Brownsville Rd | 0.27mi | 3/1.0 (+1) | 992 (-6%) | 16mo | $55,000 | $55 | 59 |
| 820 S 20th St | 0.74mi | 3/1.0 (+1) | 1,086 (+3%) | 3mo | $2,900 | $3 | 53 |
| 2021 S Brownsville Rd | 0.29mi | 3/1.0 (+1) | 1,172 (+11%) | 14mo | $95,400 | $81 | 51 |
| 1209 S 26th St | 0.67mi | 3/1.0 (+1) | 1,088 (+3%) | 19mo | $59,000 | $54 | 42 |
| 905 S 23rd St | 0.75mi | 2/1.0 | 1,000 (-5%) | 19mo | $7,000 | $7 | 40 |
| 1024 Wescott St | 0.54mi | 2/1.0 | 920 (-13%) | 23mo | $37,250 | $40 | 34 |
| 1024 Wescott St | 0.57mi | 2/1.0 | 920 (-13%) | 23mo | $37,250 | $40 | 33 |
Match score weights: distance 35% · size 25% · config 20% · recency 20%. Top-matched comps best support the ARV.
Projected returns pro-forma
-3.0% appreciation · 3.0% rent growth · sell at horizon
- IRR
- 2.1%
- Equity multiple
- 1.08×
- Total profit
- $2,402
- Equity at exit
- $15,730
- IRR
- 11.7%
- Equity multiple
- 1.92×
- Total profit
- $27,252
- Equity at exit
- $9,122
Cash invested: $29,540 (down + closing). Projections, not guarantees.
Landlord ↔ Tenant lean methodology
- Overall (STATE)
- 43 Moderately Tenant-Leaning
- State Illinois
- 43 Moderately Tenant-Leaning · D+7
- County
- — inherits STATE
- City
- — inherits STATE
ZIP-level market 62864
- Active inventory
- 191
- Price-to-rent
- 6.7×
Monthly cashflow live
- Estimated rent
- $1,310 medium interval (Pro) →
- Mortgage (P&I)
- −$553
- Tax est. 1.5%
- −$132 /mo · $1,582/yr
- Insurance
- −$44
- HOA
- −$0
- Vacancy / Maint / Mgmt
- −$275
- Net cashflow
- $306
Break-even live
Sensitivity live
| Price | -10% $379 | -5% $342 | +0% $306 | +5% $269 | +10% $233 |
|---|---|---|---|---|---|
| Rent | -10% $202 | -5% $254 | +0% $306 | +5% $358 | +10% $409 |
| Rate | -1.0pp $359 | -0.5pp $333 | base $306 | +0.5pp $278 | +1.0pp $251 |
UW: 25.0% down · 7.5% · 30yr · 1.5% tax · 5.0% vac · 8.0% maint · 8.0% mgmt
Financing live
Cash to close
- Down payment
- $26,375
- Closing costs
- $3,165
- Reserves months
- —
- Total cash needed
- —
Loan-product check · same deal, 3 products live
Conventional
25% down · 7.5% · 30yr
- Down + closing
- —
- Monthly P&I
- —
- Monthly cashflow
- —
- DSCR
- —
- Eligible?
- —
Personal DTI + credit; lowest rate.
DSCR
20% down · 8.5% · 30yr
- Down + closing
- —
- Monthly P&I
- —
- Monthly cashflow
- —
- DSCR
- —
- Eligible?
- —
No personal income docs; deal must DSCR.
Hard money
10% down · 12.0% · 12mo
- Down + closing
- —
- Monthly P&I
- —
- Monthly cashflow
- —
- DSCR
- —
- Eligible?
- —
Short-term bridge; refi at stabilization.
Rent comps 1 comps
| Address | Beds | Baths | Sqft | Rent | $/sqft | DOM | Units | Dist |
|---|---|---|---|---|---|---|---|---|
| 1407 S 34th St Mt Vernon, IL | 1.0–2.0 | 1.0–2.0 | 806 | $1,310 | $1.63 | 44d | 7 | 1.25mi |
Listing history 21 events
-
2026-06-21days on market $105,500 Active 47 DOM
-
2026-06-18days on market $105,500 Active 45 DOM
-
2026-06-17days on market $105,500 Active 44 DOM
-
2026-06-16days on market $105,500 Active 43 DOM
-
2026-06-15days on market $105,500 Active 42 DOM
-
2026-06-13days on market $105,500 Active 40 DOM
-
2026-06-12days on market $105,500 Active 39 DOM
-
2026-06-09days on market $105,500 Active 36 DOM
-
2026-06-08days on market $105,500 Active 35 DOM
-
2026-06-07days on market $105,500 Active 34 DOM
-
2026-06-07days on market $105,500 Active 33 DOM
-
2026-06-04days on market $105,500 Active 30 DOM
-
2026-06-02days on market $105,500 Active 29 DOM
-
2026-06-01days on market $105,500 Active 28 DOM
-
2026-05-31days on market $105,500 Active 27 DOM
-
2026-05-31days on market $105,500 Active 26 DOM
-
2026-05-21historical Contingent - Continue to Show
-
2023-10-10soldstatus $42,000 487-char remark
Show marketing remark (487 chars)
Nice 2 bedroom home with spacious living room & kitchen, large yard & storage shed. Conveniently located & close to town. Owned by the US Department of HUD. Seller makes no representations or warrants as to the condition of property. Seller may contribute up to 3% of buyers closing costs upon buyers request. Sold AS IS. Equal Housing Opportunity. Case #132-3555941 Insurability Status UI Bids may only be submitted by HUD registered agents/agencies on www.hudhomestore.gov.
-
2023-02-23$55,100 487-char remark
Show marketing remark (487 chars)
Nice 2 bedroom home with spacious living room & kitchen, large yard & storage shed. Conveniently located & close to town. Owned by the US Department of HUD. Seller makes no representations or warrants as to the condition of property. Seller may contribute up to 3% of buyers closing costs upon buyers request. Sold AS IS. Equal Housing Opportunity. Case #132-3555941 Insurability Status UI Bids may only be submitted by HUD registered agents/agencies on www.hudhomestore.gov.
-
2019-12-09soldstatus $65,000 741-char remark
Show marketing remark (741 chars)
Situated between Triangle and Sunset Street just off Waltonville Road you'll find this two bedroom gem is waiting for you! Although it's conveniently located minutes from town, the yard and neighborhood gives you an out of town feel. As you can see, the current owner has taken time to do the hard work for you-the HVAC system has been recently service, there is new paint and laminate flooring throughout AND-The seller is willing to provide a Home Warranty with an acceptable offer. But wait, there's more! For an additional cost a new metal roof may be installed. Color choice is yours (copper excluded). Don't get bent out of shape looking for homes--you'll find what you're looking for at 1521 Triangle Street. Washer, Dryer, Dishwasher
-
2019-04-17$68,900 741-char remark
Show marketing remark (741 chars)
Situated between Triangle and Sunset Street just off Waltonville Road you'll find this two bedroom gem is waiting for you! Although it's conveniently located minutes from town, the yard and neighborhood gives you an out of town feel. As you can see, the current owner has taken time to do the hard work for you-the HVAC system has been recently service, there is new paint and laminate flooring throughout AND-The seller is willing to provide a Home Warranty with an acceptable offer. But wait, there's more! For an additional cost a new metal roof may be installed. Color choice is yours (copper excluded). Don't get bent out of shape looking for homes--you'll find what you're looking for at 1521 Triangle Street. Washer, Dryer, Dishwasher
ⓘ Source: listings_history table (triggers on properties + properties_extension) + one-shot
backfill from property_details.listing_events for pre-trigger history.
Climate risk First Street
- Flood 1/10 Low FEMA zone X (unshaded) · 0% chance over 30 yrs
- Wildfire 1/10 Low
- Heat 4/10 Moderate 7 d/yr ≥106°F today · 20 d/yr by 30 yrs out
- Wind 2/10 Low 3% chance of damaging wind over 30 yrs
- Air quality 2/10 Low 0 unhealthy d/yr today · 1 by 30 yrs out
Nearby sold comps map
Loading sold comps map…
Walkable amenities ~0.75 mi
Loading nearby amenities…
Taxation est. · year 1
- Rental income
- $15,720
- − Mortgage interest
- −$5,910
- − Property taxes
- −$1,582
- − Insurance
- −$528
- − Repairs & maintenance
- −$1,258
- − Management
- −$1,258
- − Depreciation
- −$3,069
- Taxable income
- $2,116
- Est. tax owed @ 24.0%
- −$508
- After-tax cash flow
- $3,162/yr
For passive investors: Depreciation is non-cash, so a rental often shows a tax loss while cash-flowing — sheltering income. Rental losses are passive: they offset passive income freely, and up to $25,000/yr can offset ordinary (W-2) income if you actively participate and your MAGI is under $100k (phasing out to $0 by $150k); unused losses carry forward. On sale, claimed depreciation is recaptured at up to 25%, and gains may owe capital-gains tax (a 1031 exchange can defer both). Figures are a year-1 estimate at your 24.0% rate — not tax advice; consult a CPA.
Condition & rehab AI · 12 photos
This ranch-style home requires moderate updates to its kitchen, exterior, and landscaping to improve its curb appeal and overall value.
Repairs flagged
- Moderate Kitchen cabinets — Worn and dated appearance.
- Minor Bathroom vanity — Functional but dated design.
- Moderate Exterior siding — Weathered appearance.
- Minor Paint — Faded in some areas.
- Minor Windows — Old appearance but functional.
- Minor Landscaping — Simple and needs attention.
Value-add opportunities
- Both Painting and updating kitchen cabinets — Improves curb appeal and interior aesthetics.
- Both Replacing dated kitchen appliances — Enhances functionality and appeal.
- Both Updating bathroom vanity — Improves functionality and aesthetics.
- Both Landscaping improvements — Enhances curb appeal and overall property value.
- Both Window replacements — Improves energy efficiency and aesthetics.
Renovation cost estimate screening
| Repair item | Severity | Est. cost |
|---|---|---|
| Kitchen cabinets · Worn and dated appearance. | Moderate | $3,000–15,000 |
| Bathroom vanity · Functional but dated design. | Minor | $500–3,000 |
| Exterior siding · Weathered appearance. | Moderate | $3,000–15,000 |
| Paint · Faded in some areas. | Minor | $500–3,000 |
| Windows · Old appearance but functional. | Minor | $500–3,000 |
| Landscaping · Simple and needs attention. | Minor | $500–3,000 |
| Total estimated repair cost · 6 items | $8,000–42,000 |
Value-add ROI direction
- Both Painting and updating kitchen cabinets — Improves curb appeal and interior aesthetics. ↑
- Both Replacing dated kitchen appliances — Enhances functionality and appeal. ↑
- Both Updating bathroom vanity — Improves functionality and aesthetics. ↑
- Both Landscaping improvements — Enhances curb appeal and overall property value. ↑
- Both Window replacements — Improves energy efficiency and aesthetics. ↑
ⓘ Cost ranges are severity-bucket heuristics (US national rule-of-thumb). Get contractor quotes + a written scope before underwriting a rehab budget.
Schools (NCES district)
- District
- Mt Vernon Twp Hsd 201
- NCES district ID
- 1727360
- Math proficiency
- 13% ▼ -8.00%
- Reading proficiency
- 16% ▼ -8.00%
- Median HH income
- $38,188
- Composite
- 12.22/100
- National rank
- #9648
- State rank
- #532 of 620 in IL
Livability — Mount Vernon
- Score
- 69/100
- State rank
- #413
- US rank
- #8520
Category grades
Schools grade is shown separately in the Schools card above.
Census & demographics
- Census place
- Mount Vernon, IL
- Population (ZIP)
- 23,061
Population outlook (Jefferson County) Hauer SSP2
- Today (2025)
- 36,818 people
- By 2030
- 35,764 · -2.9%
- By 2040
- 33,649 · -8.6%
- By 2050
- 31,557 · -14.3%
- By 2075
- 26,055 · -29.2%
- By 2100
- 19,237 · -47.8%
Race, ethnicity, and origin ACS 2023
- Neighborhood character
- Predominantly White (83%)
- Race & ethnicity
- White 83% Black 8% Two or more races 6% Hispanic / Latino 3% Asian 1%
- Common ancestry
- Romanian 2% Slovak 2% Serbian 2%
- Foreign-born
- 2% · Canada
- Languages at home
- 97% English-only · Spanish 1% Tagalog/Filipino 1%
Political lean MEDSL · Jefferson
- 2024 margin
- Solid R (+47.8) · D 25.5% · R 73.3% · Other 1.3%
- 2008→2024 swing
- -37.0pp toward R · 2008: -10.7pp · 2024: -47.8pp
- All cycles
- 2024: R+47.8 2020: R+45.1 2016: R+43.2 2012: R+22.9 2008: R+10.7
Not yet ingested
- Civics
- —
Market trends
- HPI YoY
- ▼ -83.64%
- Current HPI
- 134.2669
- Rent YoY
- —
- Metro
- —
- State GDP YoY
- ▲ 1.59%
- F500 in state
- 60
Industry mix (Fortune 500 HQ in IL)
| Industry | F500 HQs | Revenue |
|---|---|---|
| Insurance | 4 | $201B |
|
||
| Consumer Goods | 4 | $87B |
|
||
| Industrial Machinery | 3 | $64B |
|
||
| Healthcare | 2 | $55B |
|
||
| Retail / Pharmacy | 1 | $148B |
|
||
| Agriculture / Food | 1 | $86B |
|
||
Price history
-39.0% since first listed5 events — show timeline
- 2026-05-21 Contingent — MRED as Distributed by MLS Grid
- 2023-10-10 Sold (MLS) $42,000 MRED as Distributed by MLS Grid
- 2023-02-23 Listed $55,100 MRED as Distributed by MLS Grid
- 2019-12-09 Sold (MLS) $65,000 MRED as Distributed by MLS Grid
- 2019-04-17 Listed $68,900 MRED as Distributed by MLS Grid
Cash-flow waterfall
monthlySold comps — $/sqft
last 12 mo · ≤1 miLoading sold comps…