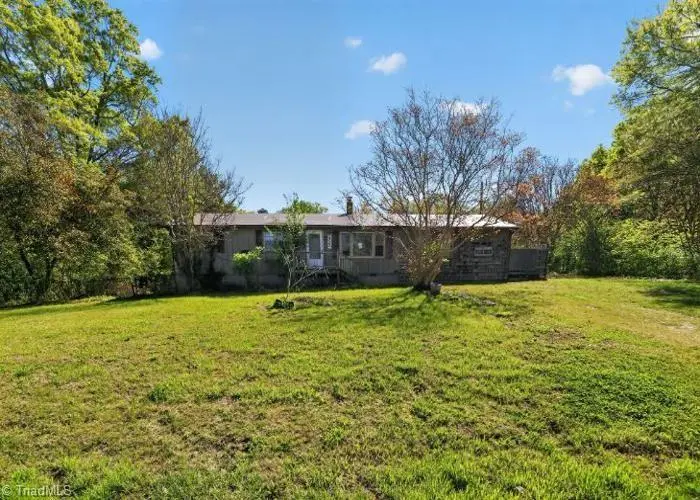
5262 Rosedale St · Trinity, NC
Flood risk 1/10 · Minimal
- FEMA flood zone
- X (unshaded)
- Chance of flooding over 30 yrs
- 0.0%
- Est. flood insurance / yr
- $507 – $1,088
Fire risk 3/10 · Minor
- Est. fire insurance / yr
- $906 – $1,684
Heat risk 5/10 · Moderate
- Hot days now (above 104°F)
- 7 days/yr
- Hot days in 30 yrs
- 17 days/yr
Wind risk 4/10 · Minor
- Chance of severe wind over 30 yrs
- 15.0%
Air-quality risk 2/10 · Minimal
- Unhealthy air days now
- 1 days/yr
- Unhealthy air days in 30 yrs
- 1 days/yr
Risk factors via First Street. Map © Google.
Why this score? — see what drove the B- grade
The composite is a weighted blend of 9 inputs, each scored 0–100. Each bar is that input's sub-score; the figure is the points it added to the 100-point composite (weight × sub-score).
- Cash flow +30.0/30.0
- 1% rule +10.0/10.0
- DSCR +10.0/10.0
- ARV discount +7.5/15.0
- Schools +3.6/10.0
- Livability +3.5/5.0
- Rent growth +2.5/5.0
- Condition / age +2.5/5.0
- Appreciation +0.0/10.0
$61,480
🖨 Deal sheet 📄 Offer letter ✓ Due diligence
Listing remarks
Built in 1964, this one level home offers approximately 1118 finished square feet, two bedrooms and one full bath and sits on an approximate 23087 sqft lot. This home is in need of many repairs. Seller WILL NOT ACTIVATE UTILITIES. Buyer to view home, inspect and confirm all listing information prior to making offer. Seller will NOT allow water service to be turned on for any reason. Property sold “AS-IS” without contingencies. Buyer to check with City/County/Zoning/Tax and other records to determine details to their satisfaction
Key facts
- 0.53 acre lot
- Built 1964
- Listed 36 days
Property features AI
Finance
- Other: Building area reported as 1,118; Directions: From toward Ridge Dr, turn left onto Ridge Dr, turn left onto Rosedale St; destination will be on the right
- HOA & community: No homeowners association; Located in the Gatewood subdivision
Exterior
- Parking: No designated parking
- Utilities: Public water; Septic tank; Water heater: Unknown
- Home design: Residential stick/site-built house; One story; Built in 1964; Existing structure
- Construction: Wood siding construction; Slab foundation
- Exterior features: Public maintained road; Lot approximately 0.53 acre
Interior
- Kitchen: Kitchen on the main level
- Bedrooms: Bedrooms located on the main level
- Bathrooms: One full bathroom
- Heating & cooling: Cooling: Other; Heating: See remarks / No fuel
- Interior features: Primary bedroom located on the main level
Neighborhood map
What this means for you Summary
Snapshot
- This is a 2-bed/1.0-bath single-family listed at $61k.
Deal economics
- At list price, monthly cash flow is $952 ($11k/yr) — positive.
- The deal already cash-flows at list — no discount required.
- Meets the 1% rule at list price ($2k rent vs $61k).
- Recommended offer: $60k (3.0% below list) — sets the bar for market timing.
- Cap rate 24.9% vs local median 3.4% in Trinity — top-decile yield for the area; either an underpriced asset or a hidden risk that comps aren't pricing in. Stress-test before assuming the spread holds.
Location & tenants
- Location reads 69/100 on livability (#161 in NC) — a middle-class / working-renter tenant base. Strengths: cost of living A+, housing A+; Watch: schools D, amenities F, commute F.
- Randolph County School System (rural): math 43% / reading 43% proficiency, ranked #94 of 178 in NC (top 53%) — families likely to look elsewhere, expect single-tenant / working-renter base with shorter leases.
- Market conditions: 117 active listings in the ZIP; 2 comparable units currently listed for rent nearby; 789 units permitted in Randolph County in 2024 (168 in 5+ unit buildings).
Forward outlook
- Local home prices are declining (-3.0%/yr); year-one equity from $425 of loan paydown is wiped out by about $2k of value loss. Plan a longer hold.
- Randolph County population projected to shrink 10% by 2050 — rents likely to lag national; underwrite the cash flow, not the appreciation.
- At projected returns (-3.0% appreciation + 3.0% rent growth), your $17k cash investment doubles in ~2 years — after that, you're playing with house money.
Negotiation context
- It's been on market 36 days — a 3% lower offer ($60k) is reasonable based on typical stale-listing flexibility.
- 2 sale attempts with the ask held roughly flat each time — persistent listings suggest the price (not the market) is what's stuck; bring a comps-based counter.
Risks & watch-outs
- Climate carrying-cost: extreme-heat days projected 7→17/yr by 2055 (HVAC capex compounding) — expect insurance premiums to compound above CPI over the hold.
Questions for the listing agent
- It's been on market 36 days. Have you received any prior offers? Is the seller open to a 3% concession, seller financing, or rate buy-down credit?
- Built in 1964 — when were the roof, HVAC, electrical panel, plumbing, and water heater last replaced?
- Is there a deadline driving the sale (1031 exchange, divorce, estate, relocation)? That informs how much negotiation room exists.
- Schools are D-rated, which usually means shorter tenancies and higher turnover. Who's the typical renter profile here, and what's been the actual vacancy rate?
- What's the average days-on-market for RENTAL listings here right now (not sales)? A rising rental-DOM trend means longer vacancies and softer asking-rent achievability than the comps imply.
- What's the recent tenant-quality profile in this submarket — average credit score on applications, eviction rate, late-payment / NSF rate, and stable-employment percentage? A property-management company in the area should have these aggregated.
- How much new for-sale + rental construction is in the pipeline within 1–3 miles? Heavy new supply typically softens prices + rents 12–24 months out; constrained supply supports both.
Investment metrics
- 1% rule
- 2.86% ✓
- Cap rate
- 24.87%
- Cash-on-cash
- 66.34%
- DSCR
- 3.95
- GRM
- 2.9
CMA / ARV
- ARV (on-the-fly)
- $222,482
- Comps found
- 8
Show comp detail 8 sales within ~0.75 mi
| Address | Dist | Beds/Ba | Sqft | Sold | Price | $/sf | Match |
|---|---|---|---|---|---|---|---|
| 5157 Elmwood St | 0.52mi | 3/1.0 (+1) | 1,080 (-3%) | 2mo | $208,967 | $193 | 63 |
| 5173 Elmwood St | 0.48mi | 3/1.0 (+1) | 1,153 (+3%) | 15mo | $205,000 | $178 | 55 |
| 4888 Trinity Blvd | 0.65mi | 3/1.5 (+1) | 1,062 (-5%) | 3mo | $195,500 | $184 | 52 |
| 12771 Trinity Rd | 0.61mi | 3/1.0 (+1) | 1,180 (+6%) | 14mo | $85,000 | $72 | 46 |
| 5617 Merle Dr | 0.63mi | 3/2.0 (+1) | 1,176 (+5%) | 9mo | $277,000 | $236 | 45 |
| 5609 Mendenhall Road Ext | 0.37mi | 3/2.0 (+1) | 1,000 (-11%) | 19mo | $245,000 | $245 | 40 |
| 5092 Darr Rd | 0.69mi | 3/2.0 (+1) | 1,233 (+10%) | 14mo | $260,000 | $211 | 30 |
| 7517 Nc Highway 62 | 0.74mi | 3/2.0 (+1) | 1,258 (+12%) | 10mo | $250,000 | $199 | 27 |
Match score weights: distance 35% · size 25% · config 20% · recency 20%. Top-matched comps best support the ARV.
Projected returns pro-forma
-3.0% appreciation · 3.0% rent growth · sell at horizon
- IRR
- 65.6%
- Equity multiple
- 3.94×
- Total profit
- $50,682
- Equity at exit
- $9,167
- IRR
- 69.9%
- Equity multiple
- 8.11×
- Total profit
- $122,318
- Equity at exit
- $5,316
Cash invested: $17,214 (down + closing). Projections, not guarantees.
Landlord ↔ Tenant lean methodology
- Overall (STATE)
- 85 Strongly Landlord-Friendly
- State North Carolina
- 85 Strongly Landlord-Friendly · R+3
- County
- — inherits STATE
- City
- — inherits STATE
ZIP-level market 27370
- Home prices YoY
- -9.9%
- Active inventory
- 117
- Price-to-rent
- 2.9×
Monthly cashflow live
- Estimated rent
- $1,759 medium interval (Pro) →
- Mortgage (P&I)
- −$322
- Tax from tax record
- −$90 /mo · $1,083/yr
- Insurance
- −$26
- HOA
- −$0
- Vacancy / Maint / Mgmt
- −$369
- Net cashflow
- $952
Break-even live
UW: 25.0% down · 7.5% · 30yr · 1.5% tax · 5.0% vac · 8.0% maint · 8.0% mgmt
Financing live
Cash to close
- Down payment
- $15,370
- Closing costs
- $1,844
- Reserves months
- —
- Total cash needed
- —
Loan-product check · same deal, 3 products live
Conventional
25% down · 7.5% · 30yr
- Down + closing
- —
- Monthly P&I
- —
- Monthly cashflow
- —
- DSCR
- —
- Eligible?
- —
Personal DTI + credit; lowest rate.
DSCR
20% down · 8.5% · 30yr
- Down + closing
- —
- Monthly P&I
- —
- Monthly cashflow
- —
- DSCR
- —
- Eligible?
- —
No personal income docs; deal must DSCR.
Hard money
10% down · 12.0% · 12mo
- Down + closing
- —
- Monthly P&I
- —
- Monthly cashflow
- —
- DSCR
- —
- Eligible?
- —
Short-term bridge; refi at stabilization.
Rent comps 2 comps
| Address | Beds | Baths | Sqft | Rent | $/sqft | DOM | Units | Dist |
|---|---|---|---|---|---|---|---|---|
| 5665 Carrington Ct Trinity, NC | 3.0 | 2.5 | 1471 | $1,800 | $1.22 | 14d | 1 | 0.56mi |
| 5087 Meadowbrook Dr Trinity, NC | 3.0 | 2.0 | 1215 | $1,699 | $1.40 | 21d | 1 | 1.00mi |
Listing history 7 events
-
2026-05-22status Pending
-
2026-04-16status Active
-
2026-04-16historical
-
2026-04-15$61,480 Active
-
2006-04-27soldstatus $115,000
-
2005-04-29soldstatus $107,500
-
1998-04-24soldstatus $71,000
ⓘ Source: listings_history table (triggers on properties + properties_extension) + one-shot
backfill from property_details.listing_events for pre-trigger history.
Tax reassessment forecast NC · Resets to sale price
- Current annual tax
- $1,083 · $90/mo
- Projected year-2 tax
- $1,083 · $90/mo
- Expected delta
- $0/yr ($0/mo · 0.0%)
ⓘ Screening estimate from a state-policy table — verify with the county assessor before closing.
Climate risk First Street
- Flood 1/10 Low FEMA zone X (unshaded) · 0% chance over 30 yrs
- Wildfire 3/10 Moderate
- Heat 5/10 Major 7 d/yr ≥104°F today · 17 d/yr by 30 yrs out
- Wind 4/10 Moderate 15% chance of damaging wind over 30 yrs
- Air quality 2/10 Low 1 unhealthy d/yr today · 1 by 30 yrs out
Nearby sold comps map
Loading sold comps map…
Walkable amenities ~0.75 mi
Loading nearby amenities…
Taxation est. · year 1
- Rental income
- $21,112
- − Mortgage interest
- −$3,444
- − Property taxes
- −$1,083
- − Insurance
- −$307
- − Repairs & maintenance
- −$1,689
- − Management
- −$1,689
- − Depreciation
- −$1,789
- Taxable income
- $11,112
- Est. tax owed @ 24.0%
- −$2,667
- After-tax cash flow
- $8,753/yr
For passive investors: Depreciation is non-cash, so a rental often shows a tax loss while cash-flowing — sheltering income. Rental losses are passive: they offset passive income freely, and up to $25,000/yr can offset ordinary (W-2) income if you actively participate and your MAGI is under $100k (phasing out to $0 by $150k); unused losses carry forward. On sale, claimed depreciation is recaptured at up to 25%, and gains may owe capital-gains tax (a 1031 exchange can defer both). Figures are a year-1 estimate at your 24.0% rate — not tax advice; consult a CPA.
Schools (NCES district)
- District
- Randolph County School System
- NCES district ID
- 3703780
- Math proficiency
- 43% ▲ 1.00%
- Reading proficiency
- 43% ▲ 2.00%
- Median HH income
- $43,490
- Composite
- 36.37/100
- National rank
- #4686
- State rank
- #94 of 178 in NC
Livability — Trinity
- Score
- 69/100
- State rank
- #161
- US rank
- #8823
Category grades
Schools grade is shown separately in the Schools card above.
Census & demographics
- Census place
- Trinity, NC
- Population (ZIP)
- 15,223
Population outlook (Randolph County) Hauer SSP2
- Today (2025)
- 142,640 people
- By 2030
- 140,911 · -1.2%
- By 2040
- 135,692 · -4.9%
- By 2050
- 128,575 · -9.9%
- By 2075
- 111,507 · -21.8%
- By 2100
- 93,376 · -34.5%
Race, ethnicity, and origin ACS 2023
- Neighborhood character
- Predominantly White (89%)
- Race & ethnicity
- White 89% Hispanic / Latino 5% Two or more races 3% Black 2% Asian 1%
- Hispanic origin (detail)
- Mexican 3% Puerto Rican 2%
- Common ancestry
- Serbian 5% Slovak 5% Iranian 3%
- Foreign-born
- 1% · Canada
- Languages at home
- 96% English-only · Spanish 3% Tagalog/Filipino 1%
Political lean MEDSL · Randolph
- 2024 margin
- Solid R (+57.2) · D 21.0% · R 78.3%
- 2008→2024 swing
- -15.0pp toward R · 2008: -42.3pp · 2024: -57.2pp
- All cycles
- 2024: R+57.2 2020: R+56.3 2016: R+56.7 2012: R+50.2 2008: R+42.3
Not yet ingested
- Civics
- —
Market trends
- HPI YoY
- ▼ -26.61%
- Current HPI
- 242.2984
- Rent YoY
- —
- Metro
- —
- State GDP YoY
- ▲ 3.28%
- F500 in state
- 26
Industry mix (Fortune 500 HQ in NC)
| Industry | F500 HQs | Revenue |
|---|---|---|
| Financial Services | 2 | $213B |
|
||
| Retail | 2 | $95B |
|
||
| Industrial Conglomerate | 1 | $38B |
|
||
| Metals / Steel | 1 | $35B |
|
||
| Utilities | 1 | $30B |
|
||
| Industrial Machinery | 1 | $19B |
|
||
Price history
-13.4% since first listed7 events — show timeline
- 2026-05-22 Pending — Triad MLS
- 2026-04-16 Relisted — Triad MLS
- 2026-04-16 Delisted — Triad MLS
- 2026-04-15 Listed $61,480 Triad MLS
- 2006-04-27 Sold (Public Records) $115,000 Public Records
- 2005-04-29 Sold (Public Records) $107,500 Public Records
- 1998-04-24 Sold (Public Records) $71,000 Public Records
Property tax history
+2.9%/yrLatest (2025): $1,083 · +1.2% YoY. Source: county tax records.
Cash-flow waterfall
monthlySold comps — $/sqft
last 12 mo · ≤1 miLoading sold comps…