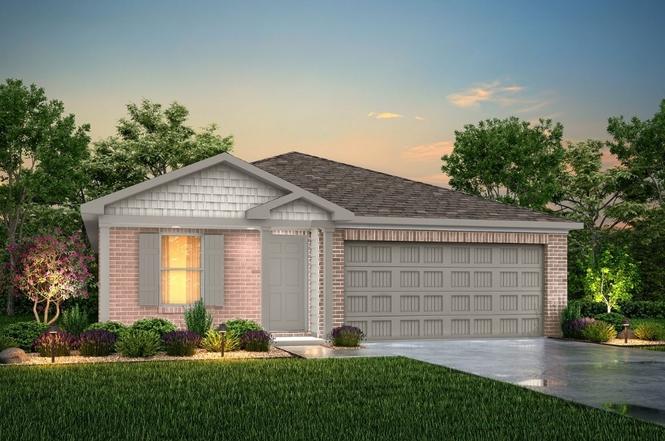
101 Boulder Ridge Dr · Cuero, TX
Flood risk 1/10 · Minimal
- FEMA flood zone
- X (unshaded)
- Chance of flooding over 30 yrs
- 0.0%
- Est. flood insurance / yr
- $507 – $1,088
Fire risk 6/10 · Moderate
- Est. fire insurance / yr
- $1,222 – $2,270
Heat risk 8/10 · Major
- Hot days now (above 111°F)
- 7 days/yr
- Hot days in 30 yrs
- 21 days/yr
Wind risk 8/10 · Major
- Chance of severe wind over 30 yrs
- 99.0%
Air-quality risk 1/10 · Minimal
- Unhealthy air days now
- 0 days/yr
- Unhealthy air days in 30 yrs
- 0 days/yr
Risk factors via First Street. Map © Google.
Why this score? — see what drove the C- grade
The composite is a weighted blend of 9 inputs, each scored 0–100. Each bar is that input's sub-score; the figure is the points it added to the 100-point composite (weight × sub-score).
- Cash flow +18.8/30.0
- ARV discount +7.5/15.0
- DSCR +5.9/10.0
- 1% rule +5.0/10.0
- Appreciation +5.0/10.0
- Schools +3.3/10.0
- Livability +3.3/5.0
- Rent growth +2.5/5.0
- Condition / age +2.5/5.0
$243,990
🖨 Deal sheet 📄 Offer letter ✓ Due diligence
Listing remarks
MLS# 1934666 - Built by NHC - Ready Now! ~ The Lincoln Plan from our Liberty Series offers the perfect combination of efficiency, comfort, and value. This single-story home features 4 bedrooms, 2 bathrooms, a 2-car garage, and 1,510 square feet of thoughtfully designed living space. Upon entering, you'll find three secondary bedrooms, a full-size bathroom, and a conveniently located laundry room. The heart of the home is the open-concept kitchen, which overlooks the dining area and spacious family room, making it perfect for hosting or everyday living. Toward the back of the home, the primary suite provides a private retreat, complete with an en suite bathroom. Access to the primary suite i
Key facts
- 3,049 sq ft lot
- Garage
- Built 2026
Neighborhood map
What this means for you Summary
Snapshot
- This is a 4-bed/2.0-bath land listed at $244k.
Deal economics
- At list price, monthly cash flow is $245 ($3k/yr) — positive.
- The deal already cash-flows at list — no discount required.
- Meets the 1% rule at list price ($2k rent vs $244k).
- Recommended offer: $240k (1.5% below list) — sets the bar for market timing.
- Cap rate 7.5% vs local median 5.1% in Cuero — top-decile yield for the area; either an underpriced asset or a hidden risk that comps aren't pricing in. Stress-test before assuming the spread holds.
Location & tenants
- Location reads 66/100 on livability (#617 in TX) — a middle-class / working-renter tenant base. Strengths: cost of living A+, housing A+, health & safety A+; Watch: crime F, amenities F, commute F.
- Cuero ISD (town): math 34% / reading 42% proficiency, ranked #454 of 826 in TX (top 55%) — families likely to look elsewhere, expect single-tenant / working-renter base with shorter leases.
- Zoned schools: Hunt El (math 29% / reading 34%, grade F, #2,396 of 4,322 statewide, top 56%, 506 students, 67% FRL); Cuero H S (math 37% / reading 57%, grade D-, #591 of 1,632 statewide, top 38%, 638 students, 53% FRL) — zoned schools at 60% FRL track the district average.
- Market conditions: 9 active listings in the ZIP; 2 comparable units currently listed for rent nearby; 9 units permitted in DeWitt County in 2024 (0 in 5+ unit buildings).
Forward outlook
- In year one you build about $9k of equity ($2k loan paydown + $7k appreciation (3.0% local appreciation)).
- DeWitt County population projected at +16% by 2050 — long-run rental-demand tailwind backs the buy-and-hold thesis.
- At projected returns (3.0% appreciation + 3.0% rent growth), your $68k cash investment doubles in ~5 years — after that, you're playing with house money.
- By year 4, paydown + projected appreciation supports a ~$31k cash-out refi (75% LTV) — recoverable capital for the next deal without selling this one.
Negotiation context
- It's been on market 17 days — a 2% lower offer ($240k) is reasonable based on typical stale-listing flexibility.
- 3 sale attempts since 8y ago with the ask held roughly flat each time — persistent listings suggest the price (not the market) is what's stuck; bring a comps-based counter.
Risks & watch-outs
- Climate carrying-cost: severe wind risk, 99% chance of damaging wind over 30y; major wildfire risk; extreme-heat days projected 7→21/yr by 2055 (HVAC capex compounding) — expect insurance premiums to compound above CPI over the hold.
Questions for the listing agent
- Is there a deadline driving the sale (1031 exchange, divorce, estate, relocation)? That informs how much negotiation room exists.
- Schools are D-rated, which usually means shorter tenancies and higher turnover. Who's the typical renter profile here, and what's been the actual vacancy rate?
- Crime grade is F in this area — have there been break-ins, vandalism, or insurance claims at this property in the last 3 years? What carrier currently insures it and at what premium?
- What's the average days-on-market for RENTAL listings here right now (not sales)? A rising rental-DOM trend means longer vacancies and softer asking-rent achievability than the comps imply.
- What's the recent tenant-quality profile in this submarket — average credit score on applications, eviction rate, late-payment / NSF rate, and stable-employment percentage? A property-management company in the area should have these aggregated.
- How much new for-sale + rental construction is in the pipeline within 1–3 miles? Heavy new supply typically softens prices + rents 12–24 months out; constrained supply supports both.
Investment metrics
- 1% rule
- 1.00% ✓
- Cap rate
- 7.50%
- Cash-on-cash
- 4.31%
- DSCR
- 1.19
- GRM
- 8.3
CMA / ARV
No comps found within radius.
Projected returns pro-forma
3.0% appreciation · 3.0% rent growth · sell at horizon
- IRR
- 11.5%
- Equity multiple
- 1.66×
- Total profit
- $45,046
- Equity at exit
- $109,708
- IRR
- 13.7%
- Equity multiple
- 3.03×
- Total profit
- $138,562
- Equity at exit
- $169,074
Cash invested: $68,317 (down + closing). Projections, not guarantees.
Landlord ↔ Tenant lean methodology
- Overall (STATE)
- 87 Strongly Landlord-Friendly
- State Texas
- 87 Strongly Landlord-Friendly · R+5
- County
- — inherits STATE
- City
- — inherits STATE
ZIP-level market 77594
- Active inventory
- 9
- Price-to-rent
- 8.3×
Monthly cashflow live
- Estimated rent
- $2,445 medium interval (Pro) →
- Mortgage (P&I)
- −$1,280
- Tax est. 1.5%
- −$305 /mo · $3,660/yr
- Insurance
- −$102
- HOA
- −$0
- Vacancy / Maint / Mgmt
- −$513
- Net cashflow
- $245
Break-even live
UW: 25.0% down · 7.5% · 30yr · 1.5% tax · 5.0% vac · 8.0% maint · 8.0% mgmt
Financing live
Cash to close
- Down payment
- $60,998
- Closing costs
- $7,320
- Reserves months
- —
- Total cash needed
- —
Loan-product check · same deal, 3 products live
Conventional
25% down · 7.5% · 30yr
- Down + closing
- —
- Monthly P&I
- —
- Monthly cashflow
- —
- DSCR
- —
- Eligible?
- —
Personal DTI + credit; lowest rate.
DSCR
20% down · 8.5% · 30yr
- Down + closing
- —
- Monthly P&I
- —
- Monthly cashflow
- —
- DSCR
- —
- Eligible?
- —
No personal income docs; deal must DSCR.
Hard money
10% down · 12.0% · 12mo
- Down + closing
- —
- Monthly P&I
- —
- Monthly cashflow
- —
- DSCR
- —
- Eligible?
- —
Short-term bridge; refi at stabilization.
Rent comps 2 comps
| Address | Beds | Baths | Sqft | Rent | $/sqft | DOM | Units | Dist |
|---|---|---|---|---|---|---|---|---|
| 909 2nd St Cuero, TX | 3.0 | 2.0 | 1224 | $2,500 | $2.04 | 43d | 1 | 0.09mi |
| 413 Schleicher St Cuero, TX | 5.0 | 2.0 | 1876 | $1,700 | $0.91 | 24d | 1 | 1.34mi |
Listing history 6 events
-
2026-04-27status Pending
-
2026-04-17status Back on Market
-
2026-01-23status Pending
-
2026-01-16$243,990 New
-
2021-03-31historical
-
2018-11-13$31,867 Active
ⓘ Source: listings_history table (triggers on properties + properties_extension) + one-shot
backfill from property_details.listing_events for pre-trigger history.
Climate risk First Street
- Flood 1/10 Low FEMA zone X (unshaded) · 0% chance over 30 yrs
- Wildfire 6/10 Major
- Heat 8/10 Severe 7 d/yr ≥111°F today · 21 d/yr by 30 yrs out
- Wind 8/10 Severe 99% chance of damaging wind over 30 yrs
- Air quality 1/10 Low 0 unhealthy d/yr today · 0 by 30 yrs out
Nearby sold comps map
Loading sold comps map…
Walkable amenities ~0.75 mi
Loading nearby amenities…
Taxation est. · year 1
- Rental income
- $29,337
- − Mortgage interest
- −$13,667
- − Property taxes
- −$3,660
- − Insurance
- −$1,220
- − Repairs & maintenance
- −$2,347
- − Management
- −$2,347
- − Depreciation
- −$7,098
- Taxable loss
- −$1,002
- Est. tax savings @ 24.0%
- +$240
- After-tax cash flow
- $3,183/yr
For passive investors: Depreciation is non-cash, so a rental often shows a tax loss while cash-flowing — sheltering income. Rental losses are passive: they offset passive income freely, and up to $25,000/yr can offset ordinary (W-2) income if you actively participate and your MAGI is under $100k (phasing out to $0 by $150k); unused losses carry forward. On sale, claimed depreciation is recaptured at up to 25%, and gains may owe capital-gains tax (a 1031 exchange can defer both). Figures are a year-1 estimate at your 24.0% rate — not tax advice; consult a CPA.
Schools (NCES district)
- District
- Cuero ISD
- NCES district ID
- 4815960
- Math proficiency
- 34% ▼ -7.00%
- Reading proficiency
- 42% ▬ 0.00%
- Median HH income
- $46,956
- Composite
- 32.52/100
- National rank
- #5700
- State rank
- #454 of 826 in TX
Livability — Cuero
- Score
- 66/100
- State rank
- #617
- US rank
- #11713
Category grades
Schools grade is shown separately in the Schools card above.
Census & demographics
- Census place
- Cuero, TX
Population outlook (DeWitt County) Hauer SSP2
- Today (2025)
- 22,271 people
- By 2030
- 22,953 · +3.1%
- By 2040
- 24,396 · +9.5%
- By 2050
- 25,921 · +16.4%
- By 2075
- 29,672 · +33.2%
- By 2100
- 29,516 · +32.5%
Not yet ingested
- Political lean
- —
- Race & ethnicity
- —
- Common origin
- —
- Civics
- —
Market trends
- HPI YoY
- —
- Current HPI
- —
- Rent YoY
- —
- Metro
- —
- State GDP YoY
- ▲ 3.95%
- F500 in state
- 110
Industry mix (Fortune 500 HQ in TX)
| Industry | F500 HQs | Revenue |
|---|---|---|
| Energy | 16 | $1,198B |
|
||
| Technology | 5 | $198B |
|
||
| Engineering / Construction | 4 | $72B |
|
||
| Energy Services | 3 | $60B |
|
||
| Utilities | 3 | $41B |
|
||
| Healthcare | 2 | $330B |
|
||
Price history
+665.7% since first listed6 events — show timeline
- 2026-04-27 Pending — LERA
- 2026-04-17 Relisted — LERA
- 2026-01-23 Pending — LERA
- 2026-01-16 Listed $243,990 LERA
- 2021-03-31 Listing Removed — HARMLS
- 2018-11-13 Listed $31,867 HARMLS
Cash-flow waterfall
monthlySold comps — $/sqft
last 12 mo · ≤1 miLoading sold comps…