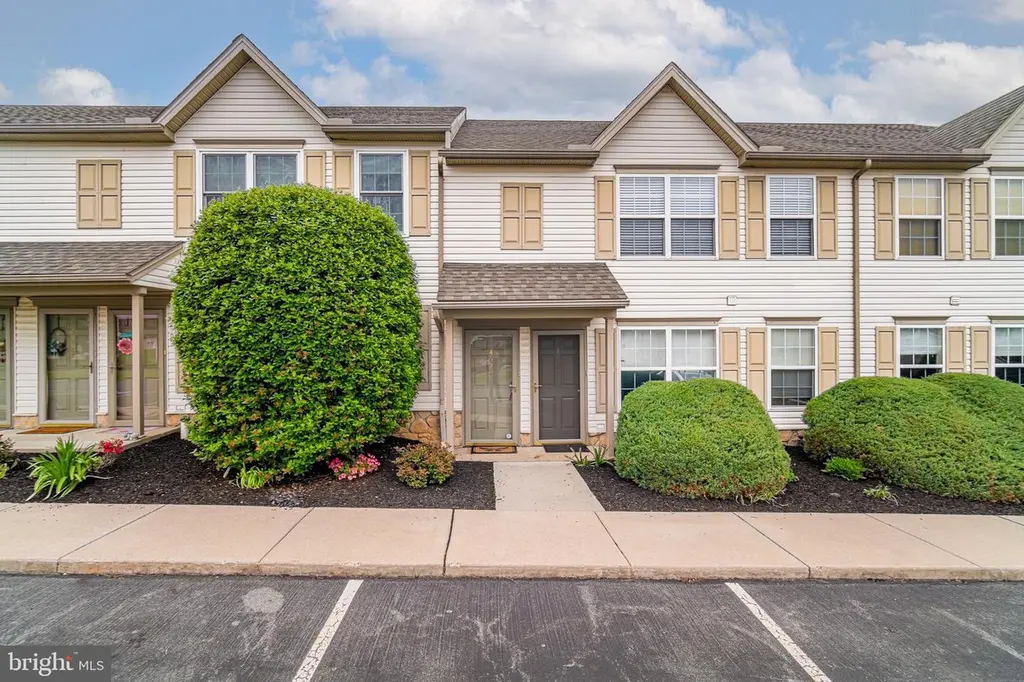
452B Buttonwood Ln · Hallam, PA
Flood risk 1/10 · Minimal
- FEMA flood zone
- X (unshaded)
- Chance of flooding over 30 yrs
- 0.0%
- Est. flood insurance / yr
- $507 – $1,088
Fire risk 2/10 · Minimal
- Est. fire insurance / yr
- $511 – $949
Heat risk 6/10 · Moderate
- Hot days now (above 101°F)
- 7 days/yr
- Hot days in 30 yrs
- 16 days/yr
Wind risk 4/10 · Minor
- Chance of severe wind over 30 yrs
- 13.0%
Air-quality risk 3/10 · Minor
- Unhealthy air days now
- 3 days/yr
- Unhealthy air days in 30 yrs
- 4 days/yr
Risk factors via First Street. Map © Google.
Why this score? — see what drove the D- grade
The composite is a weighted blend of 9 inputs, each scored 0–100. Each bar is that input's sub-score; the figure is the points it added to the 100-point composite (weight × sub-score).
- Cash flow +10.5/30.0
- ARV discount +7.5/15.0
- 1% rule +5.4/10.0
- Schools +4.5/10.0
- Livability +3.7/5.0
- DSCR +3.0/10.0
- Rent growth +2.5/5.0
- Condition / age +2.5/5.0
- Appreciation +0.0/10.0
$155,000
🖨 Deal sheet (PDF) 📄 Offer letter ✓ Due diligence
Listing remarks MLS
Own for less than rent! No $ down with qualification. Enjoy carefree living and affordability. Cherry kitchen, gas stove, lots of cabinetry with pantry. All appliances included. Master with walk-in closet. Laundry room. Great country view from your balcony deck. Take advantage of great interest rates and stop paying rent today!
Key facts
- $220 HOA
- Built 2002
- Listed 18 days
Property features AI
Finance
- Other: Above-grade finished area recorded by assessor; No basement
- HOA & community: Condo/coop fee $220 monthly covering exterior building maintenance
Exterior
- Parking: Off-street parking
- Utilities: Public water; Public sewer; Electric cooling; Natural gas heating
- Home design: Interior townhouse/rowhouse; 2 total levels; Fee simple ownership; Very good condition
- Construction: Vinyl siding; Slab foundation; Pets allowed with size/weight and number restrictions; Built year recorded by assessor
- Exterior features: Not in a federal flood zone; Suburban location
Interior
- Bedrooms: 2 bedrooms on the main level
- Bathrooms: One full bathroom; One half bathroom
- Heating & cooling: Forced air heating; Central air conditioning; Electric hot water
- Interior features: Tub/shower; Combination dining and living area
- Laundry & utility: Laundry on the main floor
Neighborhood map
What this means for you Summary
Snapshot
- This is a 2-bed/1.5-bath condo listed at $155k.
Deal economics
- At list price, monthly cash flow is $-81 ($-969/yr) — negative.
- To cash-flow at today's rent, offer at most $141k (9.2% below list).
- Meets the 1% rule at list price ($2k rent vs $155k).
- Recommended offer: $141k (9.2% below list) — sets the bar for cash-flow.
Location & tenants
- Location reads 74/100 on livability (#519 in PA, #4,787 nationally) — a middle-class / working-renter tenant base. Strengths: crime A+, cost of living A+, housing A+; Watch: amenities F, commute F.
- Eastern York SD (rural): math 40% / reading 64% proficiency, ranked #146 of 539 in PA (top 27%) — acceptable for families but not a draw, mixed tenant base, ~2y average lease.
- Zoned schools: Kreutz Creek El Sch (math 42% / reading 57%, grade D, #654 of 1,518 statewide, top 47%, 360 students, 52% FRL); Eastern York Ms (math 30% / reading 70%, grade C, #129 of 512 statewide, top 26%, 517 students, 48% FRL); Eastern York Hs (math 77% / reading 24%, grade D+, #125 of 437 statewide, top 30%, 632 students, 46% FRL) — zoned schools average 49% FRL vs 32% district-wide (16 pts higher); higher-poverty schools than district average — tighter screening recommended.
- Market conditions: 174 active listings in the ZIP; 3 comparable units currently listed for rent nearby; rentals at typical pace (median 16d on market — plan ~3-4 weeks tenant-placement turnaround); solid renter incomes; 1,328 units permitted in York County in 2024 (338 in 5+ unit buildings).
Forward outlook
- Local home prices are declining (-3.0%/yr); year-one equity from $1k of loan paydown is wiped out by about $5k of value loss. Plan a longer hold.
Negotiation context
- It's been on market 18 days — a 2% lower offer ($153k) is reasonable based on typical stale-listing flexibility.
- 9 sale attempts since 22y ago with the ask held roughly flat each time — persistent listings suggest the price (not the market) is what's stuck; bring a comps-based counter.
Risks & watch-outs
- Climate carrying-cost: extreme-heat days projected 7→16/yr by 2055 (HVAC capex compounding) — expect insurance premiums to compound above CPI over the hold.
Questions for the listing agent
- What do current leases actually rent for vs. the listed asking? Can we see a recent rent roll and the last 12 months of T-12 income?
- What does the HOA fee cover, when was the last increase, and are there any pending special assessments or reserve-fund shortfalls?
- Any open or pending special assessments — roof, HVAC, plumbing, elevator, façade? What's the per-unit balance and payoff schedule, and is the seller paying it off at close or rolling it to the buyer?
- Is there a deadline driving the sale (1031 exchange, divorce, estate, relocation)? That informs how much negotiation room exists.
- Schools are D-rated, which usually means shorter tenancies and higher turnover. Who's the typical renter profile here, and what's been the actual vacancy rate?
- The area grade is low — what's the realistic commute time and amenity access for the typical tenant pool here? Any planned neighborhood developments (good or bad) we should know about?
- What's the average days-on-market for RENTAL listings here right now (not sales)? A rising rental-DOM trend means longer vacancies and softer asking-rent achievability than the comps imply.
- What's the recent tenant-quality profile in this submarket — average credit score on applications, eviction rate, late-payment / NSF rate, and stable-employment percentage? A property-management company in the area should have these aggregated.
- How much new apartment / multifamily construction is in the pipeline within 1–3 miles? Heavy new supply (>2% of stock underway) typically softens rents 12–24 months out; light construction supports rent growth.
Investment metrics
- 1% rule
- 1.04% ✓
- Cap rate
- 5.67%
- Cash-on-cash
- -2.23%
- DSCR
- 0.90
- GRM
- 8.0
CMA / ARV
No comps found within radius.
Projected returns pro-forma
-3.0% appreciation · 3.0% rent growth · sell at horizon
- IRR
- -19.8%
- Equity multiple
- 0.31×
- Total profit
- $-30,064
- Equity at exit
- $23,111
- IRR
- -12.4%
- Equity multiple
- 0.26×
- Total profit
- $-32,004
- Equity at exit
- $13,402
Cash invested: $43,400 (down + closing). Projections, not guarantees.
Landlord ↔ Tenant lean methodology
- Overall (STATE)
- 62 Landlord-Friendly
- State Pennsylvania
- 62 Landlord-Friendly · EVEN
- County
- — inherits STATE
- City
- — inherits STATE
ZIP-level market 17406
- Home prices YoY
- -27.4%
- Active inventory
- 174
- Price-to-rent
- 8.0×
Monthly cashflow live
- Estimated rent
- $1,609 medium interval (Pro) →
- Mortgage (P&I)
- −$813
- Tax from tax record
- −$254 /mo · $3,051/yr
- Insurance
- −$65
- HOA
- −$220
- Vacancy / Maint / Mgmt
- −$338
- Net cashflow
- $-81
Break-even live
Sensitivity live
| Price | -10% $7 | -5% $-37 | +0% $-81 | +5% $-125 | +10% $-169 |
|---|---|---|---|---|---|
| Rent | -10% $-208 | -5% $-144 | +0% $-81 | +5% $-17 | +10% $46 |
| Rate | -1.0pp $-3 | -0.5pp $-41 | base $-81 | +0.5pp $-121 | +1.0pp $-162 |
UW: 25.0% down · 7.5% · 30yr · 1.5% tax · 5.0% vac · 8.0% maint · 8.0% mgmt
Financing live
Cash to close
- Down payment
- $38,750
- Closing costs
- $4,650
- Reserves months
- —
- Total cash needed
- —
Loan-product check · same deal, 3 products live
Conventional
25% down · 7.5% · 30yr
- Down + closing
- —
- Monthly P&I
- —
- Monthly cashflow
- —
- DSCR
- —
- Eligible?
- —
Personal DTI + credit; lowest rate.
DSCR
20% down · 8.5% · 30yr
- Down + closing
- —
- Monthly P&I
- —
- Monthly cashflow
- —
- DSCR
- —
- Eligible?
- —
No personal income docs; deal must DSCR.
Hard money
10% down · 12.0% · 12mo
- Down + closing
- —
- Monthly P&I
- —
- Monthly cashflow
- —
- DSCR
- —
- Eligible?
- —
Short-term bridge; refi at stabilization.
Rent comps 3 comps
| Address | Beds | Baths | Sqft | Rent | $/sqft | DOM | Units | Dist |
|---|---|---|---|---|---|---|---|---|
| 301 Friendship Ave Hallam, PA | 1.0–2.0 | 1.0–1.5 | 908 | $1,720 | $1.89 | 15d | 13 | 0.09mi |
| 360 W Market St Unit B Hallam, PA | 2.0 | 1.0 | 1150 | $1,295 | $1.13 | 23d | 1 | 0.78mi |
| Old Church Ln Hellam Township, PA | 2.0 | 2.5 | 1000 | $1,700 | $1.70 | 15d | 1 | 1.17mi |
HOA detail condo
- Monthly dues
- $220 · $2,640/yr
- Likely covers
- gas
- Assessments
- None detected in remarks — confirm with the listing agent.
Listing history 26 events
-
2026-05-02$155,000 Active 1574-char remark
-
2026-04-30historical $155,000 1574-char remark
-
2020-05-13historical
-
2017-09-05soldstatus $70,000
-
2017-08-31soldstatus $70,000
Show marketing remark (329 chars)
Own for less than rent! No $ down with qualification. Enjoy carefree living and affordability. Cherry kitchen, gas stove, lots of cabinetry with pantry. All appliances included. Master with walk-in closet. Laundry room. Great country view from your balcony deck. Take advantage of great interest rates and stop paying rent today!
-
2017-07-21historical
Show marketing remark (329 chars)
Own for less than rent! No $ down with qualification. Enjoy carefree living and affordability. Cherry kitchen, gas stove, lots of cabinetry with pantry. All appliances included. Master with walk-in closet. Laundry room. Great country view from your balcony deck. Take advantage of great interest rates and stop paying rent today!
-
2017-06-16$75,000
-
2017-04-12$75,000
Show marketing remark (329 chars)
Own for less than rent! No $ down with qualification. Enjoy carefree living and affordability. Cherry kitchen, gas stove, lots of cabinetry with pantry. All appliances included. Master with walk-in closet. Laundry room. Great country view from your balcony deck. Take advantage of great interest rates and stop paying rent today!
-
2017-04-07historical
-
2017-01-16$79,900
-
2016-10-04historical
-
2016-06-02$84,999
-
2014-11-06soldstatus $73,500
-
2014-10-31historical
-
2014-10-31soldstatus $73,500
-
2014-08-27historical
-
2014-07-10$75,000
-
2014-06-26$75,000
-
2004-11-30historical
-
2004-08-16soldstatus $68,815
-
2004-08-16soldstatus $74,900
-
2004-08-13soldstatus $74,900
-
2004-07-08historical
-
2004-07-07$74,900
-
2004-04-14$79,900
-
2002-05-23soldstatus $68,815
ⓘ Source: listings_history table (triggers on properties + properties_extension) + one-shot
backfill from property_details.listing_events for pre-trigger history.
Tax reassessment forecast PA · Partial reset (capped growth)
- Current annual tax
- $3,051 · $254/mo
- Projected year-2 tax
- $3,051 · $254/mo
- Expected delta
- $0/yr ($0/mo · 0.0%)
ⓘ Screening estimate from a state-policy table — verify with the county assessor before closing.
Climate risk First Street
- Flood 1/10 Low FEMA zone X (unshaded) · 0% chance over 30 yrs
- Wildfire 2/10 Low
- Heat 6/10 Major 7 d/yr ≥101°F today · 16 d/yr by 30 yrs out
- Wind 4/10 Moderate 13% chance of damaging wind over 30 yrs
- Air quality 3/10 Moderate 3 unhealthy d/yr today · 4 by 30 yrs out
Nearby sold comps map
Loading sold comps map…
Walkable amenities ~0.75 mi
Loading nearby amenities…
Taxation est. · year 1
- Rental income
- $19,305
- − Mortgage interest
- −$8,682
- − Property taxes
- −$3,051
- − Insurance
- −$775
- − Repairs & maintenance
- −$1,544
- − Management
- −$1,544
- − HOA
- −$2,640
- − Depreciation
- −$4,509
- Taxable loss
- −$3,441
- Est. tax savings @ 24.0%
- +$826
- After-tax cash flow
- $-143/yr
For passive investors: Depreciation is non-cash, so a rental often shows a tax loss while cash-flowing — sheltering income. Rental losses are passive: they offset passive income freely, and up to $25,000/yr can offset ordinary (W-2) income if you actively participate and your MAGI is under $100k (phasing out to $0 by $150k); unused losses carry forward. On sale, claimed depreciation is recaptured at up to 25%, and gains may owe capital-gains tax (a 1031 exchange can defer both). Figures are a year-1 estimate at your 24.0% rate — not tax advice; consult a CPA.
Schools (NCES district)
- District
- Eastern York SD
- NCES district ID
- 4208790
- Math proficiency
- 40% ▼ -18.00%
- Reading proficiency
- 64% ▼ -11.00%
- Median HH income
- $56,178
- Composite
- 44.94/100
- National rank
- #2712
- State rank
- #146 of 539 in PA
Livability — Hallam
- Score
- 74/100
- State rank
- #519
- US rank
- #4787
Category grades
Schools grade is shown separately in the Schools card above.
Census & demographics
- Census place
- Hallam, PA
- County
- York County · 278,806 people
- Metro
- York-Hanover, PA
- Population (ZIP)
- 23,636
- Household income
- $83,521
- Rent vs Own
- Severe rent burden
- 296.0
Population outlook (York County) Hauer SSP2
- Today (2025)
- 454,205 people
- By 2030
- 457,407 · +0.7%
- By 2040
- 457,529 · +0.7%
- By 2050
- 448,261 · -1.3%
- By 2075
- 427,388 · -5.9%
- By 2100
- 384,218 · -15.4%
Race, ethnicity, and origin ACS 2023
- Neighborhood character
- Predominantly White (84%)
- Race & ethnicity
- White 84% Two or more races 6% Black 5% Hispanic / Latino 4%
- Common ancestry
- Romanian 3% Lithuanian 2% Slovak 2%
- Foreign-born
- 3% · Canada
- Languages at home
- 95% English-only · Spanish 2% Russian/Polish/Slavic 1% Arabic 1%
Political lean MEDSL · York
- 2024 margin
- Strong R (+25.3) · D 36.9% · R 62.1%
- 2008→2024 swing
- -11.7pp toward R · 2008: -13.6pp · 2024: -25.3pp
- All cycles
- 2024: R+25.3 2020: R+24.6 2016: R+29.3 2012: R+21.2 2008: R+13.6
Not yet ingested
- Civics
- —
Market trends
- HPI YoY
- ▼ -92.81%
- Current HPI
- 245.4821
- Rent YoY
- —
- Metro
- York-Hanover, PA
- State GDP YoY
- ▲ 1.68%
- F500 in state
- 34
Industry mix (Fortune 500 HQ in PA)
| Industry | F500 HQs | Revenue |
|---|---|---|
| Healthcare | 2 | $309B |
|
||
| Insurance | 2 | $27B |
|
||
| Telecommunications / Media | 1 | $124B |
|
||
| Industrial Distribution | 1 | $22B |
|
||
| Financial Services | 1 | $20B |
|
||
| Chemicals / Materials | 1 | $18B |
|
||
Price history
+126.0% since first listed28 events — show timeline
- 2026-06-05 Sold (MLS) $155,500 BRIGHT MLS
- 2026-05-20 Pending — BRIGHT MLS
- 2026-05-02 Listed $155,000 BRIGHT MLS
- 2026-04-30 Coming Soon $155,000 BRIGHT MLS
- 2020-05-13 Listing Removed — BRIGHT MLS
- 2017-09-05 Sold (Public Records) $70,000 Public Records
- 2017-08-31 Sold (MLS) $70,000 BRIGHT MLS
- 2017-07-21 Listing Removed — BRIGHT MLS
- 2017-06-16 Listed $75,000 BRIGHT MLS
- 2017-04-12 Listed $75,000 BRIGHT MLS
- 2017-04-07 Listing Removed — BRIGHT MLS
- 2017-01-16 Listed $79,900 BRIGHT MLS
- 2016-10-04 Listing Removed — BRIGHT MLS
- 2016-06-02 Listed $84,999 BRIGHT MLS
- 2014-11-06 Sold (Public Records) $73,500 Public Records
- 2014-10-31 Sold (MLS) $73,500 BRIGHT MLS
- 2014-10-31 Listing Removed — BRIGHT MLS
- 2014-08-27 Listing Removed — BRIGHT MLS
- 2014-07-10 Listed $75,000 BRIGHT MLS
- 2014-06-26 Listed $75,000 BRIGHT MLS
- 2004-11-30 Listing Removed — BRIGHT MLS
- 2004-08-16 Sold (Public Records) $74,900 Public Records
- 2004-08-16 Sold (Public Records) $68,815 Public Records
- 2004-08-13 Sold (MLS) $74,900 BRIGHT MLS
- 2004-07-08 Listing Removed — BRIGHT MLS
- 2004-07-07 Listed $74,900 BRIGHT MLS
- 2004-04-14 Listed $79,900 BRIGHT MLS
- 2002-05-23 Sold (Public Records) $68,815 Public Records
Property tax history
+3.7%/yrLatest (2026): $3,051 · +11.0% YoY. Source: county tax records.
Cash-flow waterfall
monthlySold comps — $/sqft
last 12 mo · ≤1 miLoading sold comps…