 Multi-family
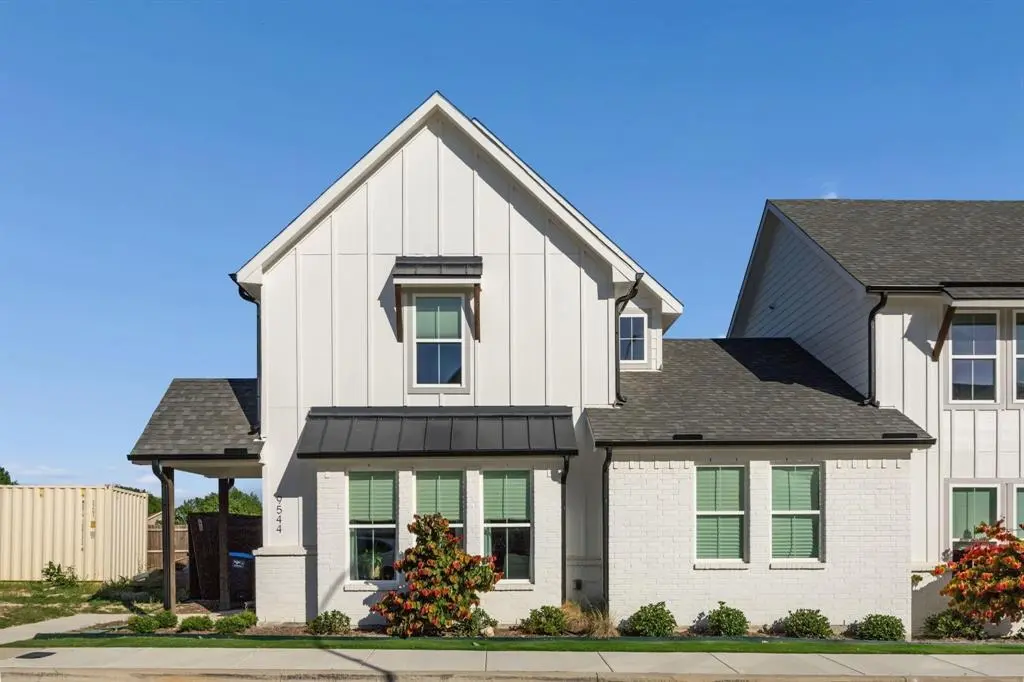
9544 Thorncrown Ln · Fort Worth, TX
Flood risk 1/10 · Minimal
- FEMA flood zone
- X (unshaded)
- Chance of flooding over 30 yrs
- 0.0%
- Est. flood insurance / yr
- $507 – $1,088
Fire risk 4/10 · Minor
- Est. fire insurance / yr
- $1,222 – $2,270
Heat risk 8/10 · Major
- Hot days now (above 109°F)
- 7 days/yr
- Hot days in 30 yrs
- 24 days/yr
Wind risk 4/10 · Minor
- Chance of severe wind over 30 yrs
- 21.0%
Air-quality risk 2/10 · Minimal
- Unhealthy air days now
- 2 days/yr
- Unhealthy air days in 30 yrs
- 2 days/yr
Risk factors via First Street. Map © Google.
Why this score? — see what drove the C+ grade
The composite is a weighted blend of 9 inputs, each scored 0–100. Each bar is that input's sub-score; the figure is the points it added to the 100-point composite (weight × sub-score).
- Cash flow +23.4/30.0
- DSCR +7.5/10.0
- ARV discount +7.5/15.0
- 1% rule +7.4/10.0
- Livability +4.0/5.0
- Condition / age +4.0/5.0
- Schools +3.5/10.0
- Rent growth +2.9/5.0
- Appreciation +0.0/10.0
$325,000
🖨 Deal sheet (PDF) 📄 Offer letter ✓ Due diligence
Multi-family units
County records classify this as Multi-Family (2-4 Unit). Listing-text estimate: 1 unit. estimate disagrees with records
Listing remarks
Portfolio sale consisting of MLS #21289196, MLS #21289104, and MLS #21289267. The Thorncrown Portfolio consists of three newly constructed residential income properties at 9524, 9540, and 9544 Thorncrown Lane in Fort Worth, Texas. Built in 2024 and offered as a single acquisition, the portfolio provides immediate cash flow, proven rental performance, and minimal capital expenditure requirements. The properties have maintained 100% occupancy since acquisition and generate $82,800 in trailing twelve-month gross rental income and $49,967 in net operating income, with rent and OPEX optimization opportunities. All three homes have achieved rental rates of approximately $2,300 (below market compa
Key facts
- 2,744 sq ft lot
- Garage
- Built 2024
Property features AI
Finance
- Other: Property listed as Residential Income (multi-family); Occupancy rate 100%
- Financial info: Capitalization rate 5.12%; Gross annual income $27,600; Gross annual expenses $10,956; Insurance expense $2,106; Net operating income $16,653
- HOA & community: Mandatory association managed by Globalink Property Management; Association fee $175 monthly; Association covers front yard maintenance, grounds maintenance, and structure maintenance
Exterior
- Parking: Attached garage with garage door opener (garage faces rear); 2 carport spaces (2 parking spaces total); Garage approximately 19' wide by 20' long
- Security: Smoke detector(s)
- Utilities: City sewer; City water with individual water meter; Electricity available; Cable available; Underground utilities
- Home design: Residential income, multi-family property; Two levels; Year built 2024
- Construction: Concrete and fiber cement construction; Composition roof; Slab foundation
- Exterior features: Back yard wood fencing; All weather road; Alley access; Curbs; Sidewalk
Interior
- Kitchen: Dishwasher; Disposal; Electric range; Microwave
- Bedrooms: 3 bedrooms
- Flooring: Carpet; Ceramic tile
- Bathrooms: 2 full bathrooms
- Heating & cooling: Central heating (electric); Central air; Ceiling fan(s)
- Interior features: Cable TV available; Eat-in kitchen; Flat screen wiring; High-speed internet available; Kitchen island; Open floorplan; Pantry; Walk-in closet(s)
Neighborhood map
What this means for you Summary
Snapshot
- This is a 3-bed/2.0-bath multifamily listed at $325k. Condition is rated good.
Deal economics
- At list price, monthly cash flow is $598 ($7k/yr) — positive.
- The deal already cash-flows at list — no discount required.
- Meets the 1% rule at list price ($4k rent vs $325k).
- Recommended offer: $320k (1.5% below list) — sets the bar for market timing.
- Cap rate 8.5% vs local median 3.9% in Fort Worth — top-decile yield for the area; either an underpriced asset or a hidden risk that comps aren't pricing in. Stress-test before assuming the spread holds.
Location & tenants
- Location reads 80/100 on livability (#49 in TX, #1,954 nationally) — a professional / high-income tenant draw. Strengths: amenities A+, cost of living A+, housing A+; Watch: crime F.
- Eagle Mt-Saginaw ISD (urban): math 35% / reading 42% proficiency, ranked #361 of 826 in TX (top 44%) — families likely to look elsewhere, expect single-tenant / working-renter base with shorter leases.
- Zoned schools: Eagle Mountain El (math 40% / reading 42%, grade F, #1,462 of 4,322 statewide, top 34%, 507 students, 19% FRL); Wayside Middle (math 42% / reading 42%, grade D-, #572 of 1,662 statewide, top 36%, 1,077 students, 39% FRL); Boswell H S (math 49% / reading 62%, grade C, #364 of 1,632 statewide, top 23%, 2,547 students, 37% FRL) — zoned schools at 32% FRL track the district average.
- Market conditions: Rents rising (+1.5%/yr); 1074 active listings in the ZIP; 10 comparable units currently listed for rent nearby; rentals at typical pace (median 26d on market — plan ~3-4 weeks tenant-placement turnaround); solid renter incomes; 18,938 units permitted in Tarrant County in 2024 (8,336 in 5+ unit buildings).
- This rent runs 45% of the median local income ($107k/yr) — at the standard rent-burdened threshold; future hikes will face affordability resistance.
Forward outlook
- Local home prices are declining (-3.0%/yr); year-one equity from $2k of loan paydown is wiped out by about $10k of value loss. Plan a longer hold.
- Tarrant County population projected at +41% by 2050 — long-run rental-demand tailwind backs the buy-and-hold thesis.
Negotiation context
- It's been on market 16 days — a 2% lower offer ($320k) is reasonable based on typical stale-listing flexibility.
- 3 sale attempts since 2y ago with the ask held roughly flat each time — persistent listings suggest the price (not the market) is what's stuck; bring a comps-based counter.
Risks & watch-outs
- Climate carrying-cost: extreme-heat days projected 7→24/yr by 2055 (HVAC capex compounding) — expect insurance premiums to compound above CPI over the hold.
Questions for the listing agent
- What does the HOA fee cover, when was the last increase, and are there any pending special assessments or reserve-fund shortfalls?
- Is there a deadline driving the sale (1031 exchange, divorce, estate, relocation)? That informs how much negotiation room exists.
- Schools are D-rated, which usually means shorter tenancies and higher turnover. Who's the typical renter profile here, and what's been the actual vacancy rate?
- Crime grade is F in this area — have there been break-ins, vandalism, or insurance claims at this property in the last 3 years? What carrier currently insures it and at what premium?
- What's the average days-on-market for RENTAL listings here right now (not sales)? A rising rental-DOM trend means longer vacancies and softer asking-rent achievability than the comps imply.
- What's the recent tenant-quality profile in this submarket — average credit score on applications, eviction rate, late-payment / NSF rate, and stable-employment percentage? A property-management company in the area should have these aggregated.
- How much new apartment / multifamily construction is in the pipeline within 1–3 miles? Heavy new supply (>2% of stock underway) typically softens rents 12–24 months out; light construction supports rent growth.
Investment metrics
- 1% rule
- 1.24% ✓
- Cap rate
- 8.50%
- Cash-on-cash
- 7.89%
- DSCR
- 1.35
- GRM
- 6.7
CMA / ARV
No comps found within radius.
Projected returns pro-forma
-3.0% appreciation · 1.51% rent growth · sell at horizon
- IRR
- -6.1%
- Equity multiple
- 0.78×
- Total profit
- $-20,256
- Equity at exit
- $48,459
- IRR
- 1.5%
- Equity multiple
- 1.10×
- Total profit
- $8,808
- Equity at exit
- $28,100
Cash invested: $91,000 (down + closing). Projections, not guarantees.
Landlord ↔ Tenant lean methodology
- Overall (STATE)
- 87 Strongly Landlord-Friendly
- State Texas
- 87 Strongly Landlord-Friendly · R+5
- County
- — inherits STATE
- City
- — inherits STATE
ZIP-level market 76179
- Rents YoY
- 1.5%
- Active inventory
- 1074
- Price-to-rent
- 13.5×
Monthly cashflow live
- Estimated rent
- $4,026 medium interval (Pro) →
- Mortgage (P&I)
- −$1,704
- Tax from tax record
- −$568 /mo · $6,813/yr
- Insurance
- −$135
- HOA
- −$175
- Vacancy / Maint / Mgmt
- −$845
- Net cashflow
- $598
Break-even live
Sensitivity live
| Price | -10% $782 | -5% $690 | +0% $598 | +5% $506 | +10% $414 |
|---|---|---|---|---|---|
| Rent | -10% $280 | -5% $439 | +0% $598 | +5% $757 | +10% $916 |
| Rate | -1.0pp $762 | -0.5pp $681 | base $598 | +0.5pp $514 | +1.0pp $428 |
2-unit breakdown (identical units grouped — click to expand)
| Units | Beds | Baths | Est. rent |
|---|---|---|---|
| 2× units | 3 | 2 | $4,026 |
| #1 | 3 | 2 | $2,013 |
| #2 | 3 | 2 | $2,013 |
| Total (2 units) | $4,026 | ||
UW: 25.0% down · 7.5% · 30yr · 1.5% tax · 5.0% vac · 8.0% maint · 8.0% mgmt
Financing live
Cash to close
- Down payment
- $81,250
- Closing costs
- $9,750
- Reserves months
- —
- Total cash needed
- —
Loan-product check · same deal, 3 products live
Conventional
25% down · 7.5% · 30yr
- Down + closing
- —
- Monthly P&I
- —
- Monthly cashflow
- —
- DSCR
- —
- Eligible?
- —
Personal DTI + credit; lowest rate.
DSCR
20% down · 8.5% · 30yr
- Down + closing
- —
- Monthly P&I
- —
- Monthly cashflow
- —
- DSCR
- —
- Eligible?
- —
No personal income docs; deal must DSCR.
Hard money
10% down · 12.0% · 12mo
- Down + closing
- —
- Monthly P&I
- —
- Monthly cashflow
- —
- DSCR
- —
- Eligible?
- —
Short-term bridge; refi at stabilization.
Rent comps 10 comps
| Address | Beds | Baths | Sqft | Rent | $/sqft | DOM | Units | Dist |
|---|---|---|---|---|---|---|---|---|
| 9532 Thorncrown Ln Fort Worth, TX | 3.0 | 2.5 | 1856 | $2,100 | $1.13 | 20d | 1 | 0.03mi |
| 9525 Thorncrown Ln Fort Worth, TX | 3.0 | 3.0 | 1999 | $2,400 | $1.20 | 0d | 1 | 0.06mi |
| 9601 Thorncrown Ln Fort Worth, TX | 3.0 | 2.5 | 1906 | $2,600 | $1.36 | 26d | 1 | 0.06mi |
| 9613 Thorncrown Ln Fort Worth, TX | 3.0 | 2.5 | 1907 | $2,295 | $1.20 | 26d | 1 | 0.08mi |
| 9600 Sullivan Ln Fort Worth, TX | 3.0 | 2.0 | 1782 | $2,500 | $1.40 | 26d | 1 | 0.09mi |
| 9709 Thorncrown Ln Fort Worth, TX | 3.0 | 2.5 | 1933 | $2,350 | $1.22 | 0d | 1 | 0.11mi |
| 9455 Tranquil Acres Rd Fort Worth, TX | 3.0 | 2.0 | 1400 | $2,000 | $1.43 | 26d | 1 | 0.35mi |
| 9400 Live Oak Ln Fort Worth, TX | 3.0 | 2.0 | 1553 | $3,000 | $1.93 | 0d | 1 | 0.40mi |
| 8725 Hidden Hill Dr Fort Worth, TX | 3.0 | 2.5 | 2052 | $2,500 | $1.22 | 26d | 1 | 1.27mi |
| 3025 Tooley Dr Fort Worth, TX | 4.0 | 2.0 | 1667 | $2,320 | $1.39 | 26d | 1 | 1.40mi |
HOA detail
- Monthly dues
- $175 · $2,100/yr
Listing history 11 events
-
2026-06-21days on market $325,000 Active 16 DOM
-
2026-06-18days on market $325,000 Active 13 DOM
-
2026-06-17days on market $325,000 Active 12 DOM
-
2026-06-16days on market $325,000 Active 11 DOM
-
2026-06-15days on market $325,000 Active 10 DOM
-
2026-06-13days on market $325,000 Active 8 DOM
-
2026-06-13days on market $325,000 Active 7 DOM
-
2026-06-09days on market $325,000 Active 4 DOM
-
2026-06-08days on market $325,000 Active 3 DOM
-
2026-06-07remarks 699-char remark
-
2026-06-07$325,000 Active 2 DOM
ⓘ Source: listings_history table (triggers on properties + properties_extension) + one-shot
backfill from property_details.listing_events for pre-trigger history.
Tax reassessment forecast TX · Resets to sale price
- Current annual tax
- $6,813 · $568/mo
- Projected year-2 tax
- $6,813 · $568/mo
- Expected delta
- $0/yr ($0/mo · 0.0%)
ⓘ Screening estimate from a state-policy table — verify with the county assessor before closing.
Climate risk First Street
- Flood 1/10 Low FEMA zone X (unshaded) · 0% chance over 30 yrs
- Wildfire 4/10 Moderate
- Heat 8/10 Severe 7 d/yr ≥109°F today · 24 d/yr by 30 yrs out
- Wind 4/10 Moderate 21% chance of damaging wind over 30 yrs
- Air quality 2/10 Low 2 unhealthy d/yr today · 2 by 30 yrs out
Nearby sold comps map
Loading sold comps map…
Walkable amenities ~0.75 mi
Loading nearby amenities…
Taxation est. · year 1
- Rental income
- $48,312
- − Mortgage interest
- −$18,205
- − Property taxes
- −$6,813
- − Insurance
- −$1,625
- − Repairs & maintenance
- −$3,865
- − Management
- −$3,865
- − HOA
- −$2,100
- − Depreciation
- −$9,455
- Taxable income
- $2,384
- Est. tax owed @ 24.0%
- −$572
- After-tax cash flow
- $6,604/yr
For passive investors: Depreciation is non-cash, so a rental often shows a tax loss while cash-flowing — sheltering income. Rental losses are passive: they offset passive income freely, and up to $25,000/yr can offset ordinary (W-2) income if you actively participate and your MAGI is under $100k (phasing out to $0 by $150k); unused losses carry forward. On sale, claimed depreciation is recaptured at up to 25%, and gains may owe capital-gains tax (a 1031 exchange can defer both). Figures are a year-1 estimate at your 24.0% rate — not tax advice; consult a CPA.
Condition & rehab AI · 6 photos
This multi-family property is in good condition with a fresh exterior paint job and modern interior. It is move-in ready and would benefit from minor exterior and landscaping improvements to further enhance its value.
Value-add opportunities
- Both Painting the exterior and interior walls — Fresh paint enhances the curb appeal and interior aesthetics, making the home more attractive to potential buyers and renters.
- Both Landscaping improvements — Enhancing the landscaping can improve the home's curb appeal and increase its value.
Renovation cost estimate screening
Value-add ROI direction
- Both Painting the exterior and interior walls — Fresh paint enhances the curb appeal and interior aesthetics, making the home more attractive to potential buyers and renters. ↑
- Both Landscaping improvements — Enhancing the landscaping can improve the home's curb appeal and increase its value. ↑
ⓘ Cost ranges are severity-bucket heuristics (US national rule-of-thumb). Get contractor quotes + a written scope before underwriting a rehab budget.
Schools (NCES district)
- District
- Eagle Mt-Saginaw ISD
- NCES district ID
- 4817700
- Math proficiency
- 35% ▼ -16.00%
- Reading proficiency
- 42% ▼ -9.00%
- Median HH income
- $72,781
- Composite
- 35.41/100
- National rank
- #4945
- State rank
- #361 of 826 in TX
Livability — Fort Worth
- Score
- 80/100
- State rank
- #49
- US rank
- #1954
Category grades
Schools grade is shown separately in the Schools card above.
Census & demographics
- Census place
- Fort Worth, TX
- County
- Tarrant County · 2,033,669 people
- City population
- 911,619
- Metro
- Dallas-Fort Worth-Arlington, TX
- Population (ZIP)
- 80,090
- Household income
- $107,428
- Rent vs Own
- Severe rent burden
- 1494.0
Population outlook (Tarrant County) Hauer SSP2
- Today (2025)
- 2,380,417 people
- By 2030
- 2,578,900 · +8.3%
- By 2040
- 2,974,995 · +25.0%
- By 2050
- 3,350,489 · +40.8%
- By 2075
- 4,216,909 · +77.2%
- By 2100
- 4,741,527 · +99.2%
Race, ethnicity, and origin ACS 2023
- Neighborhood character
- Diverse neighborhood (Simpson 0.63)
- Race & ethnicity
- White 53% Hispanic / Latino 28% Two or more races 14% Black 12% Asian 4%
- Hispanic origin (detail)
- Mexican 22% Puerto Rican 2%
- Common ancestry
- Slovak 2% Lithuanian 2% Italian 1%
- Foreign-born
- 8% · Canada, Jamaica
- Languages at home
- 81% English-only · Spanish 15% Other Asian/Pacific 2% Other Indo-European 1%
Political lean MEDSL · Tarrant
- 2024 margin
- Lean R (+5.1) · D 46.7% · R 51.9% · Other 1.4%
- 2008→2024 swing
- +6.6pp toward D · 2008: -11.7pp · 2024: -5.1pp
- All cycles
- 2024: R+5.1 2020: D+0.2 2016: R+8.7 2012: R+15.7 2008: R+11.7
Not yet ingested
- Civics
- —
Market trends
- HPI YoY
- ▼ -137.12%
- Current HPI
- 237.6676
- Rent YoY
- ▲ 1.51%
- Metro
- Dallas-Fort Worth-Arlington, TX
- State GDP YoY
- ▲ 3.95%
- F500 in state
- 110
Industry mix (Fortune 500 HQ in TX)
| Industry | F500 HQs | Revenue |
|---|---|---|
| Energy | 16 | $1,198B |
|
||
| Technology | 5 | $198B |
|
||
| Engineering / Construction | 4 | $72B |
|
||
| Energy Services | 3 | $60B |
|
||
| Utilities | 3 | $41B |
|
||
| Healthcare | 2 | $330B |
|
||
Price history
-14.5% since first listed11 events — show timeline
- 2026-06-03 Listed $325,000 NTREIS
- 2025-05-01 Rental Removed $2,400 NTREIS
- 2025-03-29 Price Changed $2,400 NTREIS
- 2025-03-27 Sold (Public Records) — Public Records
- 2025-02-22 Price Changed $2,500 NTREIS
- 2025-02-19 Listed for Rent $2,700 NTREIS
- 2025-02-13 Sold (Public Records) — Public Records
- 2024-11-16 Price Changed $359,900 NTREIS
- 2024-10-06 Price Changed $384,900 NTREIS
- 2024-05-17 Price Changed $379,000 NTREIS
- 2024-05-03 Listed $379,905 NTREIS
Property tax history
+67.7%/yrLatest (2025): $6,813 · +434.7% YoY. Source: county tax records.
Cash-flow waterfall
monthlySold comps — $/sqft
last 12 mo · ≤1 miLoading sold comps…