1015 Aldrich St #97 · Augusta-Richmond County consolidated government (balance), GA
Flood risk No data
- FEMA flood zone
- —
- Chance of flooding over 30 yrs
- —
- Est. flood insurance / yr
- —
Fire risk No data
- Est. fire insurance / yr
- —
Heat risk No data
- Hot days now (above threshold)
- —
- Hot days in 30 yrs
- —
Wind risk No data
- Chance of severe wind over 30 yrs
- —
Air-quality risk No data
- Unhealthy air days now
- —
- Unhealthy air days in 30 yrs
- —
Risk factors via First Street. Map © Google.
Why this score? — see what drove the D grade
The composite is a weighted blend of 9 inputs, each scored 0–100. Each bar is that input's sub-score; the figure is the points it added to the 100-point composite (weight × sub-score).
- Cash flow +13.8/30.0
- ARV discount +9.5/15.0
- Condition / age +4.8/5.0
- DSCR +4.2/10.0
- 1% rule +3.9/10.0
- Livability +2.5/5.0
- Rent growth +2.3/5.0
- Schools +1.3/10.0
- Appreciation +0.0/10.0
$208,870
🖨 Deal sheet 📄 Offer letter ✓ Due diligence
Listing remarks
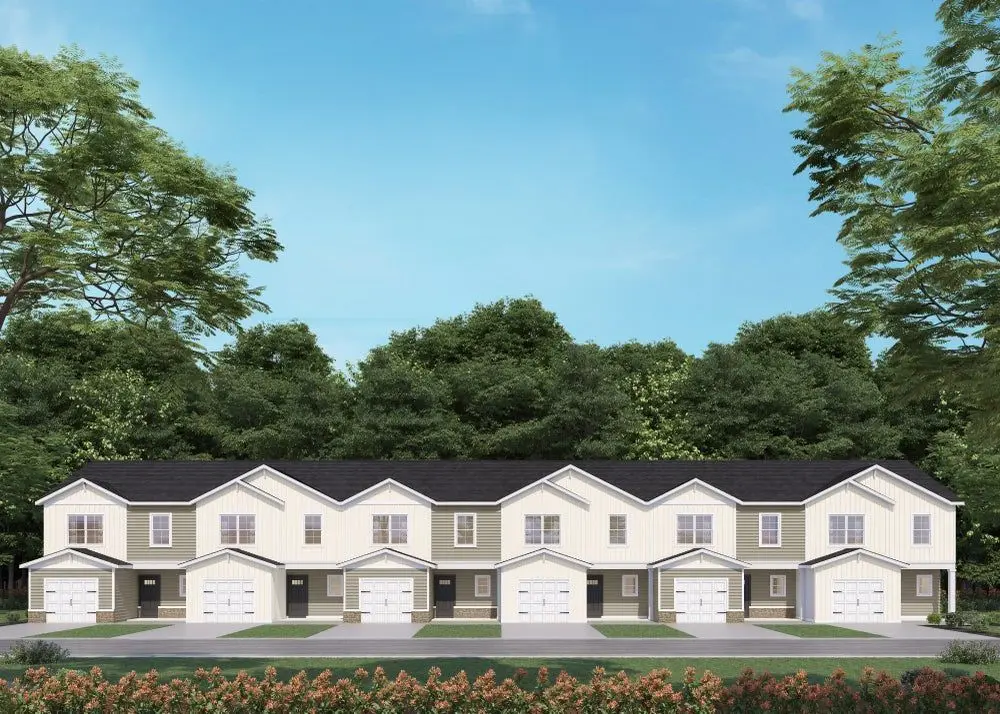
The Balsa features an open, well-organized layout designed to support everyday living. From the front porch, the foyer leads past a conveniently placed powder room and into the main living space, where the kitchen, dining area, and family room connect seamlessly. The kitchen is centered around an island with corner pantry storage and clear sightlines into the living area, while the rear patio provides an easy outdoor extension just off the dining space. This floor plan offers 1,720 square feet, 3 bedrooms, and 2.5 bathrooms. Upstairs, the owner's suite is located at the rear of the home and includes a spacious walk-in closet and private bathroom with a double vanity and additional storage.
Key facts
- Garage
- Built 2026
- Listed 27 days
Property features AI
Finance
- Other: Address: 1015 Aldrich St #97, Hephzibah, GA 30815
- Financial info: List price: $208,870
Exterior
- Parking: 1 garage space (1 total parking space)
- Home design: Spec new construction — Balsa 25 plan; Single-level listing status: Active
Interior
- Bedrooms: 3 bedrooms
- Bathrooms: 2 full bathrooms and 1 half bathroom
- Interior features: Open living area (1,720 finished area)
Neighborhood map
What this means for you Summary
Snapshot
- This is a 3-bed/2.5-bath townhouse listed at $209k. Condition is rated excellent.
Deal economics
- At list price, monthly cash flow is $20 ($238/yr) — positive.
- The deal already cash-flows at list — no discount required.
- To meet the 1% rule (rent ≥ 1% of price), the offer needs to be $185k (11.3% below list).
- Recommended offer: $185k (11.3% below list) — sets the bar for 1% rule.
- Cap rate 6.4% vs local median 5.3% in Augusta-Richmond County consolidated government (balance) — meaningfully above typical; check what's discounted (condition, days-on-market, listing class) to confirm the premium yield is real.
Location & tenants
- Location reads: area grade D — affects rentability + tenant quality, not the cash-flow math above.
- Richmond County (urban): math 12% / reading 20% proficiency, ranked #154 of 174 in GA (top 88%) — low school quality limits family demand, transient renter base, plan for 1-2y turnover; 72% free/reduced lunch — lower-income household profile, screen leases tightly.
- Market conditions: Rents soft (-0.7%/yr); 359 active listings in the ZIP; 3 comparable units currently listed for rent nearby; rentals lingering (median 44d on market — plan ~5-8 weeks vacancy on turnover, expect pricing pressure); 67% of comp listings sitting > 30 days — soft ceiling on asking rent; 561 units permitted in Richmond County in 2024 (0 in 5+ unit buildings).
- This rent runs 32% of the median local income ($70k/yr) — at the standard rent-burdened threshold; future hikes will face affordability resistance.
Forward outlook
- Local home prices are declining (-3.0%/yr); year-one equity from $1k of loan paydown is wiped out by about $6k of value loss. Plan a longer hold.
- Richmond County population projected to shrink 5% by 2050 — rents likely to lag national; underwrite the cash flow, not the appreciation.
Negotiation context
- It's been on market 27 days — a 2% lower offer ($206k) is reasonable based on typical stale-listing flexibility.
Questions for the listing agent
- Is there a deadline driving the sale (1031 exchange, divorce, estate, relocation)? That informs how much negotiation room exists.
- The area grade is low — what's the realistic commute time and amenity access for the typical tenant pool here? Any planned neighborhood developments (good or bad) we should know about?
- What's the average days-on-market for RENTAL listings here right now (not sales)? A rising rental-DOM trend means longer vacancies and softer asking-rent achievability than the comps imply.
- What's the recent tenant-quality profile in this submarket — average credit score on applications, eviction rate, late-payment / NSF rate, and stable-employment percentage? A property-management company in the area should have these aggregated.
- How much new for-sale + rental construction is in the pipeline within 1–3 miles? Heavy new supply typically softens prices + rents 12–24 months out; constrained supply supports both.
Investment metrics
- 1% rule
- 0.89% ✗
- Cap rate
- 6.41%
- Cash-on-cash
- 0.41%
- DSCR
- 1.02
- GRM
- 9.4
CMA / ARV
- ARV (on-the-fly)
- $218,440
- Comps found
- 9
Show comp detail 9 sales within ~0.75 mi
| Address | Dist | Beds/Ba | Sqft | Sold | Price | $/sf | Match |
|---|---|---|---|---|---|---|---|
| 1012 Aldrich St | 0.05mi | 3/2.5 | 1,720 (0%) | 3mo | $209,490 | $122 | 95 |
| 1005 Aldrich St | 0.06mi | 3/2.5 | 1,720 (0%) | 3mo | $209,490 | $122 | 95 |
| 1011 Aldrich St | 0.08mi | 3/2.5 | 1,720 (0%) | 2mo | $212,290 | $123 | 95 |
| 1022 Aldrich | 0.07mi | 3/2.5 | 1,720 (0%) | 6mo | $215,342 | $125 | 91 |
| 1014 Aldrich St | 0.06mi | 3/2.5 | 1,720 (0%) | 9mo | $217,790 | $127 | 90 |
| 1024 Aldrich St | 0.08mi | 3/2.5 | 1,720 (0%) | 8mo | $218,000 | $127 | 90 |
| 1007 Aldrich St | 0.08mi | 3/2.5 | 1,720 (0%) | 8mo | $217,790 | $127 | 89 |
| 1008 Aldrich St | 0.09mi | 3/2.5 | 1,720 (0%) | 9mo | $217,790 | $127 | 88 |
| 1020 Aldrich St | 0.16mi | 3/2.5 | 1,720 (0%) | 6mo | $218,000 | $127 | 88 |
Match score weights: distance 35% · size 25% · config 20% · recency 20%. Top-matched comps best support the ARV.
Projected returns pro-forma
-3.0% appreciation · 0.0% rent growth · sell at horizon
- IRR
- -19.1%
- Equity multiple
- 0.35×
- Total profit
- $-37,982
- Equity at exit
- $31,143
- IRR
- -19.4%
- Equity multiple
- 0.11×
- Total profit
- $-52,311
- Equity at exit
- $18,059
Cash invested: $58,484 (down + closing). Projections, not guarantees.
Landlord ↔ Tenant lean methodology
- Overall (STATE)
- 90 Strongly Landlord-Friendly
- State Georgia
- 90 Strongly Landlord-Friendly · R+3
- County
- — inherits STATE
- City
- — inherits STATE
ZIP-level market 30815
- Home prices YoY
- -24.2%
- Rents YoY
- -0.7%
- Active inventory
- 359
- Price-to-rent
- 9.4×
Monthly cashflow live
- Estimated rent
- $1,852 medium interval (Pro) →
- Mortgage (P&I)
- −$1,095
- Tax est. 1.5%
- −$261 /mo · $3,133/yr
- Insurance
- −$87
- HOA
- −$0
- Vacancy / Maint / Mgmt
- −$389
- Net cashflow
- $20
Break-even live
UW: 25.0% down · 7.5% · 30yr · 1.5% tax · 5.0% vac · 8.0% maint · 8.0% mgmt
Financing live
Cash to close
- Down payment
- $52,218
- Closing costs
- $6,266
- Reserves months
- —
- Total cash needed
- —
Loan-product check · same deal, 3 products live
Conventional
25% down · 7.5% · 30yr
- Down + closing
- —
- Monthly P&I
- —
- Monthly cashflow
- —
- DSCR
- —
- Eligible?
- —
Personal DTI + credit; lowest rate.
DSCR
20% down · 8.5% · 30yr
- Down + closing
- —
- Monthly P&I
- —
- Monthly cashflow
- —
- DSCR
- —
- Eligible?
- —
No personal income docs; deal must DSCR.
Hard money
10% down · 12.0% · 12mo
- Down + closing
- —
- Monthly P&I
- —
- Monthly cashflow
- —
- DSCR
- —
- Eligible?
- —
Short-term bridge; refi at stabilization.
Rent comps 3 comps
| Address | Beds | Baths | Sqft | Rent | $/sqft | DOM | Units | Dist |
|---|---|---|---|---|---|---|---|---|
| 4438 Windsor Spring Rd Hephzibah, GA | 4.0 | 2.0 | 1653 | $1,900 | $1.15 | 43d | 1 | 0.40mi |
| 4235 Cap Chat St Hephzibah, GA | 3.0 | 2.0 | 1300 | $1,651 | $1.27 | 43d | 1 | 1.44mi |
| 2302 Woodsman Dr Augusta, GA | 3.0 | 2.0 | 1436 | $1,475 | $1.03 | 23d | 1 | 1.47mi |
Listing history 6 events
-
2026-06-18days on market $208,870 Active 27 DOM
-
2026-06-17days on market $208,870 Active 26 DOM
-
2026-06-16days on market $208,870 Active 25 DOM
-
2026-06-15days on market $208,870 Active 24 DOM
-
2026-06-14remarks 699-char remark
-
2026-06-14$208,870 Active 22 DOM
ⓘ Source: listings_history table (triggers on properties + properties_extension) + one-shot
backfill from property_details.listing_events for pre-trigger history.
Nearby sold comps map
Loading sold comps map…
Walkable amenities ~0.75 mi
Loading nearby amenities…
Taxation est. · year 1
- Rental income
- $22,227
- − Mortgage interest
- −$11,700
- − Property taxes
- −$3,133
- − Insurance
- −$1,044
- − Repairs & maintenance
- −$1,778
- − Management
- −$1,778
- − Depreciation
- −$6,076
- Taxable loss
- −$3,283
- Est. tax savings @ 24.0%
- +$788
- After-tax cash flow
- $1,026/yr
For passive investors: Depreciation is non-cash, so a rental often shows a tax loss while cash-flowing — sheltering income. Rental losses are passive: they offset passive income freely, and up to $25,000/yr can offset ordinary (W-2) income if you actively participate and your MAGI is under $100k (phasing out to $0 by $150k); unused losses carry forward. On sale, claimed depreciation is recaptured at up to 25%, and gains may owe capital-gains tax (a 1031 exchange can defer both). Figures are a year-1 estimate at your 24.0% rate — not tax advice; consult a CPA.
Condition & rehab AI · 13 photos
This townhouse is in excellent condition with no major repairs needed. It offers a well-maintained interior and exterior, making it a great investment for both resale and rental.
Value-add opportunities
- Both Painting the exterior — Enhances curb appeal and value
- Both Landscaping the front yard — Improves curb appeal and rental value
- Resale Updating the kitchen backsplash — Modernizes the kitchen and adds value
Renovation cost estimate screening
Value-add ROI direction
- Both Painting the exterior — Enhances curb appeal and value ↑
- Both Landscaping the front yard — Improves curb appeal and rental value ↑
- Resale Updating the kitchen backsplash — Modernizes the kitchen and adds value ↑
ⓘ Cost ranges are severity-bucket heuristics (US national rule-of-thumb). Get contractor quotes + a written scope before underwriting a rehab budget.
Schools (NCES district)
- District
- Richmond County
- NCES district ID
- 1304380
- Math proficiency
- 12% ▼ -9.00%
- Reading proficiency
- 20% ▼ -6.00%
- Median HH income
- $38,069
- Composite
- 13.43/100
- National rank
- #9524
- State rank
- #154 of 174 in GA
Livability — Augusta-Richmond County consolidated government (balance)
No livability data for this city. (Only ~50 U.S. cities are tracked.)
Census & demographics
- Census place
- Augusta-Richmond County consolidated government (balance), GA
- County
- Richmond County · 190,917 people
- City population
- 154,035
- Metro
- Augusta-Richmond County, GA-SC
- Population (ZIP)
- 44,109
- Household income
- $70,202
- Rent vs Own
- Severe rent burden
- 867.0
Population outlook (Richmond County) Hauer SSP2
- Today (2025)
- 200,753 people
- By 2030
- 200,232 · -0.3%
- By 2040
- 196,813 · -2.0%
- By 2050
- 190,347 · -5.2%
- By 2075
- 172,496 · -14.1%
- By 2100
- 146,284 · -27.1%
Race, ethnicity, and origin ACS 2023
- Neighborhood character
- Majority Black (62%)
- Race & ethnicity
- Black 62% White 27% Two or more races 5% Hispanic / Latino 4%
- Foreign-born
- 4% · Canada, South Korea
- Languages at home
- 93% English-only · Spanish 3% Other Indo-European 1% Korean 1%
Political lean MEDSL · Richmond
- 2024 margin
- Solid D (+36.1) · D 67.8% · R 31.7%
- 2008→2024 swing
- +4.3pp toward D · 2008: 31.8pp · 2024: 36.1pp
- All cycles
- 2024: D+36.1 2020: D+37.2 2016: D+32.4 2012: D+33.8 2008: D+31.8
Not yet ingested
- Civics
- —
Market trends
- HPI YoY
- ▼ -51.74%
- Current HPI
- 162.4074
- Rent YoY
- ▼ -0.71%
- Metro
- Augusta-Richmond County, GA-SC
- State GDP YoY
- ▲ 2.66%
- F500 in state
- 28
Industry mix (Fortune 500 HQ in GA)
| Industry | F500 HQs | Revenue |
|---|---|---|
| Paper / Packaging | 2 | $29B |
|
||
| Retail | 1 | $160B |
|
||
| Transportation / Logistics | 1 | $91B |
|
||
| Airlines | 1 | $62B |
|
||
| Consumer Goods | 1 | $47B |
|
||
| Utilities | 1 | $25B |
|
||
Cash-flow waterfall
monthlySold comps — $/sqft
last 12 mo · ≤1 miLoading sold comps…