 Fourplex
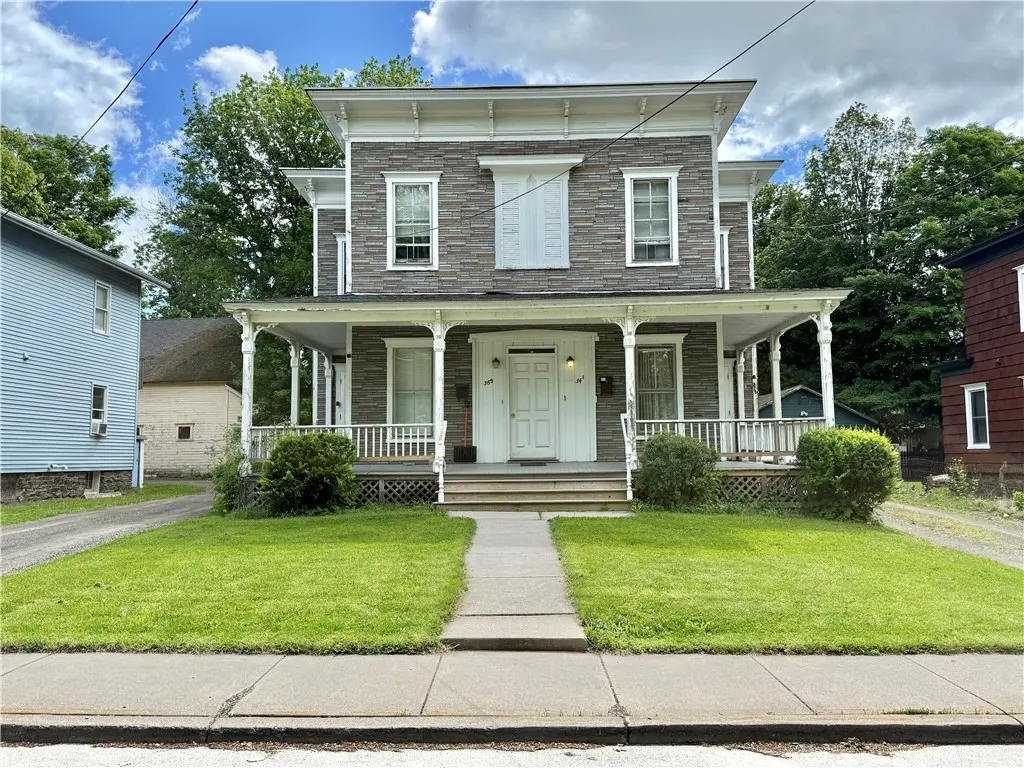
34-36 Cliff St · Oneonta, NY
Flood risk 1/10 · Minimal
- FEMA flood zone
- X (unshaded)
- Chance of flooding over 30 yrs
- 0.0%
- Est. flood insurance / yr
- $473 – $860
Fire risk 1/10 · Minimal
- Est. fire insurance / yr
- $691 – $1,283
Heat risk 2/10 · Minimal
- Hot days now (above 93°F)
- 8 days/yr
- Hot days in 30 yrs
- 18 days/yr
Wind risk 2/10 · Minimal
- Chance of severe wind over 30 yrs
- 1.0%
Air-quality risk 1/10 · Minimal
- Unhealthy air days now
- 0 days/yr
- Unhealthy air days in 30 yrs
- 0 days/yr
Risk factors via First Street. Map © Google.
Why this score? — see what drove the A- grade
The composite is a weighted blend of 9 inputs, each scored 0–100. Each bar is that input's sub-score; the figure is the points it added to the 100-point composite (weight × sub-score).
- Cash flow +30.0/30.0
- 1% rule +10.0/10.0
- DSCR +10.0/10.0
- Appreciation +10.0/10.0
- ARV discount +7.5/15.0
- Schools +4.3/10.0
- Livability +3.8/5.0
- Rent growth +2.5/5.0
- Condition / age +2.2/5.0
$259,900
🖨 Deal sheet (PDF) 📄 Offer letter ✓ Due diligence
Multi-family units
County records classify this as Multi-Family (2-4 Unit). Listing-text estimate: 4 units. confirmed
Listing remarks
Charming 4 unit investment property located 3 blocks to downtown! Classic front porch lines offer nice curb appeal. Plenty of off-street parking. Tenants pay all utilities. Solid cash flow flow opportunity. Double digit Return on Investment! Super opportunity. May be purchased with 4 family next door- 38-40 Cliff Street, a 10 bedroom fully occupied building. See MLS #R1687928. 34-36 Cliff St: Total rents: $37,200 annually. Expenses: Taxes $4,596, Water/Sewer $700, Insurance $1,700, Trash $1,200, snow $375, Maintenance and Vacancy at 5% of gross $2,600. Total expenses $11,171. NOI $26,029. Mortgage cost $18,600 ($259,900, 20% down. 20 year amort, 6.25%), Net Income $7,429 / $51,980 (d
Key facts
- 7,840 sq ft lot
- Parking
- Built 1900
Property features AI
Finance
- Other: Owner pays grounds care, snow removal, trash collection, and water; Tenants pay all utilities; Rent includes common area maintenance, gardener, snow removal, trash collection, and water
- Financial info: Gross income: $37,200 (multi-family); Operating expenses: $11,121; Operating expenses include insurance, maintenance (structure and general), snow removal, trash, water/sewer, and other items noted in remarks
Exterior
- Parking: Common gravel parking available
- Utilities: Public water connected; Sewer connected; Cable available; High-speed internet available
- Home design: 2-story multi-family residence; Residential multi-use zoning; Rectangular lot near public transit, city street frontage
- Construction: Frame construction; Flat rolled/hot mop roof; Stone foundation; Existing (established) building
- Exterior features: Covered porch
Interior
- Kitchen: Electric water heater
- Bedrooms: Total of 4 units (multi-family property)
- Flooring: Carpet; Vinyl; Varies by unit
- Bathrooms: Four full bathrooms (across the building)
- Heating & cooling: Gas forced air heating
- Interior features: Carpet and vinyl flooring in varying areas; Full, partially finished basement
- Laundry & utility: Common area laundry
Neighborhood map
What this means for you Summary
Snapshot
- This is a 4 × 4-bed/4.0-bath units multifamily listed at $260k. Condition is rated fair.
Deal economics
- At list price, monthly cash flow is $3k ($41k/yr) — positive. Per door: $846/mo.
- The deal already cash-flows at list — no discount required.
- Meets the 1% rule at list price ($7k rent vs $260k).
- Recommended offer: $256k (1.5% below list) — sets the bar for market timing.
- Cap rate 21.9% vs local median 5.5% in Oneonta — top-decile yield for the area; either an underpriced asset or a hidden risk that comps aren't pricing in. Stress-test before assuming the spread holds.
Location & tenants
- Location reads 75/100 on livability (#253 in NY, #4,021 nationally) — a middle-class / working-renter tenant base. Strengths: housing A+, health & safety A+, cost of living B+; Watch: amenities C-, crime F, commute F.
- Oneonta City School District (town): math 46% / reading 57% proficiency, ranked #374 of 590 in NY (top 63%) — acceptable for families but not a draw, mixed tenant base, ~2y average lease.
- Zoned schools: Greater Plains Elementary School (math 37% / reading 57%, grade D-, #1,195 of 2,108 statewide, top 60%, 284 students, 40% FRL); Oneonta Middle School (math 28% / reading 56%, grade D-, #379 of 729 statewide, top 54%, 378 students, 44% FRL); Oneonta Senior High School (math 92% / reading 75%, grade A, #409 of 1,100 statewide, top 39%, 502 students, 37% FRL).
- Market conditions: 119 active listings in the ZIP; 133 units permitted in Otsego County in 2024 (10 in 5+ unit buildings).
- At $6,559/mo this rent would consume 119% of the median local household income ($66k/yr) (locally 662% of renters already pay >50% of income on rent) — very limited rent-growth headroom before tenants either downsize or default.
Forward outlook
- In year one you build about $28k of equity ($2k loan paydown + $26k appreciation (10.0% local appreciation)).
- Otsego County population projected at -21% by 2050 — secular population decline; favor cash flow + early exit over multi-decade hold.
- At projected returns (10.0% appreciation + 3.0% rent growth), your $73k cash investment doubles in ~2 years — after that, you're playing with house money.
- By year 2, paydown + projected appreciation supports a ~$45k cash-out refi (75% LTV) — recoverable capital for the next deal without selling this one.
Negotiation context
- It's been on market 17 days — a 2% lower offer ($256k) is reasonable based on typical stale-listing flexibility.
Risks & watch-outs
- Watch-outs: built in 1900 — expect roof / HVAC / electrical / plumbing capex.
Questions for the listing agent
- Can we see the unit-by-unit rent roll, current vacancy, and any below-market leases? What's the average tenancy length?
- What capital expenditures (roof, boiler, parking lot, exteriors) have been made in the last 5 years, and what's planned in the next 2?
- Have any recent inspections been done? Can we get a copy of the seller's disclosures and any deferred-maintenance estimates?
- Built in 1900 — when were the roof, HVAC, electrical panel, plumbing, and water heater last replaced?
- Is there a deadline driving the sale (1031 exchange, divorce, estate, relocation)? That informs how much negotiation room exists.
- Crime grade is F in this area — have there been break-ins, vandalism, or insurance claims at this property in the last 3 years? What carrier currently insures it and at what premium?
- What's the average days-on-market for RENTAL listings here right now (not sales)? A rising rental-DOM trend means longer vacancies and softer asking-rent achievability than the comps imply.
- What's the recent tenant-quality profile in this submarket — average credit score on applications, eviction rate, late-payment / NSF rate, and stable-employment percentage? A property-management company in the area should have these aggregated.
- How much new apartment / multifamily construction is in the pipeline within 1–3 miles? Heavy new supply (>2% of stock underway) typically softens rents 12–24 months out; light construction supports rent growth.
Investment metrics
- 1% rule
- 2.52% ✓
- Cap rate
- 21.92%
- Cash-on-cash
- 55.83%
- DSCR
- 3.48
- GRM
- 3.3
CMA / ARV
No comps found within radius.
Projected returns pro-forma
10.0% appreciation · 3.0% rent growth · sell at horizon
- IRR
- 68.6%
- Equity multiple
- 5.91×
- Total profit
- $357,272
- Equity at exit
- $234,139
- IRR
- 62.3%
- Equity multiple
- 13.13×
- Total profit
- $882,737
- Equity at exit
- $504,929
Cash invested: $72,772 (down + closing). Projections, not guarantees.
Landlord ↔ Tenant lean methodology
- Overall (STATE)
- 15 Strongly Tenant-Friendly
- State New York
- 15 Strongly Tenant-Friendly · D+10
- County
- — inherits STATE
- City
- — inherits STATE
ZIP-level market 13820
- Home prices YoY
- 22.7%
- Active inventory
- 119
- Price-to-rent
- 13.2×
Monthly cashflow live
- Estimated rent
- $6,559 medium interval (Pro) →
- Mortgage (P&I)
- −$1,363
- Tax est. 1.5%
- −$325 /mo · $3,898/yr
- Insurance
- −$108
- HOA
- −$0
- Vacancy / Maint / Mgmt
- −$1,377
- Net cashflow
- $3,385
Break-even live
Sensitivity live
| Price | -10% $3,565 | -5% $3,475 | +0% $3,385 | +5% $3,296 | +10% $3,206 |
|---|---|---|---|---|---|
| Rent | -10% $2,867 | -5% $3,126 | +0% $3,385 | +5% $3,645 | +10% $3,904 |
| Rate | -1.0pp $3,516 | -0.5pp $3,452 | base $3,385 | +0.5pp $3,318 | +1.0pp $3,250 |
4-unit breakdown (identical units grouped — click to expand)
| Units | Beds | Baths | Est. rent |
|---|---|---|---|
| 4× units | 4 | 4 | $6,560 |
| #1 | 4 | 4 | $1,640 |
| #2 | 4 | 4 | $1,640 |
| #3 | 4 | 4 | $1,640 |
| #4 | 4 | 4 | $1,640 |
| Total (4 units) | $6,559 | ||
UW: 25.0% down · 7.5% · 30yr · 1.5% tax · 5.0% vac · 8.0% maint · 8.0% mgmt
Financing live
Cash to close
- Down payment
- $64,975
- Closing costs
- $7,797
- Reserves months
- —
- Total cash needed
- —
Loan-product check · same deal, 3 products live
Conventional
25% down · 7.5% · 30yr
- Down + closing
- —
- Monthly P&I
- —
- Monthly cashflow
- —
- DSCR
- —
- Eligible?
- —
Personal DTI + credit; lowest rate.
DSCR
20% down · 8.5% · 30yr
- Down + closing
- —
- Monthly P&I
- —
- Monthly cashflow
- —
- DSCR
- —
- Eligible?
- —
No personal income docs; deal must DSCR.
Hard money
10% down · 12.0% · 12mo
- Down + closing
- —
- Monthly P&I
- —
- Monthly cashflow
- —
- DSCR
- —
- Eligible?
- —
Short-term bridge; refi at stabilization.
Listing history 13 events
-
2026-06-21days on market $259,900 Active 17 DOM
-
2026-06-19days on market $259,900 Active 15 DOM
-
2026-06-18days on market $259,900 Active 14 DOM
-
2026-06-17days on market $259,900 Active 13 DOM
-
2026-06-16days on market $259,900 Active 12 DOM
-
2026-06-15days on market $259,900 Active 11 DOM
-
2026-06-14days on market $259,900 Active 9 DOM
-
2026-06-12days on market $259,900 Active 8 DOM
-
2026-06-09days on market $259,900 Active 5 DOM
-
2026-06-08days on market $259,900 Active 4 DOM
-
2026-06-07days on market $259,900 Active 3 DOM
-
2026-06-07remarks 699-char remark
-
2026-06-07$259,900 Active 2 DOM
ⓘ Source: listings_history table (triggers on properties + properties_extension) + one-shot
backfill from property_details.listing_events for pre-trigger history.
Climate risk First Street
- Flood 1/10 Low FEMA zone X (unshaded) · 0% chance over 30 yrs
- Wildfire 1/10 Low
- Heat 2/10 Low 8 d/yr ≥93°F today · 18 d/yr by 30 yrs out
- Wind 2/10 Low 100% chance of damaging wind over 30 yrs
- Air quality 1/10 Low 0 unhealthy d/yr today · 0 by 30 yrs out
Nearby sold comps map
Loading sold comps map…
Walkable amenities ~0.75 mi
Loading nearby amenities…
Taxation est. · year 1
- Rental income
- $78,708
- − Mortgage interest
- −$14,558
- − Property taxes
- −$3,898
- − Insurance
- −$1,300
- − Repairs & maintenance
- −$6,297
- − Management
- −$6,297
- − Depreciation
- −$7,561
- Taxable income
- $38,798
- Est. tax owed @ 24.0%
- −$9,311
- After-tax cash flow
- $31,315/yr
For passive investors: Depreciation is non-cash, so a rental often shows a tax loss while cash-flowing — sheltering income. Rental losses are passive: they offset passive income freely, and up to $25,000/yr can offset ordinary (W-2) income if you actively participate and your MAGI is under $100k (phasing out to $0 by $150k); unused losses carry forward. On sale, claimed depreciation is recaptured at up to 25%, and gains may owe capital-gains tax (a 1031 exchange can defer both). Figures are a year-1 estimate at your 24.0% rate — not tax advice; consult a CPA.
Condition & rehab AI · 13 photos
This multi-family property requires significant repairs and maintenance, including repainting, replacing the HVAC system, and repairing the roof and siding. The property has a fair condition score and is in need of extensive renovations to improve its value.
Repairs flagged
- Major roof — Significant damage is visible on the roof, indicating a major repair is needed.
- Major siding — The siding is peeling and in need of repainting, indicating a major repair is needed.
- Major exterior walls — The exterior walls appear to be in poor condition, with visible signs of wear and tear.
- Major windows — The windows appear to be in poor condition, with some showing signs of damage.
- Major HVAC system — The HVAC system appears to be in poor condition, with visible signs of wear and tear.
Value-add opportunities
- Both repainting the exterior and interior walls — Repainting the exterior and interior walls can significantly improve the curb appeal and interior condition, making the property more attractive to potential buyers or renters.
- Both replacing the HVAC system — Replacing the HVAC system can improve the comfort and energy efficiency of the property, making it more attractive to potential buyers or renters.
- Both repairing the roof and siding — Repairing the roof and siding can improve the structural integrity and curb appeal of the property, making it more attractive to potential buyers or renters.
Renovation cost estimate screening
| Repair item | Severity | Est. cost |
|---|---|---|
| roof · Significant damage is visible on the roof, indicating a major repair is needed. | Major | $15,000–50,000 |
| siding · The siding is peeling and in need of repainting, indicating a major repair is needed. | Major | $15,000–50,000 |
| exterior walls · The exterior walls appear to be in poor condition, with visible signs of wear and tear. | Major | $15,000–50,000 |
| windows · The windows appear to be in poor condition, with some showing signs of damage. | Major | $15,000–50,000 |
| HVAC system · The HVAC system appears to be in poor condition, with visible signs of wear and tear. | Major | $15,000–50,000 |
| Total estimated repair cost · 5 items | $75,000–250,000 |
Value-add ROI direction
- Both repainting the exterior and interior walls — Repainting the exterior and interior walls can significantly improve the curb appeal and interior condition, making the property more attractive to potential buyers or renters. ↑
- Both replacing the HVAC system — Replacing the HVAC system can improve the comfort and energy efficiency of the property, making it more attractive to potential buyers or renters. ↑
- Both repairing the roof and siding — Repairing the roof and siding can improve the structural integrity and curb appeal of the property, making it more attractive to potential buyers or renters. ↑
ⓘ Cost ranges are severity-bucket heuristics (US national rule-of-thumb). Get contractor quotes + a written scope before underwriting a rehab budget.
Schools (NCES district)
- District
- Oneonta City School District
- NCES district ID
- 3621780
- Math proficiency
- 46% ▼ -2.00%
- Reading proficiency
- 57% ▲ 14.00%
- Median HH income
- $41,631
- Composite
- 43.19/100
- National rank
- #3066
- State rank
- #374 of 590 in NY
Livability — Oneonta
- Score
- 75/100
- State rank
- #253
- US rank
- #4021
Category grades
Schools grade is shown separately in the Schools card above.
Census & demographics
- Census place
- Oneonta, NY
- County
- Otsego County · 23,056 people
- City population
- 23,056
- Metro
- Oneonta, NY
- Population (ZIP)
- 23,056
- Household income
- $65,953
- Rent vs Own
- Severe rent burden
- 662.0
Population outlook (Otsego County) Hauer SSP2
- Today (2025)
- 57,987 people
- By 2030
- 55,403 · -4.5%
- By 2040
- 50,336 · -13.2%
- By 2050
- 45,715 · -21.2%
- By 2075
- 38,769 · -33.1%
- By 2100
- 33,468 · -42.3%
Race, ethnicity, and origin ACS 2023
- Neighborhood character
- Predominantly White (84%)
- Race & ethnicity
- White 84% Hispanic / Latino 6% Black 5% Two or more races 5% Asian 2%
- Hispanic origin (detail)
- Puerto Rican 2%
- Common ancestry
- Romanian 4% Slovak 2% Lithuanian 2%
- Foreign-born
- 5% · Canada, China
- Languages at home
- 94% English-only · Spanish 3% Russian/Polish/Slavic 1% Other Indo-European 1%
Political lean MEDSL · Otsego
- 2024 margin
- Lean R (+7.9) · D 46.1% · R 53.9%
- 2008→2024 swing
- -13.8pp toward R · 2008: 5.9pp · 2024: -7.9pp
- All cycles
- 2024: R+7.9 2020: R+5.0 2016: R+13.0 2012: D+2.0 2008: D+5.9
Not yet ingested
- Civics
- —
Market trends
- HPI YoY
- ▲ 67.86%
- Current HPI
- 366.3391
- Rent YoY
- —
- Metro
- Oneonta, NY
- State GDP YoY
- ▲ 2.60%
- F500 in state
- 92
Industry mix (Fortune 500 HQ in NY)
| Industry | F500 HQs | Revenue |
|---|---|---|
| Financial Services | 10 | $950B |
|
||
| Consumer Goods | 9 | $162B |
|
||
| Insurance | 4 | $225B |
|
||
| Telecommunications | 2 | $144B |
|
||
| Pharmaceuticals | 2 | $112B |
|
||
| Media / Entertainment | 2 | $69B |
|
||
Price history
1 event — show timeline
- 2026-06-03 Listed $259,900 UNYREIS
Cash-flow waterfall
monthlySold comps — $/sqft
last 12 mo · ≤1 miLoading sold comps…