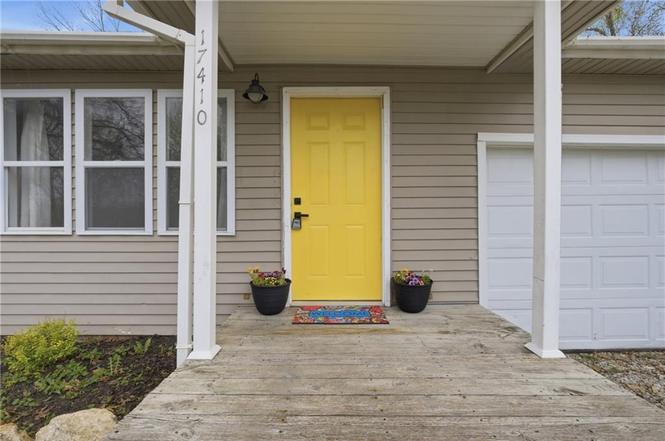
17410 Chestnut Dr · Belton, MO
Flood risk 1/10 · Minimal
- FEMA flood zone
- X (unshaded)
- Chance of flooding over 30 yrs
- 0.0%
- Est. flood insurance / yr
- $507 – $1,088
Fire risk 2/10 · Minimal
- Est. fire insurance / yr
- $1,054 – $1,958
Heat risk 4/10 · Minor
- Hot days now (above 107°F)
- 7 days/yr
- Hot days in 30 yrs
- 17 days/yr
Wind risk 2/10 · Minimal
- Chance of severe wind over 30 yrs
- —
Air-quality risk 2/10 · Minimal
- Unhealthy air days now
- 2 days/yr
- Unhealthy air days in 30 yrs
- 2 days/yr
Risk factors via First Street. Map © Google.
Why this score? — see what drove the C- grade
The composite is a weighted blend of 9 inputs, each scored 0–100. Each bar is that input's sub-score; the figure is the points it added to the 100-point composite (weight × sub-score).
- Cash flow +19.5/30.0
- ARV discount +10.1/15.0
- DSCR +6.2/10.0
- 1% rule +4.3/10.0
- Rent growth +3.8/5.0
- Livability +3.8/5.0
- Schools +3.0/10.0
- Condition / age +2.5/5.0
- Appreciation +0.0/10.0
$180,000
🖨 Deal sheet 📄 Offer letter ✓ Due diligence
Listing remarks MLS
Looking for the handy homeowner! Put in some TLC to make this 3 Bedroom, 1 Bathroom, 1 Car Garage Ranch your own. With everything all on one level makes for easy living. Make sure to check out the large yard the home sits on. Plenty of room to add a garden or hang out spot for having a BBQ. ENTERTAINING ALL OFFERS!!!
Key facts
- 0.38 acre lot
- Garage
- Built 1950
Property features AI
Finance
- Financial info: Annual tax amount listed (verify)
Exterior
- Parking: Attached garage (1 car)
- Utilities: City/public water (verify); Public sewer
- Home design: Single-family residence; Residential property; One-story (ranch style)
- Construction: Vinyl siding; Composition roof
- Exterior features: Lot approximately 16,379 square feet
Interior
- Kitchen: Kitchen (first floor)
- Bedrooms: 3 bedrooms (all on the first floor)
- Bathrooms: 1 full bathroom (on the first floor)
- Heating & cooling: Forced air heating; Electric cooling (central air present)
- Interior features: Ranch floor plan; Crawl space basement
Neighborhood map
What this means for you Summary
Snapshot
- This is a 3-bed/1.0-bath single-family listed at $180k.
Deal economics
- At list price, monthly cash flow is $206 ($2k/yr) — positive.
- The deal already cash-flows at list — no discount required.
- To meet the 1% rule (rent ≥ 1% of price), the offer needs to be $167k (7.4% below list).
- Recommended offer: $167k (7.4% below list) — sets the bar for 1% rule.
- Cap rate 7.7% vs local median 4.7% in Belton — top-decile yield for the area; either an underpriced asset or a hidden risk that comps aren't pricing in. Stress-test before assuming the spread holds.
Location & tenants
- Location reads 76/100 on livability (#52 in MO, #3,782 nationally) — a middle-class / working-renter tenant base. Strengths: cost of living A+, housing A+, health & safety A+; Watch: crime C-, schools D+, commute F.
- Belton 124 (suburban): math 28% / reading 39% proficiency, ranked #216 of 324 in MO (top 67%) — families likely to look elsewhere, expect single-tenant / working-renter base with shorter leases.
- Market conditions: Rents rising fast (+5.2%/yr); 204 active listings in the ZIP; 1 comparable units currently listed for rent nearby; 588 units permitted in Cass County in 2024 (0 in 5+ unit buildings).
Forward outlook
- Local home prices are declining (-3.0%/yr); year-one equity from $1k of loan paydown is wiped out by about $5k of value loss. Plan a longer hold.
- Cass County population projected to shrink 3% by 2050 — rents likely to lag national; underwrite the cash flow, not the appreciation.
Negotiation context
- It's been on market 43 days — a 3% lower offer ($175k) is reasonable based on typical stale-listing flexibility.
- 6 sale attempts since 23y ago; this cycle's ask has dropped $20k (10%) from the opening price — seller is motivated, your offer sets the floor, not the list.
Risks & watch-outs
- Watch-outs: built in 1950 — expect roof / HVAC / electrical / plumbing capex.
Questions for the listing agent
- It's been on market 43 days. Have you received any prior offers? Is the seller open to a 7% concession, seller financing, or rate buy-down credit?
- Built in 1950 — when were the roof, HVAC, electrical panel, plumbing, and water heater last replaced?
- Is there a deadline driving the sale (1031 exchange, divorce, estate, relocation)? That informs how much negotiation room exists.
- Schools are D-rated, which usually means shorter tenancies and higher turnover. Who's the typical renter profile here, and what's been the actual vacancy rate?
- What's the average days-on-market for RENTAL listings here right now (not sales)? A rising rental-DOM trend means longer vacancies and softer asking-rent achievability than the comps imply.
- What's the recent tenant-quality profile in this submarket — average credit score on applications, eviction rate, late-payment / NSF rate, and stable-employment percentage? A property-management company in the area should have these aggregated.
- How much new for-sale + rental construction is in the pipeline within 1–3 miles? Heavy new supply typically softens prices + rents 12–24 months out; constrained supply supports both.
Investment metrics
- 1% rule
- 0.93% ✗
- Cap rate
- 7.66%
- Cash-on-cash
- 4.90%
- DSCR
- 1.22
- GRM
- 9.0
CMA / ARV
- ARV (on-the-fly)
- $190,944
- Comps found
- 10
Show comp detail 10 sales within ~0.75 mi
| Address | Dist | Beds/Ba | Sqft | Sold | Price | $/sf | Match |
|---|---|---|---|---|---|---|---|
| 17410 Chestnut Dr | 0.00mi | 3/1.0 | 864 (0%) | 0mo | $180,000 | $208 | 100 |
| 17249 Chestnut N/A | 0.11mi | 4/1.0 (+1) | 912 (+6%) | 7mo | $180,000 | $197 | 75 |
| 17243 Montgall Dr | 0.15mi | 3/1.5 | 900 (+4%) | 14mo | $215,000 | $239 | 73 |
| 17129 Cerrito Dr | 0.43mi | 3/1.0 | 828 (-4%) | 2mo | $187,900 | $227 | 71 |
| 17240 S Montgall St | 0.17mi | 3/1.5 | 912 (+6%) | 12mo | $219,900 | $241 | 70 |
| 17255 Chestnut Dr | 0.07mi | 4/1.5 (+1) | 912 (+6%) | 19mo | $181,000 | $198 | 65 |
| 17205 Chestnut Dr | 0.34mi | 3/1.0 | 912 (+6%) | 16mo | $220,000 | $241 | 62 |
| 17212 Cerrito Dr | 0.35mi | 3/1.0 | 925 (+7%) | 22mo | $185,000 | $200 | 54 |
| 17218 Monte Verde Dr | 0.28mi | 3/1.0 | 950 (+10%) | 23mo | $209,900 | $221 | 51 |
| 17101 Cerrito St | 0.52mi | 2/1.0 (-1) | 896 (+4%) | 20mo | $99,000 | $110 | 48 |
Match score weights: distance 35% · size 25% · config 20% · recency 20%. Top-matched comps best support the ARV.
Projected returns pro-forma
-3.0% appreciation · 5.17% rent growth · sell at horizon
- IRR
- -6.5%
- Equity multiple
- 0.75×
- Total profit
- $-12,407
- Equity at exit
- $26,839
- IRR
- 5.4%
- Equity multiple
- 1.43×
- Total profit
- $21,790
- Equity at exit
- $15,563
Cash invested: $50,400 (down + closing). Projections, not guarantees.
Landlord ↔ Tenant lean methodology
- Overall (STATE)
- 81 Strongly Landlord-Friendly
- State Missouri
- 81 Strongly Landlord-Friendly · R+10
- County
- — inherits STATE
- City
- — inherits STATE
ZIP-level market 64012
- Rents YoY
- 5.2%
- Active inventory
- 204
- Price-to-rent
- 9.0×
Monthly cashflow live
- Estimated rent
- $1,668 medium interval (Pro) →
- Mortgage (P&I)
- −$944
- Tax from tax record
- −$93 /mo · $1,114/yr
- Insurance
- −$75
- HOA
- −$0
- Vacancy / Maint / Mgmt
- −$350
- Net cashflow
- $206
Break-even live
UW: 25.0% down · 7.5% · 30yr · 1.5% tax · 5.0% vac · 8.0% maint · 8.0% mgmt
Financing live
Cash to close
- Down payment
- $45,000
- Closing costs
- $5,400
- Reserves months
- —
- Total cash needed
- —
Loan-product check · same deal, 3 products live
Conventional
25% down · 7.5% · 30yr
- Down + closing
- —
- Monthly P&I
- —
- Monthly cashflow
- —
- DSCR
- —
- Eligible?
- —
Personal DTI + credit; lowest rate.
DSCR
20% down · 8.5% · 30yr
- Down + closing
- —
- Monthly P&I
- —
- Monthly cashflow
- —
- DSCR
- —
- Eligible?
- —
No personal income docs; deal must DSCR.
Hard money
10% down · 12.0% · 12mo
- Down + closing
- —
- Monthly P&I
- —
- Monthly cashflow
- —
- DSCR
- —
- Eligible?
- —
Short-term bridge; refi at stabilization.
Rent comps 1 comps
| Address | Beds | Baths | Sqft | Rent | $/sqft | DOM | Units | Dist |
|---|---|---|---|---|---|---|---|---|
| 210 Mill St Belton, MO | 2.0 | 1.0 | 700 | $1,100 | $1.57 | 23d | 1 | 1.41mi |
Listing history 18 events
-
2026-05-16status Pending
-
2026-05-11price $180,000
-
2026-05-01status Active
-
2026-04-26historical Active Under Contract
-
2026-04-19price $185,000
-
2026-04-13price $190,000
-
2026-04-04$200,000 Active
-
2026-03-14historical $200,000
-
2023-06-29soldstatus Closed 318-char remark
Show marketing remark (318 chars)
Looking for the handy homeowner! Put in some TLC to make this 3 Bedroom, 1 Bathroom, 1 Car Garage Ranch your own. With everything all on one level makes for easy living. Make sure to check out the large yard the home sits on. Plenty of room to add a garden or hang out spot for having a BBQ. ENTERTAINING ALL OFFERS!!!
-
2023-06-29soldstatus
Show marketing remark (318 chars)
Looking for the handy homeowner! Put in some TLC to make this 3 Bedroom, 1 Bathroom, 1 Car Garage Ranch your own. With everything all on one level makes for easy living. Make sure to check out the large yard the home sits on. Plenty of room to add a garden or hang out spot for having a BBQ. ENTERTAINING ALL OFFERS!!!
-
2023-06-09status Pending 318-char remark
Show marketing remark (318 chars)
Looking for the handy homeowner! Put in some TLC to make this 3 Bedroom, 1 Bathroom, 1 Car Garage Ranch your own. With everything all on one level makes for easy living. Make sure to check out the large yard the home sits on. Plenty of room to add a garden or hang out spot for having a BBQ. ENTERTAINING ALL OFFERS!!!
-
2023-06-07$175,000 Active 318-char remark
Show marketing remark (318 chars)
Looking for the handy homeowner! Put in some TLC to make this 3 Bedroom, 1 Bathroom, 1 Car Garage Ranch your own. With everything all on one level makes for easy living. Make sure to check out the large yard the home sits on. Plenty of room to add a garden or hang out spot for having a BBQ. ENTERTAINING ALL OFFERS!!!
-
2015-11-16soldstatus 355-char remark
Show marketing remark (355 chars)
3 bedroom ranch on large fenced lot. This Home is Owned by the U. S. Dept. of Housing & Urban Development (HUD). This HUD Home is Sold AS-IS/WHERE-IS with Any and All Faults. Buyer Must have a current Mortgage Commitment or Proof of Cash Funds. This Home is Case Number: 291-315735. Check www. HUDhomestore.com for the DAILY Status of this property.
-
2015-10-06$34,000 355-char remark
Show marketing remark (355 chars)
3 bedroom ranch on large fenced lot. This Home is Owned by the U. S. Dept. of Housing & Urban Development (HUD). This HUD Home is Sold AS-IS/WHERE-IS with Any and All Faults. Buyer Must have a current Mortgage Commitment or Proof of Cash Funds. This Home is Case Number: 291-315735. Check www. HUDhomestore.com for the DAILY Status of this property.
-
2013-12-09historical
-
2013-01-18$27,000
-
2003-07-23soldstatus
-
2003-05-16$79,900
ⓘ Source: listings_history table (triggers on properties + properties_extension) + one-shot
backfill from property_details.listing_events for pre-trigger history.
Tax reassessment forecast MO · Resets to sale price
- Current annual tax
- $1,114 · $93/mo
- Projected year-2 tax
- $1,746 · $146/mo
- Expected delta
- +$632/yr (+$53/mo · 56.7%)
ⓘ Screening estimate from a state-policy table — verify with the county assessor before closing.
Climate risk First Street
- Flood 1/10 Low FEMA zone X (unshaded) · 0% chance over 30 yrs
- Wildfire 2/10 Low
- Heat 4/10 Moderate 7 d/yr ≥107°F today · 17 d/yr by 30 yrs out
- Wind 2/10 Low
- Air quality 2/10 Low 2 unhealthy d/yr today · 2 by 30 yrs out
Nearby sold comps map
Loading sold comps map…
Walkable amenities ~0.75 mi
Loading nearby amenities…
Taxation est. · year 1
- Rental income
- $20,012
- − Mortgage interest
- −$10,083
- − Property taxes
- −$1,114
- − Insurance
- −$900
- − Repairs & maintenance
- −$1,601
- − Management
- −$1,601
- − Depreciation
- −$5,236
- Taxable loss
- −$524
- Est. tax savings @ 24.0%
- +$126
- After-tax cash flow
- $2,593/yr
For passive investors: Depreciation is non-cash, so a rental often shows a tax loss while cash-flowing — sheltering income. Rental losses are passive: they offset passive income freely, and up to $25,000/yr can offset ordinary (W-2) income if you actively participate and your MAGI is under $100k (phasing out to $0 by $150k); unused losses carry forward. On sale, claimed depreciation is recaptured at up to 25%, and gains may owe capital-gains tax (a 1031 exchange can defer both). Figures are a year-1 estimate at your 24.0% rate — not tax advice; consult a CPA.
Schools (NCES district)
- District
- Belton 124
- NCES district ID
- 2904620
- Math proficiency
- 28% ▼ -9.00%
- Reading proficiency
- 39% ▼ -9.00%
- Median HH income
- $56,946
- Composite
- 29.73/100
- National rank
- #6446
- State rank
- #216 of 324 in MO
Livability — Belton
- Score
- 76/100
- State rank
- #52
- US rank
- #3782
Category grades
Schools grade is shown separately in the Schools card above.
Census & demographics
- Census place
- Belton, MO
- County
- Cass County · 65,358 people
- City population
- 29,304
- Metro
- Kansas City, MO-KS
- Population (ZIP)
- 29,304
- Household income
- $71,814
- Rent vs Own
- Severe rent burden
- 1081.0
Population outlook (Cass County) Hauer SSP2
- Today (2025)
- 105,292 people
- By 2030
- 106,109 · +0.8%
- By 2040
- 105,786 · +0.5%
- By 2050
- 102,062 · -3.1%
- By 2075
- 88,569 · -15.9%
- By 2100
- 68,293 · -35.1%
Race, ethnicity, and origin ACS 2023
- Neighborhood character
- Predominantly White (80%)
- Race & ethnicity
- White 80% Two or more races 7% Hispanic / Latino 7% Black 6% Asian 1%
- Hispanic origin (detail)
- Mexican 5%
- Common ancestry
- Italian 2% Lithuanian 2% Portuguese 2%
- Foreign-born
- 2% · Canada
- Languages at home
- 96% English-only · Spanish 2% German/W. Germanic 1% Other Asian/Pacific 1%
Political lean MEDSL · Cass
- 2024 margin
- Solid R (+32.1) · D 33.3% · R 65.4% · Other 1.3%
- 2008→2024 swing
- -12.5pp toward R · 2008: -19.6pp · 2024: -32.1pp
- All cycles
- 2024: R+32.1 2020: R+31.6 2016: R+35.9 2012: R+28.4 2008: R+19.6
Not yet ingested
- Civics
- —
Market trends
- HPI YoY
- ▼ -244.76%
- Current HPI
- 214.6157
- Rent YoY
- ▲ 5.17%
- Metro
- Kansas City, MO-KS
- State GDP YoY
- ▲ 1.84%
- F500 in state
- 20
Industry mix (Fortune 500 HQ in MO)
| Industry | F500 HQs | Revenue |
|---|---|---|
| Healthcare | 1 | $163B |
|
||
| Insurance | 1 | $21B |
|
||
| Industrial Technology | 1 | $17B |
|
||
| Retail | 1 | $16B |
|
||
| Industrial Distribution | 1 | $10B |
|
||
| Utilities | 1 | $9B |
|
||
Price history
+125.3% since first listed18 events — show timeline
- 2026-05-16 Pending — Heartland MLS as Distributed by MLS Grid
- 2026-05-11 Price Changed $180,000 Heartland MLS as Distributed by MLS Grid
- 2026-05-01 Relisted — Heartland MLS as Distributed by MLS Grid
- 2026-04-26 Contingent — Heartland MLS as Distributed by MLS Grid
- 2026-04-19 Price Changed $185,000 Heartland MLS as Distributed by MLS Grid
- 2026-04-13 Price Changed $190,000 Heartland MLS as Distributed by MLS Grid
- 2026-04-04 Listed $200,000 Heartland MLS as Distributed by MLS Grid
- 2026-03-14 Coming Soon $200,000 Heartland MLS as Distributed by MLS Grid
- 2023-06-29 Sold (Public Records) — Public Records
- 2023-06-29 Sold (MLS) — Heartland MLS as Distributed by MLS Grid
- 2023-06-09 Pending — Heartland MLS as Distributed by MLS Grid
- 2023-06-07 Listed $175,000 Heartland MLS as Distributed by MLS Grid
- 2015-11-16 Sold (MLS) — Heartland MLS as Distributed by MLS Grid
- 2015-10-06 Listed $34,000 Heartland MLS as Distributed by MLS Grid
- 2013-12-09 Listing Removed — Heartland MLS as Distributed by MLS Grid
- 2013-01-18 Listed $27,000 Heartland MLS as Distributed by MLS Grid
- 2003-07-23 Sold (MLS) — Heartland MLS as Distributed by MLS Grid
- 2003-05-16 Listed $79,900 Heartland MLS as Distributed by MLS Grid
Property tax history
+4.5%/yrLatest (2025): $1,114 · +13.3% YoY. Source: county tax records.
Cash-flow waterfall
monthlySold comps — $/sqft
last 12 mo · ≤1 miLoading sold comps…