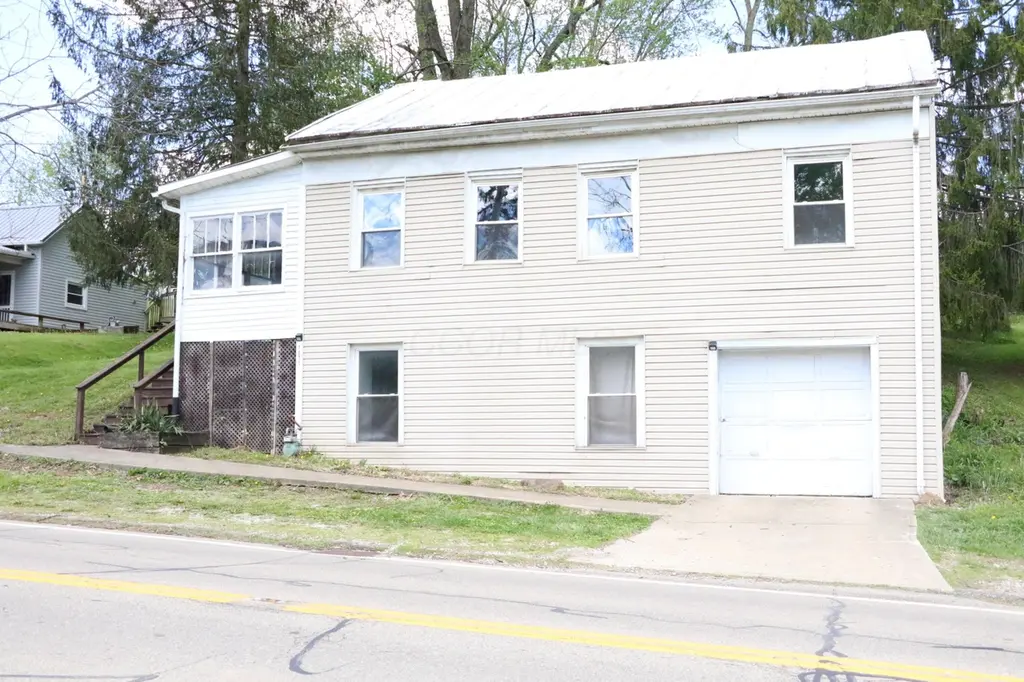
7071 Columbus Rd · Centerburg, OH
Flood risk 1/10 · Minimal
- FEMA flood zone
- X (unshaded)
- Chance of flooding over 30 yrs
- 0.0%
- Est. flood insurance / yr
- $473 – $860
Fire risk 1/10 · Minimal
- Est. fire insurance / yr
- $713 – $1,323
Heat risk 3/10 · Minor
- Hot days now (above 97°F)
- 7 days/yr
- Hot days in 30 yrs
- 18 days/yr
Wind risk 2/10 · Minimal
- Chance of severe wind over 30 yrs
- 0.0%
Air-quality risk 2/10 · Minimal
- Unhealthy air days now
- 1 days/yr
- Unhealthy air days in 30 yrs
- 2 days/yr
Risk factors via First Street. Map © Google.
Why this score? — see what drove the B- grade
The composite is a weighted blend of 9 inputs, each scored 0–100. Each bar is that input's sub-score; the figure is the points it added to the 100-point composite (weight × sub-score).
- Cash flow +21.3/30.0
- ARV discount +15.0/15.0
- DSCR +6.8/10.0
- Schools +5.7/10.0
- 1% rule +5.0/10.0
- Appreciation +5.0/10.0
- Livability +3.6/5.0
- Rent growth +2.5/5.0
- Condition / age +2.5/5.0
$100,000
🖨 Deal sheet 📄 Offer letter ✓ Due diligence
Listing remarks MLS
WOW! Price Reduced! ATTENTION INVESTORS!! Great Investment Property! TAKE A LOOK AND MAKE YOUR BEST OFFER! NEEDS SOME TLC. PARTIAL FINISHED ROOM IN LOWER LEVEL COULD BE 3RD BEDROOM.
Key facts
- Attached garage
- Enclosed porch
- 9,147 sq ft lot
Tags
Neighborhood map
What this means for you Summary
Snapshot
- This is a 3-bed/1.0-bath single-family listed at $100k.
Deal economics
- At list price, monthly cash flow is $146 ($2k/yr) — positive.
- The deal already cash-flows at list — no discount required.
- To meet the 1% rule (rent ≥ 1% of price), the offer needs to be $100k (0.4% below list).
- Recommended offer: $100k (0.4% below list) — sets the bar for 1% rule.
- Cap rate 8.0% vs local median 3.6% in Centerburg — top-decile yield for the area; either an underpriced asset or a hidden risk that comps aren't pricing in. Stress-test before assuming the spread holds.
Location & tenants
- Location reads 72/100 on livability (#367 in OH) — a middle-class / working-renter tenant base. Strengths: crime A+, cost of living A+, housing A+; Watch: amenities F, commute F, health & safety F.
- Centerburg Local (rural): math 60% / reading 71% proficiency, ranked #183 of 656 in OH (top 28%) — acceptable for families but not a draw, mixed tenant base, ~2y average lease; only 18% free/reduced lunch — higher-income household profile.
- Market conditions: 1 active listings in the ZIP; 195 units permitted in Knox County in 2024 (0 in 5+ unit buildings).
Forward outlook
- In year one you build about $4k of equity ($691 loan paydown + $3k appreciation (3.0% local appreciation)).
- Knox County population projected at -14% by 2050 — secular population decline; favor cash flow + early exit over multi-decade hold.
- At projected returns (3.0% appreciation + 3.0% rent growth), your $28k cash investment doubles in ~5 years — after that, you're playing with house money.
- By year 9, paydown + projected appreciation supports a ~$31k cash-out refi (75% LTV) — recoverable capital for the next deal without selling this one.
Negotiation context
- Only 3 days on market — expect competitive offers; lowballing is unlikely to land.
- 6 sale attempts since 31y ago with the ask held roughly flat each time — persistent listings suggest the price (not the market) is what's stuck; bring a comps-based counter.
- Current owner paid $24k; list at $100k implies a 312% gain — meaningful room to come down on a strong offer.
Risks & watch-outs
- Watch-outs: built in 1900 — expect roof / HVAC / electrical / plumbing capex.
Questions for the listing agent
- Built in 1900 — when were the roof, HVAC, electrical panel, plumbing, and water heater last replaced?
- Is there a deadline driving the sale (1031 exchange, divorce, estate, relocation)? That informs how much negotiation room exists.
- Schools are A-rated — typically a magnet for longer-tenancy family renters. What's the average tenant stay here, and is there a school-zone premium baked into asking?
- What's the average days-on-market for RENTAL listings here right now (not sales)? A rising rental-DOM trend means longer vacancies and softer asking-rent achievability than the comps imply.
- What's the recent tenant-quality profile in this submarket — average credit score on applications, eviction rate, late-payment / NSF rate, and stable-employment percentage? A property-management company in the area should have these aggregated.
- How much new for-sale + rental construction is in the pipeline within 1–3 miles? Heavy new supply typically softens prices + rents 12–24 months out; constrained supply supports both.
Investment metrics
- 1% rule
- 1.00% ✗
- Cap rate
- 8.04%
- Cash-on-cash
- 6.25%
- DSCR
- 1.28
- GRM
- 8.4
CMA / ARV
- ARV (on-the-fly)
- $120,000
- Comps found
- 1
Show comp detail 1 sale within ~0.75 mi
| Address | Dist | Beds/Ba | Sqft | Sold | Price | $/sf | Match |
|---|---|---|---|---|---|---|---|
| 7071 Columbus Rd | 0.00mi | 3/1.0 | 800 (0%) | 1mo | $120,000 | $150 | 99 |
Match score weights: distance 35% · size 25% · config 20% · recency 20%. Top-matched comps best support the ARV.
Projected returns pro-forma
3.0% appreciation · 3.0% rent growth · sell at horizon
- IRR
- 13.3%
- Equity multiple
- 1.76×
- Total profit
- $21,320
- Equity at exit
- $44,964
- IRR
- 15.2%
- Equity multiple
- 3.25×
- Total profit
- $62,872
- Equity at exit
- $69,295
Cash invested: $28,000 (down + closing). Projections, not guarantees.
Landlord ↔ Tenant lean methodology
- Overall (STATE)
- 73 Landlord-Friendly
- State Ohio
- 73 Landlord-Friendly · R+6
- County
- — inherits STATE
- City
- — inherits STATE
ZIP-level market 43048
- Active inventory
- 1
- Price-to-rent
- 8.4×
Monthly cashflow live
- Estimated rent
- $996 medium interval (Pro) →
- Mortgage (P&I)
- −$524
- Tax from tax record
- −$75 /mo · $903/yr
- Insurance
- −$42
- HOA
- −$0
- Vacancy / Maint / Mgmt
- −$209
- Net cashflow
- $146
Break-even live
UW: 25.0% down · 7.5% · 30yr · 1.5% tax · 5.0% vac · 8.0% maint · 8.0% mgmt
Financing live
Cash to close
- Down payment
- $25,000
- Closing costs
- $3,000
- Reserves months
- —
- Total cash needed
- —
Loan-product check · same deal, 3 products live
Conventional
25% down · 7.5% · 30yr
- Down + closing
- —
- Monthly P&I
- —
- Monthly cashflow
- —
- DSCR
- —
- Eligible?
- —
Personal DTI + credit; lowest rate.
DSCR
20% down · 8.5% · 30yr
- Down + closing
- —
- Monthly P&I
- —
- Monthly cashflow
- —
- DSCR
- —
- Eligible?
- —
No personal income docs; deal must DSCR.
Hard money
10% down · 12.0% · 12mo
- Down + closing
- —
- Monthly P&I
- —
- Monthly cashflow
- —
- DSCR
- —
- Eligible?
- —
Short-term bridge; refi at stabilization.
Listing history 14 events
-
2026-04-23status Pending
-
2026-04-17$100,000 Active
-
2009-12-10soldstatus $24,300 181-char remark
Show marketing remark (181 chars)
WOW! Price Reduced! ATTENTION INVESTORS!! Great Investment Property! TAKE A LOOK AND MAKE YOUR BEST OFFER! NEEDS SOME TLC. PARTIAL FINISHED ROOM IN LOWER LEVEL COULD BE 3RD BEDROOM.
-
2009-09-15$25,500 181-char remark
Show marketing remark (181 chars)
WOW! Price Reduced! ATTENTION INVESTORS!! Great Investment Property! TAKE A LOOK AND MAKE YOUR BEST OFFER! NEEDS SOME TLC. PARTIAL FINISHED ROOM IN LOWER LEVEL COULD BE 3RD BEDROOM.
-
2007-11-01historical
-
2007-04-20$87,900
-
2006-03-30historical
-
2005-11-22$82,500
-
2005-07-28soldstatus $42,000
-
2005-05-01$59,900
-
2002-12-19soldstatus $55,000
-
1995-08-22soldstatus $45,000
-
1995-08-18soldstatus $45,000
-
1995-05-22$45,000
ⓘ Source: listings_history table (triggers on properties + properties_extension) + one-shot
backfill from property_details.listing_events for pre-trigger history.
Tax reassessment forecast OH · Partial reset (capped growth)
- Current annual tax
- $903 · $75/mo
- Projected year-2 tax
- $1,232 · $103/mo
- Expected delta
- +$328/yr (+$27/mo · 36.4%)
ⓘ Screening estimate from a state-policy table — verify with the county assessor before closing.
Climate risk First Street
- Flood 1/10 Low FEMA zone X (unshaded) · 0% chance over 30 yrs
- Wildfire 1/10 Low
- Heat 3/10 Moderate 7 d/yr ≥97°F today · 18 d/yr by 30 yrs out
- Wind 2/10 Low 0% chance of damaging wind over 30 yrs
- Air quality 2/10 Low 1 unhealthy d/yr today · 2 by 30 yrs out
Nearby sold comps map
Loading sold comps map…
Walkable amenities ~0.75 mi
Loading nearby amenities…
Taxation est. · year 1
- Rental income
- $11,957
- − Mortgage interest
- −$5,602
- − Property taxes
- −$903
- − Insurance
- −$500
- − Repairs & maintenance
- −$957
- − Management
- −$957
- − Depreciation
- −$2,909
- Taxable income
- $130
- Est. tax owed @ 24.0%
- −$31
- After-tax cash flow
- $1,719/yr
For passive investors: Depreciation is non-cash, so a rental often shows a tax loss while cash-flowing — sheltering income. Rental losses are passive: they offset passive income freely, and up to $25,000/yr can offset ordinary (W-2) income if you actively participate and your MAGI is under $100k (phasing out to $0 by $150k); unused losses carry forward. On sale, claimed depreciation is recaptured at up to 25%, and gains may owe capital-gains tax (a 1031 exchange can defer both). Figures are a year-1 estimate at your 24.0% rate — not tax advice; consult a CPA.
Schools (NCES district)
- District
- Centerburg Local
- NCES district ID
- 3904782
- Math proficiency
- 60% ▼ -12.00%
- Reading proficiency
- 71% ▼ -4.00%
- Median HH income
- $65,410
- Composite
- 57.07/100
- National rank
- #1105
- State rank
- #183 of 656 in OH
Livability — Centerburg
- Score
- 72/100
- State rank
- #367
- US rank
- #5932
Category grades
Schools grade is shown separately in the Schools card above.
Census & demographics
No demographic data for this ZIP.
Market trends
- HPI YoY
- —
- Current HPI
- —
- Rent YoY
- —
- Metro
- —
- State GDP YoY
- ▲ 1.98%
- F500 in state
- 48
Industry mix (Fortune 500 HQ in OH)
| Industry | F500 HQs | Revenue |
|---|---|---|
| Insurance | 3 | $145B |
|
||
| Industrial Machinery | 3 | $49B |
|
||
| Financial Services | 3 | $24B |
|
||
| Consumer Goods | 2 | $93B |
|
||
| Aerospace / Defense | 2 | $47B |
|
||
| Utilities | 2 | $33B |
|
||
Price history
+122.2% since first listed14 events — show timeline
- 2026-04-23 Pending — CBRMLS
- 2026-04-17 Listed $100,000 CBRMLS
- 2009-12-10 Sold (MLS) $24,300 CBRMLS
- 2009-09-15 Listed $25,500 CBRMLS
- 2007-11-01 Listing Removed — CBRMLS
- 2007-04-20 Listed $87,900 CBRMLS
- 2006-03-30 Listing Removed — CBRMLS
- 2005-11-22 Listed $82,500 CBRMLS
- 2005-07-28 Sold (MLS) $42,000 CBRMLS
- 2005-05-01 Listed $59,900 CBRMLS
- 2002-12-19 Sold (Public Records) $55,000 Public Records
- 1995-08-22 Sold (Public Records) $45,000 Public Records
- 1995-08-18 Sold (MLS) $45,000 CBRMLS
- 1995-05-22 Listed $45,000 CBRMLS
Property tax history
+4.8%/yrLatest (2025): $903 · +0.0% YoY. Source: county tax records.
Cash-flow waterfall
monthlySold comps — $/sqft
last 12 mo · ≤1 miLoading sold comps…