 Multi-family
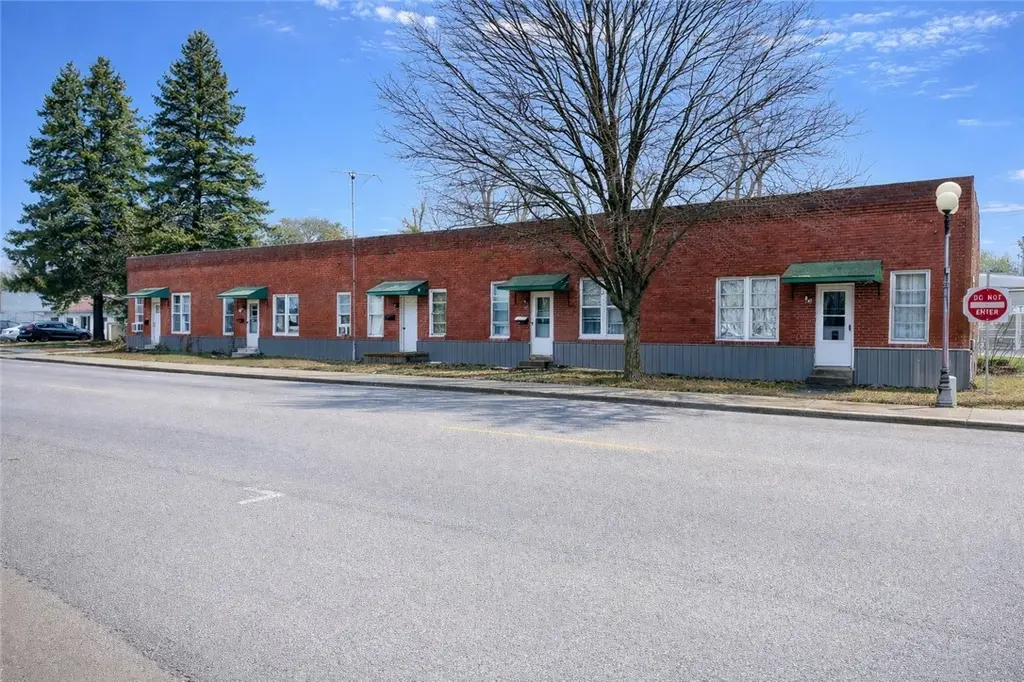
209 S Central Ave · Casey, IL
Flood risk No data
- FEMA flood zone
- —
- Chance of flooding over 30 yrs
- —
- Est. flood insurance / yr
- —
Fire risk No data
- Est. fire insurance / yr
- —
Heat risk No data
- Hot days now (above threshold)
- —
- Hot days in 30 yrs
- —
Wind risk No data
- Chance of severe wind over 30 yrs
- —
Air-quality risk No data
- Unhealthy air days now
- —
- Unhealthy air days in 30 yrs
- —
Risk factors via First Street. Map © Google.
Why this score? — see what drove the B- grade
The composite is a weighted blend of 9 inputs, each scored 0–100. Each bar is that input's sub-score; the figure is the points it added to the 100-point composite (weight × sub-score).
- Cash flow +30.0/30.0
- 1% rule +10.0/10.0
- DSCR +10.0/10.0
- ARV discount +7.5/15.0
- Livability +3.1/5.0
- Rent growth +2.5/5.0
- Schools +2.2/10.0
- Condition / age +2.2/5.0
- Appreciation +0.0/10.0
$150,000
🖨 Deal sheet (PDF) 📄 Offer letter ✓ Due diligence
Multi-family units
County records classify this as Multi-Family (5+ Unit). Listing-text estimate: 1 unit. estimate disagrees with records
5+ unit building — per-unit beds/baths from public records are typically unavailable; the breakdown below (if shown) is an estimate from the listing text.
Listing remarks MLS
Investor Special – Multifamily Opportunity Five-unit single-story brick apartment building featuring three 2-bedroom units and two 1-bedroom units. Tenants pay their own utilities. Full sized refrigerators and ranges remain but are not warranted. Some units have updated flooring, however the property overall requires repairs and maintenance and is being sold as-is. Downtown location with strong rental demand. Estimated gross potential income of $31,000. This is a project for an investor looking to improve and stabilize a small multifamily property. One unit is currently empty while undergoing some updates (bathroom sink & water heater install). This unit is not pictured in photos and will be rented once repairs are completed.
Key facts
- Strong rental demand
- Updated flooring
- Downtown location
Tags
Neighborhood map
What this means for you Summary
Snapshot
- This is a 8-bed/5.0-bath multifamily listed at $150k. Condition is rated fair.
Deal economics
- At list price, monthly cash flow is $2k ($27k/yr) — positive.
- The deal already cash-flows at list — no discount required.
- Meets the 1% rule at list price ($4k rent vs $150k).
- Recommended offer: $141k (6.0% below list) — sets the bar for market timing.
Location & tenants
- Location reads 62/100 on livability (#849 in IL) — a middle-class / working-renter tenant base. Strengths: cost of living A+, housing A+, crime B+; Watch: employment C-, schools D, amenities F.
- Casey-Westfield CUSD 4C (town): math 19% / reading 32% proficiency, ranked #322 of 620 in IL (top 52%) — low school quality limits family demand, transient renter base, plan for 1-2y turnover.
- Market conditions: 35 active listings in the ZIP; 1 units permitted in Clark County in 2024 (0 in 5+ unit buildings).
Forward outlook
- Local home prices are declining (-3.0%/yr); year-one equity from $1k of loan paydown is wiped out by about $4k of value loss. Plan a longer hold.
- Clark County population projected at -20% by 2050 — secular population decline; favor cash flow + early exit over multi-decade hold.
- At projected returns (-3.0% appreciation + 3.0% rent growth), your $42k cash investment doubles in ~2 years — after that, you're playing with house money.
Negotiation context
- It's been on market 90 days — a 6% lower offer ($141k) is reasonable based on typical stale-listing flexibility.
- 3 sale attempts since 3y ago with the ask held roughly flat each time — persistent listings suggest the price (not the market) is what's stuck; bring a comps-based counter.
Risks & watch-outs
- Watch-outs: built in 1900 — expect roof / HVAC / electrical / plumbing capex.
Questions for the listing agent
- It's been on market 90 days. Have you received any prior offers? Is the seller open to a 6% concession, seller financing, or rate buy-down credit?
- Have any recent inspections been done? Can we get a copy of the seller's disclosures and any deferred-maintenance estimates?
- Built in 1900 — when were the roof, HVAC, electrical panel, plumbing, and water heater last replaced?
- Why hasn't it sold? Are there any deal-killer items the seller is aware of (foundation, flood, title, zoning, code violations)?
- Is there a deadline driving the sale (1031 exchange, divorce, estate, relocation)? That informs how much negotiation room exists.
- Schools are D-rated, which usually means shorter tenancies and higher turnover. Who's the typical renter profile here, and what's been the actual vacancy rate?
- What's the average days-on-market for RENTAL listings here right now (not sales)? A rising rental-DOM trend means longer vacancies and softer asking-rent achievability than the comps imply.
- What's the recent tenant-quality profile in this submarket — average credit score on applications, eviction rate, late-payment / NSF rate, and stable-employment percentage? A property-management company in the area should have these aggregated.
- How much new apartment / multifamily construction is in the pipeline within 1–3 miles? Heavy new supply (>2% of stock underway) typically softens rents 12–24 months out; light construction supports rent growth.
Investment metrics
- 1% rule
- 2.75% ✓
- Cap rate
- 24.10%
- Cash-on-cash
- 63.58%
- DSCR
- 3.83
- GRM
- 3.0
CMA / ARV
No comps found within radius.
Projected returns pro-forma
-3.0% appreciation · 3.0% rent growth · sell at horizon
- IRR
- 62.6%
- Equity multiple
- 3.80×
- Total profit
- $117,486
- Equity at exit
- $22,365
- IRR
- 67.1%
- Equity multiple
- 7.79×
- Total profit
- $285,058
- Equity at exit
- $12,969
Cash invested: $42,000 (down + closing). Projections, not guarantees.
Landlord ↔ Tenant lean methodology
- Overall (STATE)
- 43 Moderately Tenant-Leaning
- State Illinois
- 43 Moderately Tenant-Leaning · D+7
- County
- — inherits STATE
- City
- — inherits STATE
ZIP-level market 62420
- Home prices YoY
- -8.9%
- Active inventory
- 35
- Price-to-rent
- 15.7×
Monthly cashflow live
- Estimated rent
- $4,129 medium interval (Pro) →
- Mortgage (P&I)
- −$787
- Tax est. 1.5%
- −$188 /mo · $2,250/yr
- Insurance
- −$62
- HOA
- −$0
- Vacancy / Maint / Mgmt
- −$867
- Net cashflow
- $2,225
Break-even live
Sensitivity live
| Price | -10% $2,329 | -5% $2,277 | +0% $2,225 | +5% $2,173 | +10% $2,122 |
|---|---|---|---|---|---|
| Rent | -10% $1,899 | -5% $2,062 | +0% $2,225 | +5% $2,388 | +10% $2,551 |
| Rate | -1.0pp $2,301 | -0.5pp $2,263 | base $2,225 | +0.5pp $2,186 | +1.0pp $2,147 |
5-unit breakdown (identical units grouped — click to expand)
| Units | Beds | Baths | Est. rent |
|---|---|---|---|
| 3× units | 2 | 1 | $2,385 |
| #1 | 2 | 1 | $795 |
| #2 | 2 | 1 | $795 |
| #3 | 2 | 1 | $795 |
| 2× units | 1 | 1 | $1,744 |
| #4 | 1 | 1 | $872 |
| #5 | 1 | 1 | $872 |
| Total (5 units) | $4,129 | ||
UW: 25.0% down · 7.5% · 30yr · 1.5% tax · 5.0% vac · 8.0% maint · 8.0% mgmt
Financing live
Cash to close
- Down payment
- $37,500
- Closing costs
- $4,500
- Reserves months
- —
- Total cash needed
- —
Loan-product check · same deal, 3 products live
Conventional
25% down · 7.5% · 30yr
- Down + closing
- —
- Monthly P&I
- —
- Monthly cashflow
- —
- DSCR
- —
- Eligible?
- —
Personal DTI + credit; lowest rate.
DSCR
20% down · 8.5% · 30yr
- Down + closing
- —
- Monthly P&I
- —
- Monthly cashflow
- —
- DSCR
- —
- Eligible?
- —
No personal income docs; deal must DSCR.
Hard money
10% down · 12.0% · 12mo
- Down + closing
- —
- Monthly P&I
- —
- Monthly cashflow
- —
- DSCR
- —
- Eligible?
- —
Short-term bridge; refi at stabilization.
Listing history 11 events
-
2026-06-07statusdays on market $150,000 Pending 90 DOM
-
2026-06-02days on market $150,000 Active 88 DOM
-
2026-06-01days on market $150,000 Active 87 DOM
-
2026-05-31days on market $150,000 Active 86 DOM
-
2026-05-30days on market $150,000 Active 85 DOM
-
2026-03-06$150,000 Active 748-char remark
Show marketing remark (748 chars)
Investor Special – Multifamily Opportunity Five-unit single-story brick apartment building featuring three 2-bedroom units and two 1-bedroom units. Tenants pay their own utilities. Full sized refrigerators and ranges remain but are not warranted. Some units have updated flooring, however the property overall requires repairs and maintenance and is being sold as-is. Downtown location with strong rental demand. Estimated gross potential income of $31,000. This is a project for an investor looking to improve and stabilize a small multifamily property. One unit is currently empty while undergoing some updates (bathroom sink & water heater install). This unit is not pictured in photos and will be rented once repairs are completed.
-
2024-12-13historical
-
2024-11-22
-
2023-10-12historical
-
2023-09-14
-
2022-11-24historical
ⓘ Source: listings_history table (triggers on properties + properties_extension) + one-shot
backfill from property_details.listing_events for pre-trigger history.
Nearby sold comps map
Loading sold comps map…
Walkable amenities ~0.75 mi
Loading nearby amenities…
Taxation est. · year 1
- Rental income
- $49,548
- − Mortgage interest
- −$8,402
- − Property taxes
- −$2,250
- − Insurance
- −$750
- − Repairs & maintenance
- −$3,964
- − Management
- −$3,964
- − Depreciation
- −$4,364
- Taxable income
- $25,854
- Est. tax owed @ 24.0%
- −$6,205
- After-tax cash flow
- $20,498/yr
For passive investors: Depreciation is non-cash, so a rental often shows a tax loss while cash-flowing — sheltering income. Rental losses are passive: they offset passive income freely, and up to $25,000/yr can offset ordinary (W-2) income if you actively participate and your MAGI is under $100k (phasing out to $0 by $150k); unused losses carry forward. On sale, claimed depreciation is recaptured at up to 25%, and gains may owe capital-gains tax (a 1031 exchange can defer both). Figures are a year-1 estimate at your 24.0% rate — not tax advice; consult a CPA.
Condition & rehab AI · 12 photos
This five-unit multifamily property requires moderate repairs and maintenance, with a focus on updating the kitchens and bathrooms to increase both resale and rental value.
Repairs flagged
- Moderate kitchen cabinets — dated and in need of replacement
- Moderate bathroom fixtures — basic and in need of replacement
- Moderate flooring — dated and in need of replacement
- Moderate paint — basic and in need of fresh coats
Value-add opportunities
- Both kitchen renovation — modernizing the kitchen would increase both resale and rental value
- Both bathroom renovation — modernizing the bathrooms would increase both resale and rental value
- Both flooring replacement — replacing the dated flooring would increase both resale and rental value
- Both painting — fresh paint would improve the home's curb appeal and interior aesthetics
Renovation cost estimate screening
| Repair item | Severity | Est. cost |
|---|---|---|
| kitchen cabinets · dated and in need of replacement | Moderate | $3,000–15,000 |
| bathroom fixtures · basic and in need of replacement | Moderate | $3,000–15,000 |
| flooring · dated and in need of replacement | Moderate | $3,000–15,000 |
| paint · basic and in need of fresh coats | Moderate | $3,000–15,000 |
| Total estimated repair cost · 4 items | $12,000–60,000 |
Value-add ROI direction
- Both kitchen renovation — modernizing the kitchen would increase both resale and rental value ↑
- Both bathroom renovation — modernizing the bathrooms would increase both resale and rental value ↑
- Both flooring replacement — replacing the dated flooring would increase both resale and rental value ↑
- Both painting — fresh paint would improve the home's curb appeal and interior aesthetics ↑
ⓘ Cost ranges are severity-bucket heuristics (US national rule-of-thumb). Get contractor quotes + a written scope before underwriting a rehab budget.
Schools (NCES district)
- District
- Casey-Westfield CUSD 4C
- NCES district ID
- 1700002
- Math proficiency
- 19% ▼ -13.00%
- Reading proficiency
- 32% ▼ -12.00%
- Median HH income
- $45,497
- Composite
- 21.99/100
- National rank
- #8208
- State rank
- #322 of 620 in IL
Livability — Casey
- Score
- 62/100
- State rank
- #849
- US rank
- #16670
Category grades
Schools grade is shown separately in the Schools card above.
Census & demographics
- Census place
- Casey, IL
- Population (ZIP)
- 4,361
Population outlook (Clark County) Hauer SSP2
- Today (2025)
- 14,978 people
- By 2030
- 14,380 · -4.0%
- By 2040
- 13,135 · -12.3%
- By 2050
- 11,920 · -20.4%
- By 2075
- 9,254 · -38.2%
- By 2100
- 6,737 · -55.0%
Race, ethnicity, and origin ACS 2023
- Neighborhood character
- Predominantly White (95%)
- Race & ethnicity
- White 95% Hispanic / Latino 3% Two or more races 2% Black 1%
- Common ancestry
- Iranian 2% Italian 1% Serbian 1%
- Foreign-born
- 1% · Canada
- Languages at home
- 98% English-only · Spanish 2%
Political lean MEDSL · Clark
- 2024 margin
- Solid R (+51.2) · D 23.5% · R 74.7% · Other 1.8%
- 2008→2024 swing
- -43.2pp toward R · 2008: -8.1pp · 2024: -51.2pp
- All cycles
- 2024: R+51.2 2020: R+50.7 2016: R+47.9 2012: R+32.5 2008: R+8.1
Not yet ingested
- Civics
- —
Market trends
- HPI YoY
- ▼ -17.02%
- Current HPI
- 174.2999
- Rent YoY
- —
- Metro
- —
- State GDP YoY
- ▲ 1.59%
- F500 in state
- 60
Industry mix (Fortune 500 HQ in IL)
| Industry | F500 HQs | Revenue |
|---|---|---|
| Insurance | 4 | $201B |
|
||
| Consumer Goods | 4 | $87B |
|
||
| Industrial Machinery | 3 | $64B |
|
||
| Healthcare | 2 | $55B |
|
||
| Retail / Pharmacy | 1 | $148B |
|
||
| Agriculture / Food | 1 | $86B |
|
||
Price history
6 events — show timeline
- 2026-03-06 Listed $150,000 CIBR
- 2024-12-13 Rental Removed — RENTEC
- 2024-11-22 Listed for Rent — RENTEC
- 2023-10-12 Rental Removed — RENTEC
- 2023-09-14 Listed for Rent — RENTEC
- 2022-11-24 Rental Removed — RENTEC
Cash-flow waterfall
monthlySold comps — $/sqft
last 12 mo · ≤1 miLoading sold comps…