6910 Troon Way · Indianapolis city (balance), IN
Flood risk 1/10 · Minimal
- FEMA flood zone
- X (unshaded)
- Chance of flooding over 30 yrs
- 0.0%
- Est. flood insurance / yr
- $507 – $1,088
Fire risk 1/10 · Minimal
- Est. fire insurance / yr
- $717 – $1,331
Heat risk 3/10 · Minor
- Hot days now (above 102°F)
- 7 days/yr
- Hot days in 30 yrs
- 19 days/yr
Wind risk 2/10 · Minimal
- Chance of severe wind over 30 yrs
- 1.0%
Air-quality risk 2/10 · Minimal
- Unhealthy air days now
- 1 days/yr
- Unhealthy air days in 30 yrs
- 2 days/yr
Risk factors via First Street. Map © Google.
Why this score? — see what drove the C- grade
The composite is a weighted blend of 9 inputs, each scored 0–100. Each bar is that input's sub-score; the figure is the points it added to the 100-point composite (weight × sub-score).
- Cash flow +19.1/30.0
- ARV discount +12.1/15.0
- DSCR +6.0/10.0
- 1% rule +4.5/10.0
- Schools +4.0/10.0
- Rent growth +3.4/5.0
- Livability +2.5/5.0
- Condition / age +2.5/5.0
- Appreciation +0.0/10.0
$250,000
🖨 Deal sheet (PDF) 📄 Offer letter ✓ Due diligence
Listing remarks MLS
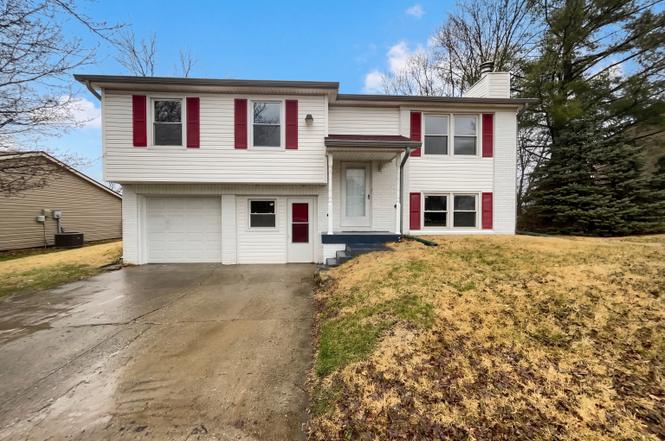
Located in the Muirfield community, 3 bedroom, 3 full bathroom Bi-Level home. Explore this home via interactive 3D home tour, complete with floor plans, video & more. Kitchen features new laminate flooring, ceramic tile back splash, a center island and just a step out to the multi level wood decks. Family room on lower level with wood burning fire place for enjoyment. Living room on upper level with open concept to dining room. Master suite with a step-in shower and newly added spacious sitting room. 1 car attached garage with bonus room on lower level for unlimited possibilities. Outdoor entertaining galore, with upper & lower level large wood decks, basketball court with a fully fenced in back yard. Great location in Franklin Township!
Key facts
- Fenced in backyard
- Deck
- Fresh interior paint
Tags
Property features AI
Finance
- Other: Approximately 1,718 living area (total building area 1,945) — main level primarily with finished lower level area; Main level contains seven rooms total; Directions provided with listing
Exterior
- Parking: Attached garage (1 car)
- Utilities: Public water; Municipal sewer connected; Solid waste service
- Home design: Single family residence; Two levels; Residential property
- Construction: Brick and vinyl siding exterior; Slab foundation
- Exterior features: Lot under 1/4 acre (approximately 0.24 acre)
Interior
- Kitchen: Microwave; Dishwasher; Electric oven
- Bedrooms: Three bedrooms on the main level
- Bathrooms: Three full bathrooms (two on main level, one in basement)
- Heating & cooling: Forced air heating; Cooling (type listed as other)
- Interior features: Partially finished basement; Fireplace (1); Microwave; Dishwasher; Electric oven
- Laundry & utility: Public water; Municipal sewer connected; Solid waste service
Neighborhood map
What this means for you Summary
Snapshot
- This is a 3-bed/1.5-bath single-family listed at $250k.
Deal economics
- At list price, monthly cash flow is $265 ($3k/yr) — positive.
- The deal already cash-flows at list — no discount required.
- To meet the 1% rule (rent ≥ 1% of price), the offer needs to be $238k (4.8% below list).
- Recommended offer: $235k (6.0% below list) — sets the bar for market timing.
- Cap rate 7.6% vs local median 4.4% in Indianapolis city (balance) — top-decile yield for the area; either an underpriced asset or a hidden risk that comps aren't pricing in. Stress-test before assuming the spread holds.
Location & tenants
- Location reads: area grade C — affects rentability + tenant quality, not the cash-flow math above.
- Franklin Township Community School Corporation (urban): math 42% / reading 47% proficiency, ranked #87 of 301 in IN (top 29%) — families likely to look elsewhere, expect single-tenant / working-renter base with shorter leases.
- Zoned schools: Bunker Hill Elementary School (math 67% / reading 52%, grade B-, #128 of 994 statewide, top 15%, 501 students, 42% FRL); Franklin Central High School (math 41% / reading 69%, grade C, #77 of 369 statewide, top 21%, 3,319 students, 46% FRL) — zoned schools average 44% FRL vs 29% district-wide (15 pts higher); higher-poverty schools than district average — tighter screening recommended.
- Zoned-school proficiency averages 57% at this address vs 44% district-wide (+13 pts) — the actual schools serving this property are materially stronger than the Franklin Township Community School Corporation average implies; a family-tenant draw the district grade alone would hide.
- Market conditions: Rents rising (+3.8%/yr); 270 active listings in the ZIP; 6 comparable units currently listed for rent nearby; rentals leasing fast (median 6d on market — plan ~1-2 weeks tenant-placement turnaround); solid renter incomes; 1,906 units permitted in Marion County in 2024 (621 in 5+ unit buildings).
- This rent runs 36% of the median local income ($79k/yr) — at the standard rent-burdened threshold; future hikes will face affordability resistance.
Forward outlook
- Local home prices are declining (-3.0%/yr); year-one equity from $2k of loan paydown is wiped out by about $8k of value loss. Plan a longer hold.
- Marion County population projected at +18% by 2050 — long-run rental-demand tailwind backs the buy-and-hold thesis.
Negotiation context
- It's been on market 66 days — a 6% lower offer ($235k) is reasonable based on typical stale-listing flexibility.
- 4 sale attempts since 7y ago with the ask held roughly flat each time — persistent listings suggest the price (not the market) is what's stuck; bring a comps-based counter.
Questions for the listing agent
- It's been on market 66 days. Have you received any prior offers? Is the seller open to a 6% concession, seller financing, or rate buy-down credit?
- Built in 1979 — when were the roof, HVAC, electrical panel, plumbing, and water heater last replaced?
- Why hasn't it sold? Are there any deal-killer items the seller is aware of (foundation, flood, title, zoning, code violations)?
- Is there a deadline driving the sale (1031 exchange, divorce, estate, relocation)? That informs how much negotiation room exists.
- What's the average days-on-market for RENTAL listings here right now (not sales)? A rising rental-DOM trend means longer vacancies and softer asking-rent achievability than the comps imply.
- What's the recent tenant-quality profile in this submarket — average credit score on applications, eviction rate, late-payment / NSF rate, and stable-employment percentage? A property-management company in the area should have these aggregated.
- How much new for-sale + rental construction is in the pipeline within 1–3 miles? Heavy new supply typically softens prices + rents 12–24 months out; constrained supply supports both.
Investment metrics
- 1% rule
- 0.95% ✗
- Cap rate
- 7.57%
- Cash-on-cash
- 4.55%
- DSCR
- 1.20
- GRM
- 8.8
CMA / ARV
- ARV (on-the-fly)
- $278,640
- Comps found
- 12
Show comp detail 12 sales within ~0.75 mi
| Address | Dist | Beds/Ba | Sqft | Sold | Price | $/sf | Match |
|---|---|---|---|---|---|---|---|
| 7525 Turnberry Ct | 0.17mi | 3/2.5 | 1,614 (-6%) | 0mo | $247,000 | $153 | 78 |
| 7545 Turnberry Ct | 0.22mi | 3/2.0 | 1,584 (-8%) | 2mo | $285,000 | $180 | 73 |
| 7416 Troon Dr | 0.36mi | 4/2.0 (+1) | 1,680 (-2%) | 0mo | $280,000 | $167 | 72 |
| 6633 Muirfield Way | 0.44mi | 4/2.5 (+1) | 1,662 (-3%) | 5mo | $265,000 | $159 | 60 |
| 6612 Muirfield Way | 0.45mi | 3/1.5 | 1,836 (+7%) | 9mo | $209,000 | $114 | 60 |
| 6820 Inverness Way | 0.51mi | 4/2.0 (+1) | 1,604 (-7%) | 3mo | $260,000 | $162 | 56 |
| 7746 Inverness Dr | 0.44mi | 4/1.5 (+1) | 1,914 (+11%) | 3mo | $189,900 | $99 | 53 |
| 7509 Gunyon Ct | 0.51mi | 3/2.5 | 1,520 (-12%) | 4mo | $280,000 | $184 | 49 |
| 7843 Almond Dr | 0.63mi | 4/2.5 (+1) | 1,868 (+9%) | 3mo | $275,000 | $147 | 45 |
| 6324 Muirfield Way | 0.67mi | 3/2.0 | 1,499 (-13%) | 2mo | $260,000 | $173 | 44 |
| 7556 Gunyon Ct | 0.60mi | 3/2.0 | 1,500 (-13%) | 9mo | $260,000 | $173 | 41 |
| 6351 E Southport Rd | 0.65mi | 3/1.0 | 1,968 (+14%) | 7mo | $249,900 | $127 | 38 |
Match score weights: distance 35% · size 25% · config 20% · recency 20%. Top-matched comps best support the ARV.
Projected returns pro-forma
-3.0% appreciation · 3.78% rent growth · sell at horizon
- IRR
- -8.4%
- Equity multiple
- 0.69×
- Total profit
- $-21,758
- Equity at exit
- $37,276
- IRR
- 2.0%
- Equity multiple
- 1.15×
- Total profit
- $10,530
- Equity at exit
- $21,615
Cash invested: $70,000 (down + closing). Projections, not guarantees.
Landlord ↔ Tenant lean methodology
- Overall (STATE)
- 90 Strongly Landlord-Friendly
- State Indiana
- 90 Strongly Landlord-Friendly · R+11
- County
- — inherits STATE
- City
- — inherits STATE
ZIP-level market 46237
- Rents YoY
- 3.8%
- Active inventory
- 270
- Price-to-rent
- 8.8×
Monthly cashflow live
- Estimated rent
- $2,379 high interval (Pro) →
- Mortgage (P&I)
- −$1,311
- Tax from tax record
- −$199 /mo · $2,389/yr
- Insurance
- −$104
- HOA
- −$0
- Vacancy / Maint / Mgmt
- −$500
- Net cashflow
- $265
Break-even live
Sensitivity live
| Price | -10% $407 | -5% $336 | +0% $265 | +5% $195 | +10% $124 |
|---|---|---|---|---|---|
| Rent | -10% $77 | -5% $171 | +0% $265 | +5% $359 | +10% $453 |
| Rate | -1.0pp $391 | -0.5pp $329 | base $265 | +0.5pp $201 | +1.0pp $135 |
UW: 25.0% down · 7.5% · 30yr · 1.5% tax · 5.0% vac · 8.0% maint · 8.0% mgmt
Financing live
Cash to close
- Down payment
- $62,500
- Closing costs
- $7,500
- Reserves months
- —
- Total cash needed
- —
Loan-product check · same deal, 3 products live
Conventional
25% down · 7.5% · 30yr
- Down + closing
- —
- Monthly P&I
- —
- Monthly cashflow
- —
- DSCR
- —
- Eligible?
- —
Personal DTI + credit; lowest rate.
DSCR
20% down · 8.5% · 30yr
- Down + closing
- —
- Monthly P&I
- —
- Monthly cashflow
- —
- DSCR
- —
- Eligible?
- —
No personal income docs; deal must DSCR.
Hard money
10% down · 12.0% · 12mo
- Down + closing
- —
- Monthly P&I
- —
- Monthly cashflow
- —
- DSCR
- —
- Eligible?
- —
Short-term bridge; refi at stabilization.
Rent comps 6 comps
| Address | Beds | Baths | Sqft | Rent | $/sqft | DOM | Units | Dist |
|---|---|---|---|---|---|---|---|---|
| 6210 Carrie Cir Indianapolis, IN | 3.0 | 2.0 | 1226 | $1,890 | $1.54 | 5d | 1 | 0.71mi |
| 6404 Amarillo Way Indianapolis, IN | 3.0 | 2.0 | 1494 | $1,845 | $1.23 | 5d | 1 | 0.86mi |
| 8107 Southern Trails Pl Indianapolis, IN | 4.0 | 2.0 | 1746 | $2,000 | $1.15 | 6d | 1 | 0.87mi |
| 7825 Jaclyn Dr Indianapolis, IN | 3.0 | 2.0 | 1244 | $1,875 | $1.51 | 5d | 1 | 0.88mi |
| 7703 Janel Ct Indianapolis, IN | 4.0 | 2.5 | 1824 | $4,950 | $2.71 | 25d | 1 | 0.90mi |
| 8130 Amble Way Indianapolis, IN | 3.0 | 2.5 | 2144 | $1,955 | $0.91 | 5d | 1 | 0.99mi |
Listing history 11 events
-
2026-05-24status Pending
-
2026-05-07price $250,000
-
2026-04-23price $254,000
-
2026-03-24status Active
-
2026-03-11$262,000 Active
-
2026-02-25soldstatus $221,600
-
2025-08-16status Pending
-
2025-07-27$224,900 Active
-
2019-07-25soldstatus $152,500 Sold 755-char remark
Show marketing remark (755 chars)
Located in the Muirfield community, 3 bedroom, 3 full bathroom Bi-Level home. Explore this home via interactive 3D home tour, complete with floor plans, video & more. Kitchen features new laminate flooring, ceramic tile back splash, a center island and just a step out to the multi level wood decks. Family room on lower level with wood burning fire place for enjoyment. Living room on upper level with open concept to dining room. Master suite with a step-in shower and newly added spacious sitting room. 1 car attached garage with bonus room on lower level for unlimited possibilities. Outdoor entertaining galore, with upper & lower level large wood decks, basketball court with a fully fenced in back yard. Great location in Franklin Township!
-
2019-06-27$155,000 755-char remark
Show marketing remark (755 chars)
Located in the Muirfield community, 3 bedroom, 3 full bathroom Bi-Level home. Explore this home via interactive 3D home tour, complete with floor plans, video & more. Kitchen features new laminate flooring, ceramic tile back splash, a center island and just a step out to the multi level wood decks. Family room on lower level with wood burning fire place for enjoyment. Living room on upper level with open concept to dining room. Master suite with a step-in shower and newly added spacious sitting room. 1 car attached garage with bonus room on lower level for unlimited possibilities. Outdoor entertaining galore, with upper & lower level large wood decks, basketball court with a fully fenced in back yard. Great location in Franklin Township!
-
2019-06-27historical 755-char remark
Show marketing remark (755 chars)
Located in the Muirfield community, 3 bedroom, 3 full bathroom Bi-Level home. Explore this home via interactive 3D home tour, complete with floor plans, video & more. Kitchen features new laminate flooring, ceramic tile back splash, a center island and just a step out to the multi level wood decks. Family room on lower level with wood burning fire place for enjoyment. Living room on upper level with open concept to dining room. Master suite with a step-in shower and newly added spacious sitting room. 1 car attached garage with bonus room on lower level for unlimited possibilities. Outdoor entertaining galore, with upper & lower level large wood decks, basketball court with a fully fenced in back yard. Great location in Franklin Township!
ⓘ Source: listings_history table (triggers on properties + properties_extension) + one-shot
backfill from property_details.listing_events for pre-trigger history.
Tax reassessment forecast IN · Partial reset (capped growth)
- Current annual tax
- $2,389 · $199/mo
- Projected year-2 tax
- $2,389 · $199/mo
- Expected delta
- $0/yr ($0/mo · 0.0%)
ⓘ Screening estimate from a state-policy table — verify with the county assessor before closing.
Climate risk First Street
- Flood 1/10 Low FEMA zone X (unshaded) · 0% chance over 30 yrs
- Wildfire 1/10 Low
- Heat 3/10 Moderate 7 d/yr ≥102°F today · 19 d/yr by 30 yrs out
- Wind 2/10 Low 100% chance of damaging wind over 30 yrs
- Air quality 2/10 Low 1 unhealthy d/yr today · 2 by 30 yrs out
Nearby sold comps map
Loading sold comps map…
Walkable amenities ~0.75 mi
Loading nearby amenities…
Taxation est. · year 1
- Rental income
- $28,553
- − Mortgage interest
- −$14,004
- − Property taxes
- −$2,389
- − Insurance
- −$1,250
- − Repairs & maintenance
- −$2,284
- − Management
- −$2,284
- − Depreciation
- −$7,273
- Taxable loss
- −$932
- Est. tax savings @ 24.0%
- +$224
- After-tax cash flow
- $3,409/yr
For passive investors: Depreciation is non-cash, so a rental often shows a tax loss while cash-flowing — sheltering income. Rental losses are passive: they offset passive income freely, and up to $25,000/yr can offset ordinary (W-2) income if you actively participate and your MAGI is under $100k (phasing out to $0 by $150k); unused losses carry forward. On sale, claimed depreciation is recaptured at up to 25%, and gains may owe capital-gains tax (a 1031 exchange can defer both). Figures are a year-1 estimate at your 24.0% rate — not tax advice; consult a CPA.
Schools (NCES district)
- District
- Franklin Township Community School Corporation
- NCES district ID
- 1803750
- Math proficiency
- 42% ▼ -12.00%
- Reading proficiency
- 47% ▼ -6.00%
- Median HH income
- $67,825
- Composite
- 39.91/100
- National rank
- #3852
- State rank
- #87 of 301 in IN
Livability — Indianapolis city (balance)
No livability data for this city. (Only ~50 U.S. cities are tracked.)
Census & demographics
- Census place
- Indianapolis city (balance), IN
- County
- Marion County · 998,460 people
- City population
- 881,119
- Metro
- Indianapolis-Carmel-Anderson, IN
- Population (ZIP)
- 43,473
- Household income
- $79,078
- Rent vs Own
- Severe rent burden
- 1245.0
Population outlook (Marion County) Hauer SSP2
- Today (2025)
- 1,025,572 people
- By 2030
- 1,065,727 · +3.9%
- By 2040
- 1,141,577 · +11.3%
- By 2050
- 1,208,920 · +17.9%
- By 2075
- 1,367,288 · +33.3%
- By 2100
- 1,438,201 · +40.2%
Race, ethnicity, and origin ACS 2023
- Neighborhood character
- Predominantly White (71%)
- Race & ethnicity
- White 71% Asian 13% Hispanic / Latino 7% Two or more races 6% Black 5%
- Hispanic origin (detail)
- Mexican 6%
- Common ancestry
- Italian 2% Lithuanian 2% Romanian 2%
- Foreign-born
- 12% · Canada, Philippines
- Languages at home
- 84% English-only · Other Asian/Pacific 5% Spanish 5% Other Indo-European 4%
Political lean MEDSL · Marion
- 2024 margin
- Strong D (+27.7) · D 63.0% · R 35.3% · Other 1.7%
- 2008→2024 swing
- -0.7pp no change · 2008: 28.4pp · 2024: 27.7pp
- All cycles
- 2024: D+27.7 2020: D+29.1 2016: D+22.8 2012: D+22.2 2008: D+28.4
Not yet ingested
- Civics
- —
Market trends
- HPI YoY
- ▼ -180.33%
- Current HPI
- 238.9661
- Rent YoY
- ▲ 3.78%
- Metro
- Indianapolis-Carmel-Anderson, IN
- State GDP YoY
- ▲ 2.90%
- F500 in state
- 18
Industry mix (Fortune 500 HQ in IN)
| Industry | F500 HQs | Revenue |
|---|---|---|
| Industrial Machinery | 2 | $37B |
|
||
| Healthcare | 1 | $177B |
|
||
| Pharmaceuticals | 1 | $45B |
|
||
| Metals / Steel | 1 | $18B |
|
||
| Agriculture | 1 | $17B |
|
||
| Packaging | 1 | $12B |
|
||
Price history
+61.3% since first listed11 events — show timeline
- 2026-05-24 Pending — MIBOR as Distributed by MLS Grid
- 2026-05-07 Price Changed $250,000 MIBOR as Distributed by MLS Grid
- 2026-04-23 Price Changed $254,000 MIBOR as Distributed by MLS Grid
- 2026-03-24 Relisted — MIBOR as Distributed by MLS Grid
- 2026-03-11 Listed $262,000 MIBOR as Distributed by MLS Grid
- 2026-02-25 Sold (Public Records) $221,600 Public Records
- 2025-08-16 Pending — MIBOR as Distributed by MLS Grid
- 2025-07-27 Listed $224,900 MIBOR as Distributed by MLS Grid
- 2019-07-25 Sold (MLS) $152,500 MIBOR as Distributed by MLS Grid
- 2019-06-27 Listed $155,000 MIBOR as Distributed by MLS Grid
- 2019-06-27 Listing Removed — MIBOR as Distributed by MLS Grid
Property tax history
+6.9%/yrLatest (2025): $2,389 · -5.0% YoY. Source: county tax records.
Cash-flow waterfall
monthlySold comps — $/sqft
last 12 mo · ≤1 miLoading sold comps…