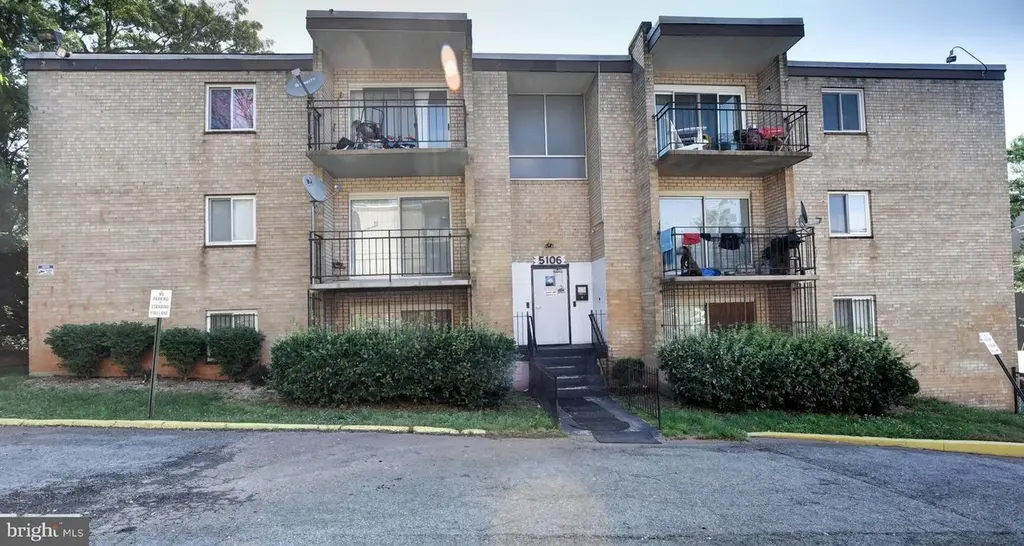
5106 F St SE #8 · Washington, DC
Flood risk 1/10 · Minimal
- FEMA flood zone
- X (unshaded)
- Chance of flooding over 30 yrs
- 0.0%
- Est. flood insurance / yr
- $507 – $1,088
Fire risk 1/10 · Minimal
- Est. fire insurance / yr
- $631 – $1,173
Heat risk 8/10 · Major
- Hot days now (above 103°F)
- 7 days/yr
- Hot days in 30 yrs
- 15 days/yr
Wind risk 4/10 · Minor
- Chance of severe wind over 30 yrs
- 20.0%
Air-quality risk 4/10 · Minor
- Unhealthy air days now
- 4 days/yr
- Unhealthy air days in 30 yrs
- 5 days/yr
Risk factors via First Street. Map © Google.
Why this score? — see what drove the C grade
The composite is a weighted blend of 9 inputs, each scored 0–100. Each bar is that input's sub-score; the figure is the points it added to the 100-point composite (weight × sub-score).
- Cash flow +22.8/30.0
- 1% rule +7.8/10.0
- ARV discount +7.5/15.0
- DSCR +7.3/10.0
- Rent growth +4.0/5.0
- Livability +3.7/5.0
- Schools +3.6/10.0
- Condition / age +2.5/5.0
- Appreciation +0.0/10.0
$159,000
🖨 Deal sheet 📄 Offer letter ✓ Due diligence
Listing remarks
IT DOES NOT GET ANY BETTER THAN THIS!!! CALLING ALL FIRST TIME HOME BUYERS. Also a FANTASTIC INVESTOR OPPORTUNITY. Great starter home or purchase as an investor. Rare Find - 2 Bedrooms with one bath, renovated kitchen with stainless steel appliances, and renovated bath. Living room and dining area with wood floors and a balcony overlooking the front of the building. The owner's bedroom features a large walk-in closet. There is brand new carpet in the bedrooms, freshly painted. Benning Rd Metro Station is a few blocks away. Investors, this is a great opportunity for positive cash flow. Condo Fee = $300.
Key facts
- Wood floors
- Walk-in closet
- Renovated kitchen
Tags
Property features AI
Finance
- Other: Soil type: Urban Land-Beltsville-Chillum
- Financial info: Ownership: Condominium
- HOA & community: Monthly condo fee of $300; Condo fee includes custodial services, common area maintenance, exterior building maintenance, sewer, trash, and water; Community amenities include common grounds and laundry facilities; Pets not allowed
Exterior
- Parking: On-street parking
- Utilities: Public water; Public sewer; Electric service
- Home design: Condominium unit/flat; Marshall Heights building; Entry on the 2nd floor
- Construction: Brick construction; Above grade and below grade structures; Very good condition
- Exterior features: Garden-style building (1–4 floors); No tidal water
Interior
- Bedrooms: 2 bedrooms on main level
- Bathrooms: 1 full bathroom on main level; 1 full bathroom total
- Heating & cooling: Forced air heating; Natural gas heating and hot water; Central air conditioning (electric)
- Interior features: No basement; Assessor-reported living area source
- Laundry & utility: No in-unit washer/dryer hookup
Neighborhood map
What this means for you Summary
Snapshot
- This is a 2-bed/1.0-bath condo listed at $159k.
Deal economics
- At list price, monthly cash flow is $276 ($3k/yr) — positive.
- The deal already cash-flows at list — no discount required.
- Meets the 1% rule at list price ($2k rent vs $159k).
- Recommended offer: $149k (6.0% below list) — sets the bar for market timing.
- Cap rate 8.4% vs local median 2.5% in Washington — top-decile yield for the area; either an underpriced asset or a hidden risk that comps aren't pricing in. Stress-test before assuming the spread holds.
Location & tenants
- Location reads 73/100 on livability (#1 in DC) — a middle-class / working-renter tenant base. Strengths: amenities A+, commute A+, employment A+; Watch: crime F, cost of living F.
- District Of Columbia Public Schools (urban): math 33% / reading 40% proficiency, ranked #8 of 32 in DC (top 25%) — families likely to look elsewhere, expect single-tenant / working-renter base with shorter leases; 65% free/reduced lunch — lower-income household profile, screen leases tightly.
- Market conditions: Rents rising fast (+6.1%/yr); 276 active listings in the ZIP; 40 comparable units currently listed for rent nearby; rentals at typical pace (median 24d on market — plan ~3-4 weeks tenant-placement turnaround); 1,737 units permitted in District of Columbia in 2024 (1,506 in 5+ unit buildings).
- This rent runs 42% of the median local income ($58k/yr) — at the standard rent-burdened threshold; future hikes will face affordability resistance.
Forward outlook
- Local home prices are declining (-3.0%/yr); year-one equity from $1k of loan paydown is wiped out by about $5k of value loss. Plan a longer hold.
- District of Columbia County population projected at +50% by 2050 — long-run rental-demand tailwind backs the buy-and-hold thesis.
- At projected returns (-3.0% appreciation + 6.1% rent growth), your $45k cash investment doubles in ~9 years — after that, you're playing with house money.
Negotiation context
- It's been on market 86 days — a 6% lower offer ($149k) is reasonable based on typical stale-listing flexibility.
- 7 sale attempts since 5y ago; this cycle's ask is 10279% above the opening price — seller raised mid-cycle; expect resistance to lowballs.
- Current owner paid $95k; list at $159k implies a 68% gain — meaningful room to come down on a strong offer.
Risks & watch-outs
- Climate carrying-cost: extreme-heat days projected 7→15/yr by 2055 (HVAC capex compounding) — expect insurance premiums to compound above CPI over the hold.
Questions for the listing agent
- It's been on market 86 days. Have you received any prior offers? Is the seller open to a 6% concession, seller financing, or rate buy-down credit?
- What does the HOA fee cover, when was the last increase, and are there any pending special assessments or reserve-fund shortfalls?
- Any open or pending special assessments — roof, HVAC, plumbing, elevator, façade? What's the per-unit balance and payoff schedule, and is the seller paying it off at close or rolling it to the buyer?
- Why hasn't it sold? Are there any deal-killer items the seller is aware of (foundation, flood, title, zoning, code violations)?
- Is there a deadline driving the sale (1031 exchange, divorce, estate, relocation)? That informs how much negotiation room exists.
- Crime grade is F in this area — have there been break-ins, vandalism, or insurance claims at this property in the last 3 years? What carrier currently insures it and at what premium?
- What's the average days-on-market for RENTAL listings here right now (not sales)? A rising rental-DOM trend means longer vacancies and softer asking-rent achievability than the comps imply.
- What's the recent tenant-quality profile in this submarket — average credit score on applications, eviction rate, late-payment / NSF rate, and stable-employment percentage? A property-management company in the area should have these aggregated.
- How much new apartment / multifamily construction is in the pipeline within 1–3 miles? Heavy new supply (>2% of stock underway) typically softens rents 12–24 months out; light construction supports rent growth.
Investment metrics
- 1% rule
- 1.28% ✓
- Cap rate
- 8.37%
- Cash-on-cash
- 7.43%
- DSCR
- 1.33
- GRM
- 6.5
CMA / ARV
No comps found within radius.
Projected returns pro-forma
-3.0% appreciation · 6.06% rent growth · sell at horizon
- IRR
- -0.9%
- Equity multiple
- 0.97×
- Total profit
- $-1,552
- Equity at exit
- $23,707
- IRR
- 12.3%
- Equity multiple
- 2.13×
- Total profit
- $50,296
- Equity at exit
- $13,747
Cash invested: $44,520 (down + closing). Projections, not guarantees.
Landlord ↔ Tenant lean methodology
- Overall (CITY)
- 0 Strongly Tenant-Friendly
- State District of Columbia
- 12 Strongly Tenant-Friendly · D+43
- County
- — inherits STATE
- City Washington
- 0 Strongly Tenant-Friendly · D+43
ZIP-level market 20019
- Rents YoY
- 6.1%
- Active inventory
- 276
- Price-to-rent
- 6.5×
Monthly cashflow live
- Estimated rent
- $2,043 high interval (Pro) →
- Mortgage (P&I)
- −$834
- Tax from tax record
- −$138 /mo · $1,655/yr
- Insurance
- −$66
- HOA
- −$300
- Vacancy / Maint / Mgmt
- −$429
- Net cashflow
- $276
Break-even live
UW: 25.0% down · 7.5% · 30yr · 1.5% tax · 5.0% vac · 8.0% maint · 8.0% mgmt
Financing live
Cash to close
- Down payment
- $39,750
- Closing costs
- $4,770
- Reserves months
- —
- Total cash needed
- —
Loan-product check · same deal, 3 products live
Conventional
25% down · 7.5% · 30yr
- Down + closing
- —
- Monthly P&I
- —
- Monthly cashflow
- —
- DSCR
- —
- Eligible?
- —
Personal DTI + credit; lowest rate.
DSCR
20% down · 8.5% · 30yr
- Down + closing
- —
- Monthly P&I
- —
- Monthly cashflow
- —
- DSCR
- —
- Eligible?
- —
No personal income docs; deal must DSCR.
Hard money
10% down · 12.0% · 12mo
- Down + closing
- —
- Monthly P&I
- —
- Monthly cashflow
- —
- DSCR
- —
- Eligible?
- —
Short-term bridge; refi at stabilization.
Rent comps 40 comps
| Address | Beds | Baths | Sqft | Rent | $/sqft | DOM | Units | Dist |
|---|---|---|---|---|---|---|---|---|
| 5119 E St SE Washington, DC | 3.0 | 1.0 | 941 | $4,000 | $4.25 | 19d | 1 | 0.01mi |
| 5045 Call Pl SE #203 Washington, DC | 1.0 | 1.0 | 693 | $2,000 | $2.89 | 24d | 1 | 0.16mi |
| 5005 D St SE #104 Washington, DC | 2.0 | 1.0 | 772 | $1,700 | $2.20 | 5d | 1 | 0.18mi |
| 5401 Call Pl SE Washington, DC | 2.0–3.0 | 1.0 | 1094 | $1,575 | $1.44 | 1d | 2 | 0.25mi |
| 5344 C St SE Unit 102 Washington, DC | 3.0 | 2.0 | 1000 | $2,499 | $2.50 | 24d | 1 | 0.26mi |
| 5344 C St SE Unit 302 Washington, DC | 3.0 | 2.0 | 1000 | $2,100 | $2.10 | 24d | 1 | 0.26mi |
| 5031 H St SE Apt 1 Washington, DC | 1.0 | 1.0 | 530 | $1,095 | $2.07 | 13d | 1 | 0.28mi |
| 5031 H St SE Apt 1 Washington, DC | 1.0 | 1.0 | 565 | $1,095 | $1.94 | 1d | 1 | 0.28mi |
| 5031 H St SE Unit 4 Washington, DC | 1.0 | 1.0 | 530 | $1,195 | $2.25 | 24d | 1 | 0.28mi |
| 819 51st St SE Unit 5 Washington, DC | 1.0 | 1.0 | 650 | $1,000 | $1.54 | 7d | 1 | 0.29mi |
| 4732 Benning Rd SE #102 Washington, DC | 1.0 | 1.0 | 581 | $1,150 | $1.98 | 24d | 1 | 0.31mi |
| 324 Saint Louis St SE Washington, DC | 2.0 | 1.0 | 640 | $1,750 | $2.73 | 7d | 1 | 0.32mi |
| 5433 C St SE Unit 4 Washington, DC | 1.0 | 1.0 | 860 | $1,500 | $1.74 | 24d | 1 | 0.33mi |
| 5124 Astor Pl SE Washington, DC | 2.0 | 1.0 | 700 | $1,100 | $1.57 | 24d | 1 | 0.35mi |
| 1193 46th Pl SE Washington, DC | 3.0 | 1.0 | 1056 | $3,200 | $3.03 | 24d | 1 | 0.36mi |
| 4701 Benning Rd SE Washington, DC | 1.0 | 1.0 | 600 | $1,100 | $1.83 | 24d | 1 | 0.37mi |
| 4820 C St SE #304 Washington, DC | 2.0 | 1.0 | 635 | $1,600 | $2.52 | 24d | 1 | 0.39mi |
| 1111 Balboa Ave Capitol Heights, MD | 3.0 | 1.0 | 864 | $2,000 | $2.31 | 18d | 1 | 0.39mi |
| 912 Elfin Ave Capitol Heights, MD | 3.0 | 2.0 | 1028 | $2,000 | $1.95 | 43d | 1 | 0.42mi |
| 4919 A St SE Unit 202 Washington, DC | 2.0 | 1.0 | 625 | $1,900 | $3.04 | 24d | 1 | 0.44mi |
| 4932 A St SE #302 Washington, DC | 2.0 | 2.0 | 1007 | $2,495 | $2.48 | 3d | 1 | 0.46mi |
| 1210 Balboa Ave Unit B Capitol Heights, MD | 2.0 | 1.0 | 858 | $1,095 | $1.28 | 43d | 1 | 0.46mi |
| 1210 Balboa Ave Capitol Heights, MD | 1.0 | 1.0 | 858 | $1,095 | $1.28 | 43d | 1 | 0.46mi |
| 4930 A St SE Unit 203 Washington, DC | 3.0 | 1.0 | 750 | $2,815 | $3.75 | 24d | 1 | 0.47mi |
| 1201 Benning Rd Capitol Heights, MD | 1.0–3.0 | 1.0 | 854 | $1,594 | $1.87 | 1d | 36 | 0.52mi |
| 44 49th St SE Unit A1 Washington, DC | 3.0 | 1.0 | 793 | $2,499 | $3.15 | 24d | 1 | 0.52mi |
| 4511 B St SE Washington, DC | 1.0–2.0 | 1.0 | 675 | $1,650 | $2.44 | 24d | 2 | 0.59mi |
| 4473 B St SE #304 Washington, DC | 2.0 | 1.0 | 775 | $1,999 | $2.58 | 21d | 1 | 0.63mi |
| 608 Chaplin St SE Washington, DC | 3.0 | 2.0 | 832 | $2,200 | $2.64 | 17d | 1 | 0.67mi |
| 4615 Central Ave NE Unit B Washington, DC | 2.0 | 1.0 | 875 | $1,450 | $1.66 | 24d | 1 | 0.70mi |
| 4427 A St SE Unit 1 Washington, DC | 2.0 | 1.0 | 920 | $1,900 | $2.07 | 24d | 1 | 0.70mi |
| 4332 Gorman Ter SE Washington, DC | 2.0 | 1.0 | 832 | $2,350 | $2.82 | 21d | 1 | 0.74mi |
| 4805 Texas Ave SE Washington, DC | 1.0–2.0 | 1.0 | 775 | $1,400 | $1.81 | 24d | 1 | 0.75mi |
| 22 Chamber Ave Capitol Heights, MD | 3.0 | 1.0 | 942 | $3,000 | $3.18 | 43d | 1 | 0.76mi |
| 4601 Blaine St NE Unit 1 Washington, DC | 2.0 | 1.0 | 750 | $1,500 | $2.00 | 24d | 1 | 0.82mi |
| 4213 Hildreth St SE Washington, DC | 2.0 | 1.5 | 832 | $2,500 | $3.00 | 24d | 1 | 0.82mi |
| 429 Burbank St SE Apt 4 Washington, DC | 1.0 | 1.0 | 594 | $1,235 | $2.08 | 24d | 1 | 0.83mi |
| 4348 Southern Ave SE Unit Radiance Washington, DC | 2.0 | 1.0 | 550 | $2,200 | $4.00 | 18d | 1 | 0.85mi |
| 4348 Southern Ave SE Washington, DC | 2.0 | 1.0 | 650 | $2,300 | $3.54 | 24d | 1 | 0.85mi |
| 4348 Southern Ave SE Washington, DC | 3.0 | 1.0 | 860 | $2,400 | $2.79 | 18d | 1 | 0.85mi |
HOA detail condo
- Monthly dues
- $300 · $3,600/yr
- Assessments
- None detected in remarks — confirm with the listing agent.
Listing history 33 events
-
2026-06-18days on market $159,000 Active 86 DOM
-
2026-06-17days on market $159,000 Active 85 DOM
-
2026-06-16days on market $159,000 Active 84 DOM
-
2026-06-15days on market $159,000 Active 83 DOM
-
2026-06-13days on market $159,000 Active 81 DOM
-
2026-06-09days on market $159,000 Active 77 DOM
-
2026-06-08days on market $159,000 Active 76 DOM
-
2026-06-07days on market $159,000 Active 75 DOM
-
2026-06-04days on market $159,000 Active 72 DOM
-
2026-06-03days on market $159,000 Active 71 DOM
-
2026-06-02days on market $159,000 Active 70 DOM
-
2026-06-01days on market $159,000 Active 69 DOM
-
2026-05-31days on market $159,000 Active 68 DOM
-
2026-05-16price $1,432
-
2026-04-29$1,532
-
2026-04-28historical $1,532
-
2026-04-23$1,532
-
2026-03-24$159,000 Active
-
2024-08-01historical
-
2024-06-29price $109,900
-
2024-03-21price $139,000
-
2023-10-27price $155,000
-
2023-10-24$169,900 Active
-
2023-09-30historical
-
2023-07-30price $169,900
-
2023-06-01$185,000 Active
-
2021-08-31historical
-
2021-06-07$185,000 Active
-
2021-05-07historical
-
2021-03-31price $199,900
-
2021-03-07$210,000 Active
-
2003-11-07soldstatus $94,530
-
2003-11-07soldstatus $94,530
ⓘ Source: listings_history table (triggers on properties + properties_extension) + one-shot
backfill from property_details.listing_events for pre-trigger history.
Tax reassessment forecast DC · Partial reset (capped growth)
- Current annual tax
- $1,655 · $138/mo
- Projected year-2 tax
- $1,655 · $138/mo
- Expected delta
- $0/yr ($0/mo · -0.0%)
ⓘ Screening estimate from a state-policy table — verify with the county assessor before closing.
Climate risk First Street
- Flood 1/10 Low FEMA zone X (unshaded) · 0% chance over 30 yrs
- Wildfire 1/10 Low
- Heat 8/10 Severe 7 d/yr ≥103°F today · 15 d/yr by 30 yrs out
- Wind 4/10 Moderate 20% chance of damaging wind over 30 yrs
- Air quality 4/10 Moderate 4 unhealthy d/yr today · 5 by 30 yrs out
Nearby sold comps map
Loading sold comps map…
Walkable amenities ~0.75 mi
Loading nearby amenities…
Taxation est. · year 1
- Rental income
- $24,511
- − Mortgage interest
- −$8,906
- − Property taxes
- −$1,655
- − Insurance
- −$795
- − Repairs & maintenance
- −$1,961
- − Management
- −$1,961
- − HOA
- −$3,600
- − Depreciation
- −$4,625
- Taxable income
- $1,007
- Est. tax owed @ 24.0%
- −$242
- After-tax cash flow
- $3,066/yr
For passive investors: Depreciation is non-cash, so a rental often shows a tax loss while cash-flowing — sheltering income. Rental losses are passive: they offset passive income freely, and up to $25,000/yr can offset ordinary (W-2) income if you actively participate and your MAGI is under $100k (phasing out to $0 by $150k); unused losses carry forward. On sale, claimed depreciation is recaptured at up to 25%, and gains may owe capital-gains tax (a 1031 exchange can defer both). Figures are a year-1 estimate at your 24.0% rate — not tax advice; consult a CPA.
Schools (NCES district)
- District
- District Of Columbia Public Schools
- NCES district ID
- 1100030
- Math proficiency
- 33% ▲ 3.00%
- Reading proficiency
- 40% ▲ 5.00%
- Median HH income
- $67,671
- Composite
- 35.84/100
- National rank
- #9606
- State rank
- #8 of 32 in DC
Livability — Washington
- Score
- 73/100
- State rank
- #1
- US rank
- #5327
Category grades
Schools grade is shown separately in the Schools card above.
Census & demographics
- Census place
- Washington, DC
- County
- District of Columbia · 671,873 people
- City population
- 671,873
- Metro
- Washington-Arlington-Alexandria, DC-VA-MD-WV
- Population (ZIP)
- 63,380
- Household income
- $58,296
- Rent vs Own
- Severe rent burden
- 5115.0
Population outlook (District of Columbia County) Hauer SSP2
- Today (2025)
- 821,926 people
- By 2030
- 899,517 · +9.4%
- By 2040
- 1,061,162 · +29.1%
- By 2050
- 1,231,493 · +49.8%
- By 2075
- 1,603,312 · +95.1%
- By 2100
- 1,847,141 · +124.7%
Race, ethnicity, and origin ACS 2023
- Neighborhood character
- Predominantly Black (87%)
- Race & ethnicity
- Black 87% Hispanic / Latino 7% Two or more races 4% White 2%
- Hispanic origin (detail)
- Mexican 1% Dominican 1%
- Foreign-born
- 6% · Canada
- Languages at home
- 91% English-only · Spanish 6% French/Haitian/Cajun 1%
Political lean MEDSL · District of Columbia
- 2024 margin
- Solid D (+86.1) · D 91.2% · R 5.1% · Other 3.8%
- 2008→2024 swing
- +0.1pp no change · 2008: 85.9pp · 2024: 86.1pp
- All cycles
- 2024: D+86.1 2020: D+86.8 2016: D+88.7 2012: D+84.2 2008: D+85.9
Not yet ingested
- Civics
- —
Market trends
- HPI YoY
- ▼ -416.91%
- Current HPI
- 326.4481
- Rent YoY
- ▲ 6.06%
- Metro
- Washington-Arlington-Alexandria, DC-VA-MD-WV
- State GDP YoY
- ▲ 1.33%
- F500 in state
- 6
Industry mix (Fortune 500 HQ in DC)
| Industry | F500 HQs | Revenue |
|---|---|---|
| Financial Services | 1 | $153B |
|
||
| Life Sciences / Industrials | 1 | $25B |
|
||
| Industrial Machinery | 1 | $8B |
|
||
Price history
-98.5% since first listed20 events — show timeline
- 2026-05-16 Price Changed $1,432 TURBOTENANT
- 2026-04-29 Listed for Rent $1,532 TURBOTENANT
- 2026-04-28 Rental Removed $1,532 TURBOTENANT
- 2026-04-23 Listed for Rent $1,532 TURBOTENANT
- 2026-03-24 Listed $159,000 BRIGHT MLS
- 2024-08-01 Listing Removed — BRIGHT MLS
- 2024-06-29 Price Changed $109,900 BRIGHT MLS
- 2024-03-21 Price Changed $139,000 BRIGHT MLS
- 2023-10-27 Price Changed $155,000 BRIGHT MLS
- 2023-10-24 Listed $169,900 BRIGHT MLS
- 2023-09-30 Listing Removed — BRIGHT MLS
- 2023-07-30 Price Changed $169,900 BRIGHT MLS
- 2023-06-01 Listed $185,000 BRIGHT MLS
- 2021-08-31 Listing Removed — BRIGHT MLS
- 2021-06-07 Listed $185,000 BRIGHT MLS
- 2021-05-07 Listing Removed — BRIGHT MLS
- 2021-03-31 Price Changed $199,900 BRIGHT MLS
- 2021-03-07 Listed $210,000 BRIGHT MLS
- 2003-11-07 Sold (Public Records) $94,530 Public Records
- 2003-11-07 Sold (Public Records) $94,530 Public Records
Property tax history
+2.4%/yrLatest (2025): $1,655 · -2.4% YoY. Source: county tax records.
Cash-flow waterfall
monthlySold comps — $/sqft
last 12 mo · ≤1 miLoading sold comps…