 Duplex
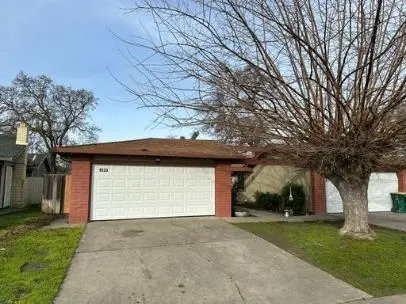
9523 - 9525 Cody Way · Stockton, CA
Flood risk 1/10 · Minimal
- FEMA flood zone
- X
- Chance of flooding over 30 yrs
- 0.0%
- Est. flood insurance / yr
- $507 – $1,088
Fire risk 1/10 · Minimal
- Est. fire insurance / yr
- $659 – $1,223
Heat risk 7/10 · Major
- Hot days now (above 102°F)
- 7 days/yr
- Hot days in 30 yrs
- 15 days/yr
Wind risk 1/10 · Minimal
- Chance of severe wind over 30 yrs
- —
Air-quality risk 10/10 · Severe
- Unhealthy air days now
- 30 days/yr
- Unhealthy air days in 30 yrs
- 30 days/yr
Risk factors via First Street. Map © Google.
Why this score? — see what drove the D grade
The composite is a weighted blend of 9 inputs, each scored 0–100. Each bar is that input's sub-score; the figure is the points it added to the 100-point composite (weight × sub-score).
- Cash flow +14.9/30.0
- ARV discount +7.5/15.0
- DSCR +4.5/10.0
- Rent growth +3.2/5.0
- Livability +2.9/5.0
- 1% rule +2.8/10.0
- Schools +2.7/10.0
- Condition / age +2.5/5.0
- Appreciation +0.0/10.0
$569,000
🖨 Deal sheet 📄 Offer letter ✓ Due diligence
Multi-family units
County records classify this as Multi-Family (2-4 Unit). Listing-text estimate: 2 units. confirmed
Listing remarks MLS
Good Investment! In good condition and priced below market. Each unit has 3 bedrooms, 2 baths and a 2 car garage. Tenants pay all utilities. Section 8. No residential behind the duplex. Make offer subject to viewing. Won't last long!
Key facts
- Strong rental appeal
- 6,499 sq ft lot
- Garage
Tags
Property features AI
Finance
- HOA & community: No homeowners association
Exterior
- Parking: Garage with space for 4 vehicles (total)
- Utilities: Public water; Public sewer; No irrigation
- Home design: Duplex (residential income/apartments); Built in 1979; Single-story; Address: 9523-9525 Cody Way, Stockton, CA 95209
- Construction: Year built 1979
- Exterior features: Lot approximately 0.15 acres; No special lot features listed
Interior
- Kitchen: No kitchen appliance details provided
- Bedrooms: Two 3-bedroom units
- Flooring: Laminate
- Bathrooms: Each unit has 2 full bathrooms
- Heating & cooling: Central heating; Central cooling
- Interior features: Laminate flooring; One-story layout
- Laundry & utility: Laundry in each unit
Neighborhood map
What this means for you Summary
Snapshot
- This is a 2 × 3-bed/2.0-bath units multifamily listed at $569k.
Deal economics
- At list price, monthly cash flow is $162 ($2k/yr) — positive. Per door: $81/mo.
- The deal already cash-flows at list — no discount required.
- To meet the 1% rule (rent ≥ 1% of price), the offer needs to be $447k (21.5% below list).
- Recommended offer: $447k (21.5% below list) — sets the bar for 1% rule.
- Cap rate 6.6% vs local median 3.6% in Stockton — top-decile yield for the area; either an underpriced asset or a hidden risk that comps aren't pricing in. Stress-test before assuming the spread holds.
Location & tenants
- Location reads 57/100 on livability (#734 in CA) — a working-class tenant base; expect higher turnover. Strengths: housing A+, health & safety A, amenities A-; Watch: employment C-, schools D-, crime F.
- Lodi Unified (urban): math 24% / reading 36% proficiency, ranked #325 of 517 in CA (top 63%) — families likely to look elsewhere, expect single-tenant / working-renter base with shorter leases.
- Market conditions: Rents rising (+2.9%/yr); 116 active listings in the ZIP; solid renter incomes; 3,779 units permitted in San Joaquin County in 2024 (0 in 5+ unit buildings).
- At $4,466/mo this rent would consume 49% of the median local household income ($109k/yr) (locally 719% of renters already pay >50% of income on rent) — very limited rent-growth headroom before tenants either downsize or default.
Forward outlook
- Local home prices are declining (-3.0%/yr); year-one equity from $4k of loan paydown is wiped out by about $17k of value loss. Plan a longer hold.
- San Joaquin County population projected at +17% by 2050 — long-run rental-demand tailwind backs the buy-and-hold thesis.
Negotiation context
- It's been on market 15 days — a 2% lower offer ($560k) is reasonable based on typical stale-listing flexibility.
- 3 sale attempts since 21y ago; this cycle's ask is 28350% above the opening price — seller raised mid-cycle; expect resistance to lowballs.
- Current owner paid $415k; 37% above their basis — modest negotiation headroom, anchor on the comps not their cost.
Risks & watch-outs
- Climate carrying-cost: extreme-heat days projected 7→15/yr by 2055 (HVAC capex compounding) — expect insurance premiums to compound above CPI over the hold.
Questions for the listing agent
- Can we see the unit-by-unit rent roll, current vacancy, and any below-market leases? What's the average tenancy length?
- What capital expenditures (roof, boiler, parking lot, exteriors) have been made in the last 5 years, and what's planned in the next 2?
- Built in 1979 — when were the roof, HVAC, electrical panel, plumbing, and water heater last replaced?
- Is there a deadline driving the sale (1031 exchange, divorce, estate, relocation)? That informs how much negotiation room exists.
- Schools are D-rated, which usually means shorter tenancies and higher turnover. Who's the typical renter profile here, and what's been the actual vacancy rate?
- Crime grade is F in this area — have there been break-ins, vandalism, or insurance claims at this property in the last 3 years? What carrier currently insures it and at what premium?
- The area grade is low — what's the realistic commute time and amenity access for the typical tenant pool here? Any planned neighborhood developments (good or bad) we should know about?
- What's the average days-on-market for RENTAL listings here right now (not sales)? A rising rental-DOM trend means longer vacancies and softer asking-rent achievability than the comps imply.
- What's the recent tenant-quality profile in this submarket — average credit score on applications, eviction rate, late-payment / NSF rate, and stable-employment percentage? A property-management company in the area should have these aggregated.
- How much new apartment / multifamily construction is in the pipeline within 1–3 miles? Heavy new supply (>2% of stock underway) typically softens rents 12–24 months out; light construction supports rent growth.
Investment metrics
- 1% rule
- 0.78% ✗
- Cap rate
- 6.63%
- Cash-on-cash
- 1.22%
- DSCR
- 1.05
- GRM
- 10.6
CMA / ARV
No comps found within radius.
Projected returns pro-forma
-3.0% appreciation · 2.89% rent growth · sell at horizon
- IRR
- -14.5%
- Equity multiple
- 0.48×
- Total profit
- $-82,656
- Equity at exit
- $84,840
- IRR
- -6.1%
- Equity multiple
- 0.61×
- Total profit
- $-61,848
- Equity at exit
- $49,197
Cash invested: $159,320 (down + closing). Projections, not guarantees.
Landlord ↔ Tenant lean methodology
- Overall (STATE)
- 18 Strongly Tenant-Friendly
- State California
- 18 Strongly Tenant-Friendly · D+13
- County
- — inherits STATE
- City
- — inherits STATE
ZIP-level market 95209
- Rents YoY
- 2.9%
- Active inventory
- 116
- Price-to-rent
- 21.2×
Monthly cashflow live
- Estimated rent
- $4,466 high interval (Pro) →
- Mortgage (P&I)
- −$2,984
- Tax from tax record
- −$145 /mo · $1,741/yr
- Insurance
- −$237
- HOA
- −$0
- Vacancy / Maint / Mgmt
- −$938
- Net cashflow
- $162
Break-even live
Sensitivity live
| Price | -10% $484 | -5% $323 | +0% $162 | +5% $1 | +10% $-160 |
|---|---|---|---|---|---|
| Rent | -10% $-191 | -5% $-14 | +0% $162 | +5% $338 | +10% $515 |
| Rate | -1.0pp $449 | -0.5pp $307 | base $162 | +0.5pp $15 | +1.0pp $-135 |
2-unit breakdown (identical units grouped — click to expand)
| Units | Beds | Baths | Est. rent |
|---|---|---|---|
| 2× units | 3 | 2 | $4,466 |
| #1 | 3 | 2 | $2,233 |
| #2 | 3 | 2 | $2,233 |
| Total (2 units) | $4,466 | ||
UW: 25.0% down · 7.5% · 30yr · 1.5% tax · 5.0% vac · 8.0% maint · 8.0% mgmt
Financing live
Cash to close
- Down payment
- $142,250
- Closing costs
- $17,070
- Reserves months
- —
- Total cash needed
- —
Loan-product check · same deal, 3 products live
Conventional
25% down · 7.5% · 30yr
- Down + closing
- —
- Monthly P&I
- —
- Monthly cashflow
- —
- DSCR
- —
- Eligible?
- —
Personal DTI + credit; lowest rate.
DSCR
20% down · 8.5% · 30yr
- Down + closing
- —
- Monthly P&I
- —
- Monthly cashflow
- —
- DSCR
- —
- Eligible?
- —
No personal income docs; deal must DSCR.
Hard money
10% down · 12.0% · 12mo
- Down + closing
- —
- Monthly P&I
- —
- Monthly cashflow
- —
- DSCR
- —
- Eligible?
- —
Short-term bridge; refi at stabilization.
Listing history 11 events
-
2026-06-18days on market $569,000 Active 15 DOM
-
2026-06-17days on market $569,000 Active 14 DOM
-
2026-06-16days on market $569,000 Active 13 DOM
-
2026-06-15days on market $569,000 Active 12 DOM
-
2026-06-14days on market $569,000 Active 10 DOM
-
2026-06-10days on market $569,000 Active 7 DOM
-
2026-06-09days on market $569,000 Active 6 DOM
-
2026-06-08days on market $569,000 Active 5 DOM
-
2026-06-07days on market $569,000 Active 4 DOM
-
2026-06-03remarks 578-char remark
-
2026-06-03$569,000 Active 1 DOM
ⓘ Source: listings_history table (triggers on properties + properties_extension) + one-shot
backfill from property_details.listing_events for pre-trigger history.
Tax reassessment forecast CA · Resets to sale price
- Current annual tax
- $1,741 · $145/mo
- Projected year-2 tax
- $4,324 · $360/mo
- Expected delta
- +$2,583/yr (+$215/mo · 148.3%)
ⓘ Screening estimate from a state-policy table — verify with the county assessor before closing.
Climate risk First Street
- Flood 1/10 Low FEMA zone X · 0% chance over 30 yrs
- Wildfire 1/10 Low
- Heat 7/10 Severe 7 d/yr ≥102°F today · 15 d/yr by 30 yrs out
- Wind 1/10 Low
- Air quality 10/10 Extreme 30 unhealthy d/yr today · 30 by 30 yrs out
Nearby sold comps map
Loading sold comps map…
Walkable amenities ~0.75 mi
Loading nearby amenities…
Taxation est. · year 1
- Rental income
- $53,592
- − Mortgage interest
- −$31,873
- − Property taxes
- −$1,741
- − Insurance
- −$2,845
- − Repairs & maintenance
- −$4,287
- − Management
- −$4,287
- − Depreciation
- −$16,553
- Taxable loss
- −$7,995
- Est. tax savings @ 24.0%
- +$1,919
- After-tax cash flow
- $3,863/yr
For passive investors: Depreciation is non-cash, so a rental often shows a tax loss while cash-flowing — sheltering income. Rental losses are passive: they offset passive income freely, and up to $25,000/yr can offset ordinary (W-2) income if you actively participate and your MAGI is under $100k (phasing out to $0 by $150k); unused losses carry forward. On sale, claimed depreciation is recaptured at up to 25%, and gains may owe capital-gains tax (a 1031 exchange can defer both). Figures are a year-1 estimate at your 24.0% rate — not tax advice; consult a CPA.
Schools (NCES district)
- District
- Lodi Unified
- NCES district ID
- 0622230
- Math proficiency
- 24% ▼ -8.00%
- Reading proficiency
- 36% ▼ -8.00%
- Median HH income
- $57,165
- Composite
- 26.84/100
- National rank
- #7108
- State rank
- #325 of 517 in CA
Livability — Stockton
- Score
- 57/100
- State rank
- #734
- US rank
- #21638
Category grades
Schools grade is shown separately in the Schools card above.
Census & demographics
- Census place
- Stockton, CA
- County
- San Joaquin County · 729,570 people
- City population
- 332,006
- Metro
- Stockton, CA
- Population (ZIP)
- 47,409
- Household income
- $108,675
- Rent vs Own
- Severe rent burden
- 719.0
Population outlook (San Joaquin County) Hauer SSP2
- Today (2025)
- 796,965 people
- By 2030
- 828,849 · +4.0%
- By 2040
- 885,611 · +11.1%
- By 2050
- 929,798 · +16.7%
- By 2075
- 994,578 · +24.8%
- By 2100
- 971,291 · +21.9%
Race, ethnicity, and origin ACS 2023
- Neighborhood character
- Highly diverse neighborhood (Simpson 0.76)
- Race & ethnicity
- Hispanic / Latino 35% White 25% Two or more races 23% Asian 22% Black 11% Native American 2%
- Hispanic origin (detail)
- Mexican 30% Puerto Rican 2%
- Common ancestry
- Russian 2% Italian 2% Lithuanian 1%
- Foreign-born
- 20% · Canada, Vietnam, China
- Languages at home
- 62% English-only · Spanish 21% Other Asian/Pacific 5% Tagalog/Filipino 4%
Political lean MEDSL · San Joaquin
- 2024 margin
- Toss-up / Even · D 48.0% · R 48.9% · Other 3.0%
- 2008→2024 swing
- -11.6pp toward R · 2008: 10.7pp · 2024: -0.9pp
- All cycles
- 2024: R+0.9 2020: D+13.9 2016: D+12.9 2012: D+8.9 2008: D+10.7
Not yet ingested
- Civics
- —
Market trends
- HPI YoY
- ▼ -430.80%
- Current HPI
- 259.8452
- Rent YoY
- ▲ 2.89%
- Metro
- Stockton, CA
- State GDP YoY
- ▲ 3.21%
- F500 in state
- 116
Industry mix (Fortune 500 HQ in CA)
| Industry | F500 HQs | Revenue |
|---|---|---|
| Technology | 27 | $1,492B |
|
||
| Financial Services | 3 | $174B |
|
||
| Retail | 3 | $44B |
|
||
| Insurance | 3 | $26B |
|
||
| Media / Entertainment | 2 | $115B |
|
||
| Pharmaceuticals / Biotech | 2 | $62B |
|
||
Price history
-95.0% since first listed15 events — show timeline
- 2025-07-11 Rental Removed $1,995 BUILDIUM
- 2025-06-26 Price Changed $1,995 BUILDIUM
- 2025-06-12 Listed for Rent $2,000 BUILDIUM
- 2024-03-24 Rental Removed $1,995 RENTLY
- 2024-02-22 Price Changed $1,995 RENTLY
- 2024-02-15 Listed for Rent $2,000 RENTLY
- 2005-11-23 Sold (Public Records) $415,000 Public Records
- 2005-11-23 Sold (MLS) $415,000 MLSListings
- 2005-10-04 Listing Removed — MLSListings
- 2005-09-20 Listed $415,000 MLSListings
- 1989-12-12 Sold (Public Records) $92,000 Public Records
- 1989-12-12 Sold (Public Records) $92,000 Public Records
- 1988-07-29 Sold (Public Records) $107,000 Public Records
- 1985-10-03 Sold (Public Records) $87,500 Public Records
- 1981-10-30 Sold (Public Records) $40,000 Public Records
Property tax history
-5.9%/yrLatest (2025): $1,741 · +1.9% YoY. Source: county tax records.
Cash-flow waterfall
monthlySold comps — $/sqft
last 12 mo · ≤1 miLoading sold comps…