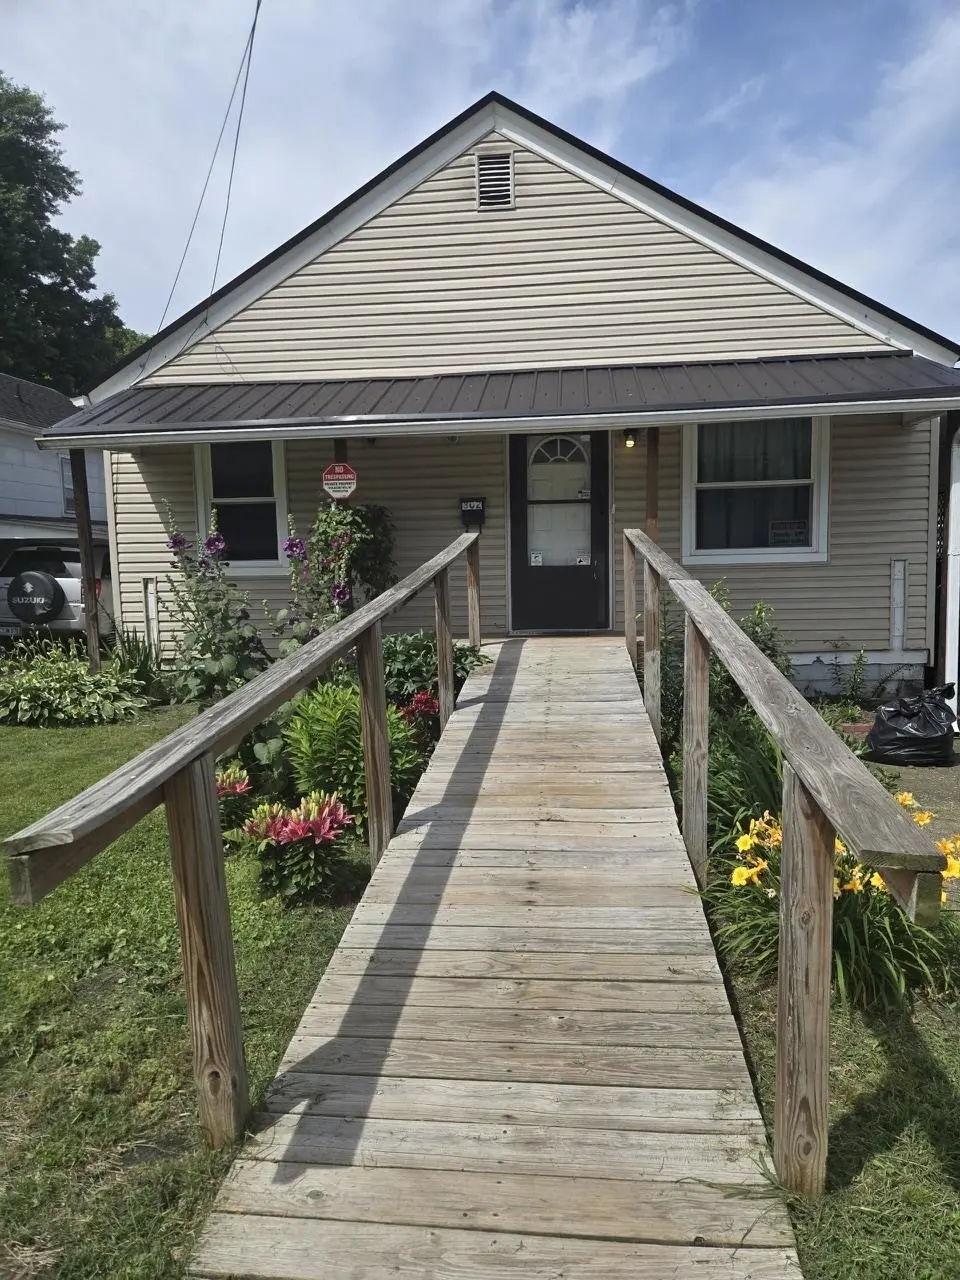
302 W 9th Street West St · Huntington, WV
Flood risk 6/10 · Moderate
- FEMA flood zone
- X
- Chance of flooding over 30 yrs
- 0.72%
- Est. flood insurance / yr
- $507 – $1,088
Fire risk 3/10 · Minor
- Est. fire insurance / yr
- $787 – $1,461
Heat risk 5/10 · Moderate
- Hot days now (above 103°F)
- 7 days/yr
- Hot days in 30 yrs
- 19 days/yr
Wind risk 2/10 · Minimal
- Chance of severe wind over 30 yrs
- 1.0%
Air-quality risk 1/10 · Minimal
- Unhealthy air days now
- 0 days/yr
- Unhealthy air days in 30 yrs
- 0 days/yr
Risk factors via First Street. Map © Google.
Why this score? — see what drove the C+ grade
The composite is a weighted blend of 9 inputs, each scored 0–100. Each bar is that input's sub-score; the figure is the points it added to the 100-point composite (weight × sub-score).
- Cash flow +30.0/30.0
- DSCR +10.0/10.0
- 1% rule +8.4/10.0
- Livability +4.0/5.0
- Schools +3.0/10.0
- Rent growth +2.5/5.0
- Condition / age +2.5/5.0
- ARV discount +2.2/15.0
- Appreciation +0.0/10.0
$88,300
🖨 Deal sheet (PDF) 📄 Offer letter ✓ Due diligence
Listing remarks
Corner lot, backyard privacy fence with white vinyl fencing. Storage units and fire pit. Newer windows with transferable warranty. Carport with off street parking.
Key facts
- Off street parking
- Carport
- Storage units
Tags
Property features AI
Exterior
- Utilities: Public water; Public sewer
- Home design: Single-family residence; One story
- Construction: Vinyl siding; Metal roof
- Exterior features: Patio; Storm door(s); Level lot
Interior
- Kitchen: Range/Oven; Microwave; Dishwasher not listed
- Flooring: Laminate; Vinyl; Wood
- Bathrooms: 1 full bathroom
- Heating & cooling: Central heating (natural gas); Central air conditioning
- Interior features: Washer and Dryer; Microwave; Range/Oven; Laminate, vinyl, and wood flooring; Crawl space basement
- Laundry & utility: Washer and Dryer
Neighborhood map
What this means for you Summary
Snapshot
- This is a 3-bed/1.0-bath single-family listed at $88k.
Deal economics
- At list price, monthly cash flow is $403 ($5k/yr) — positive.
- The deal already cash-flows at list — no discount required.
- Meets the 1% rule at list price ($1k rent vs $88k).
- Cap rate 11.8% vs local median 6.4% in Huntington — top-decile yield for the area; either an underpriced asset or a hidden risk that comps aren't pricing in. Stress-test before assuming the spread holds.
Location & tenants
- Location reads 79/100 on livability (#16 in WV, #2,045 nationally) — a middle-class / working-renter tenant base. Strengths: amenities A+, commute A+, cost of living A+; Watch: crime F, employment F.
- Cabell County Schools (urban): math 31% / reading 42% proficiency, ranked #13 of 55 in WV (top 24%) — families likely to look elsewhere, expect single-tenant / working-renter base with shorter leases.
- Zoned schools: Central City Elementary School (math 22% / reading 22%, grade F, #324 of 377 statewide, top 89%, 407 students, 0% FRL); Huntington Middle School (math 21% / reading 35%, grade F, #66 of 109 statewide, top 63%, 647 students, 0% FRL); Huntington High School (math 26% / reading 50%, grade F, #31 of 110 statewide, top 28%, 1,704 students, 0% FRL) — zoned schools average 0% FRL vs 47% district-wide (47 pts lower); this property's tenant base skews higher-income than the district average.
- Market conditions: 78 active listings in the ZIP; 61 units permitted in Cabell County in 2024 (5 in 5+ unit buildings).
Forward outlook
- Local home prices are declining (-3.0%/yr); year-one equity from $610 of loan paydown is wiped out by about $3k of value loss. Plan a longer hold.
- At projected returns (-3.0% appreciation + 3.0% rent growth), your $25k cash investment doubles in ~7 years — after that, you're playing with house money.
Negotiation context
- Only 14 days on market — expect competitive offers; lowballing is unlikely to land.
Risks & watch-outs
- Watch-outs: built in 1954 — expect roof / HVAC / electrical / plumbing capex.
- Climate carrying-cost: major flood risk; extreme-heat days projected 7→19/yr by 2055 (HVAC capex compounding) — expect insurance premiums to compound above CPI over the hold.
Questions for the listing agent
- Built in 1954 — when were the roof, HVAC, electrical panel, plumbing, and water heater last replaced?
- Is there a deadline driving the sale (1031 exchange, divorce, estate, relocation)? That informs how much negotiation room exists.
- Crime grade is F in this area — have there been break-ins, vandalism, or insurance claims at this property in the last 3 years? What carrier currently insures it and at what premium?
- What's the average days-on-market for RENTAL listings here right now (not sales)? A rising rental-DOM trend means longer vacancies and softer asking-rent achievability than the comps imply.
- What's the recent tenant-quality profile in this submarket — average credit score on applications, eviction rate, late-payment / NSF rate, and stable-employment percentage? A property-management company in the area should have these aggregated.
- How much new for-sale + rental construction is in the pipeline within 1–3 miles? Heavy new supply typically softens prices + rents 12–24 months out; constrained supply supports both.
Investment metrics
- 1% rule
- 1.34% ✓
- Cap rate
- 11.77%
- Cash-on-cash
- 19.56%
- DSCR
- 1.87
- GRM
- 6.2
CMA / ARV
- ARV (on-the-fly)
- $79,040
- Comps found
- 12
Show comp detail 12 sales within ~0.75 mi
| Address | Dist | Beds/Ba | Sqft | Sold | Price | $/sf | Match |
|---|---|---|---|---|---|---|---|
| 12 Washington Ct | 0.04mi | 3/1.0 | 984 (-5%) | 9mo | $90,550 | $92 | 82 |
| 928 Monroe Ave Ave | 0.39mi | 3/1.0 | 1,040 (0%) | 3mo | $79,000 | $76 | 79 |
| 920 R Jefferson Ave | 0.24mi | 2/1.0 (-1) | 968 (-7%) | 4mo | $39,500 | $41 | 69 |
| 6 Ferrell Ct | 0.40mi | 2/1.0 (-1) | 1,065 (+2%) | 5mo | $20,000 | $19 | 68 |
| 229 Adams Ave | 0.65mi | 3/1.0 | 1,026 (-1%) | 2mo | $35,300 | $34 | 66 |
| 136 Township Road 1097 | 0.45mi | 2/2.0 (-1) | 1,039 (-0%) | 10mo | $169,900 | $164 | 61 |
| 716 4th st West St | 0.64mi | 2/1.0 (-1) | 1,078 (+4%) | 13mo | $98,000 | $91 | 48 |
| 18 Private Drive 149 Unit 4 | 0.57mi | 2/1.5 (-1) | 988 (-5%) | 15mo | $74,000 | $75 | 46 |
| 224 Carrington Ct | 0.69mi | 2/1.0 (-1) | 1,046 (+1%) | 21mo | $67,500 | $65 | 44 |
| 809 W 11th St | 0.42mi | 2/1.0 (-1) | 895 (-14%) | 10mo | $33,500 | $37 | 44 |
| 226 Carrington Ct | 0.68mi | 2/1.0 (-1) | 884 (-15%) | 9mo | $70,000 | $79 | 31 |
| 117 Township Road 1213 | 0.69mi | 2/1.0 (-1) | 900 (-14%) | 12mo | $133,000 | $148 | 30 |
Match score weights: distance 35% · size 25% · config 20% · recency 20%. Top-matched comps best support the ARV.
Projected returns pro-forma
-3.0% appreciation · 3.0% rent growth · sell at horizon
- IRR
- 11.6%
- Equity multiple
- 1.46×
- Total profit
- $11,335
- Equity at exit
- $13,166
- IRR
- 20.5%
- Equity multiple
- 2.73×
- Total profit
- $42,810
- Equity at exit
- $7,635
Cash invested: $24,724 (down + closing). Projections, not guarantees.
Landlord ↔ Tenant lean methodology
- Overall (STATE)
- 83 Strongly Landlord-Friendly
- State West Virginia
- 83 Strongly Landlord-Friendly · R+22
- County
- — inherits STATE
- City
- — inherits STATE
ZIP-level market 25704
- Home prices YoY
- -13.7%
- Active inventory
- 78
- Price-to-rent
- 6.2×
Monthly cashflow live
- Estimated rent
- $1,186 medium interval (Pro) →
- Mortgage (P&I)
- −$463
- Tax from tax record
- −$34 /mo · $409/yr
- Insurance
- −$37
- HOA
- −$0
- Lot rent
- −$0
- Vacancy / Maint / Mgmt
- −$249
- Net cashflow
- $403
Break-even live
Sensitivity live
| Price | -10% $453 | -5% $428 | +0% $403 | +5% $378 | +10% $353 |
|---|---|---|---|---|---|
| Rent | -10% $309 | -5% $356 | +0% $403 | +5% $450 | +10% $497 |
| Rate | -1.0pp $448 | -0.5pp $426 | base $403 | +0.5pp $380 | +1.0pp $357 |
UW: 25.0% down · 7.5% · 30yr · 1.5% tax · 5.0% vac · 8.0% maint · 8.0% mgmt
Financing live
Cash to close
- Down payment
- $22,075
- Closing costs
- $2,649
- Reserves months
- —
- Total cash needed
- —
Loan-product check · same deal, 3 products live
Conventional
25% down · 7.5% · 30yr
- Down + closing
- —
- Monthly P&I
- —
- Monthly cashflow
- —
- DSCR
- —
- Eligible?
- —
Personal DTI + credit; lowest rate.
DSCR
20% down · 8.5% · 30yr
- Down + closing
- —
- Monthly P&I
- —
- Monthly cashflow
- —
- DSCR
- —
- Eligible?
- —
No personal income docs; deal must DSCR.
Hard money
10% down · 12.0% · 12mo
- Down + closing
- —
- Monthly P&I
- —
- Monthly cashflow
- —
- DSCR
- —
- Eligible?
- —
Short-term bridge; refi at stabilization.
Listing history 11 events
-
2026-06-22days on market $88,300 Active 14 DOM
-
2026-06-21days on market $88,300 Active 13 DOM
-
2026-06-19days on market $88,300 Active 11 DOM
-
2026-06-18days on market $88,300 Active 10 DOM
-
2026-06-17days on market $88,300 Active 9 DOM
-
2026-06-16days on market $88,300 Active 8 DOM
-
2026-06-15days on market $88,300 Active 7 DOM
-
2026-06-14days on market $88,300 Active 5 DOM
-
2026-06-12days on market $88,300 Active 4 DOM
-
2026-06-09remarks 163-char remark
-
2026-06-09$88,300 Active 1 DOM
ⓘ Source: listings_history table (triggers on properties + properties_extension) + one-shot
backfill from property_details.listing_events for pre-trigger history.
Tax reassessment forecast WV · Resets to sale price
- Current annual tax
- $409 · $34/mo
- Projected year-2 tax
- $521 · $43/mo
- Expected delta
- +$112/yr (+$9/mo · 27.3%)
ⓘ Screening estimate from a state-policy table — verify with the county assessor before closing.
Climate risk First Street
- Flood 6/10 Major FEMA zone X · 72% chance over 30 yrs
- Wildfire 3/10 Moderate
- Heat 5/10 Major 7 d/yr ≥103°F today · 19 d/yr by 30 yrs out
- Wind 2/10 Low 100% chance of damaging wind over 30 yrs
- Air quality 1/10 Low 0 unhealthy d/yr today · 0 by 30 yrs out
Nearby sold comps map
Loading sold comps map…
Walkable amenities ~0.75 mi
Loading nearby amenities…
Taxation est. · year 1
- Rental income
- $14,233
- − Mortgage interest
- −$4,946
- − Property taxes
- −$409
- − Insurance
- −$442
- − Repairs & maintenance
- −$1,139
- − Management
- −$1,139
- − Depreciation
- −$2,569
- Taxable income
- $3,590
- Est. tax owed @ 24.0%
- −$862
- After-tax cash flow
- $3,975/yr
For passive investors: Depreciation is non-cash, so a rental often shows a tax loss while cash-flowing — sheltering income. Rental losses are passive: they offset passive income freely, and up to $25,000/yr can offset ordinary (W-2) income if you actively participate and your MAGI is under $100k (phasing out to $0 by $150k); unused losses carry forward. On sale, claimed depreciation is recaptured at up to 25%, and gains may owe capital-gains tax (a 1031 exchange can defer both). Figures are a year-1 estimate at your 24.0% rate — not tax advice; consult a CPA.
Schools (NCES district)
- District
- Cabell County Schools
- NCES district ID
- 5400180
- Math proficiency
- 31% ▼ -7.00%
- Reading proficiency
- 42% ▼ -6.00%
- Median HH income
- $36,426
- Composite
- 30.26/100
- National rank
- #6285
- State rank
- #13 of 55 in WV
Livability — Huntington
- Score
- 79/100
- State rank
- #16
- US rank
- #2045
Category grades
Schools grade is shown separately in the Schools card above.
Census & demographics
- Census place
- Huntington, WV
- City population
- 25,795
- Population (ZIP)
- 14,413
Population outlook (Cabell County) Hauer SSP2
- Today (2025)
- 97,574 people
- By 2030
- 98,060 · +0.5%
- By 2040
- 98,817 · +1.3%
- By 2050
- 100,185 · +2.7%
- By 2075
- 105,895 · +8.5%
- By 2100
- 105,948 · +8.6%
Race, ethnicity, and origin ACS 2023
- Neighborhood character
- Predominantly White (93%)
- Race & ethnicity
- White 93% Two or more races 5% Black 2%
- Common ancestry
- Italian 3% Serbian 2% Slovak 2%
- Foreign-born
- 1% · Canada
- Languages at home
- 99% English-only · French/Haitian/Cajun 1%
Political lean MEDSL · Cabell
- 2024 margin
- Strong R (+21.9) · D 38.0% · R 59.9% · Other 2.0%
- 2008→2024 swing
- -11.8pp toward R · 2008: -10.1pp · 2024: -21.9pp
- All cycles
- 2024: R+21.9 2020: R+18.0 2016: R+25.5 2012: R+13.9 2008: R+10.1
Not yet ingested
- Civics
- —
Market trends
- HPI YoY
- ▼ -32.21%
- Current HPI
- 202.1322
- Rent YoY
- —
- Metro
- —
- State GDP YoY
- —
- F500 in state
- 0
Price history
1 event — show timeline
- 2026-06-08 Listed $88,300 HBRMLS
Property tax history
-5.3%/yrLatest (2025): $409 · +9.1% YoY. Source: county tax records.
Cash-flow waterfall
monthlySold comps — $/sqft
last 12 mo · ≤1 miLoading sold comps…