10965 Glenoaks Blvd #132 · Los Angeles, CA
Flood risk 1/10 · Minimal
- FEMA flood zone
- X (unshaded)
- Chance of flooding over 30 yrs
- 0.0%
- Est. flood insurance / yr
- $507 – $1,088
Fire risk 6/10 · Moderate
- Est. fire insurance / yr
- $659 – $1,223
Heat risk 6/10 · Moderate
- Hot days now (above 97°F)
- 6 days/yr
- Hot days in 30 yrs
- 16 days/yr
Wind risk 1/10 · Minimal
- Chance of severe wind over 30 yrs
- —
Air-quality risk 7/10 · Major
- Unhealthy air days now
- 13 days/yr
- Unhealthy air days in 30 yrs
- 16 days/yr
Risk factors via First Street. Map © Google.
Why this score? — see what drove the B+ grade
The composite is a weighted blend of 9 inputs, each scored 0–100. Each bar is that input's sub-score; the figure is the points it added to the 100-point composite (weight × sub-score).
- Cash flow +30.0/30.0
- ARV discount +15.0/15.0
- 1% rule +10.0/10.0
- DSCR +10.0/10.0
- Schools +3.6/10.0
- Livability +3.4/5.0
- Rent growth +2.5/5.0
- Condition / age +2.2/5.0
- Appreciation +0.0/10.0
$159,900
🖨 Deal sheet 📄 Offer letter ✓ Due diligence
Listing remarks MLS
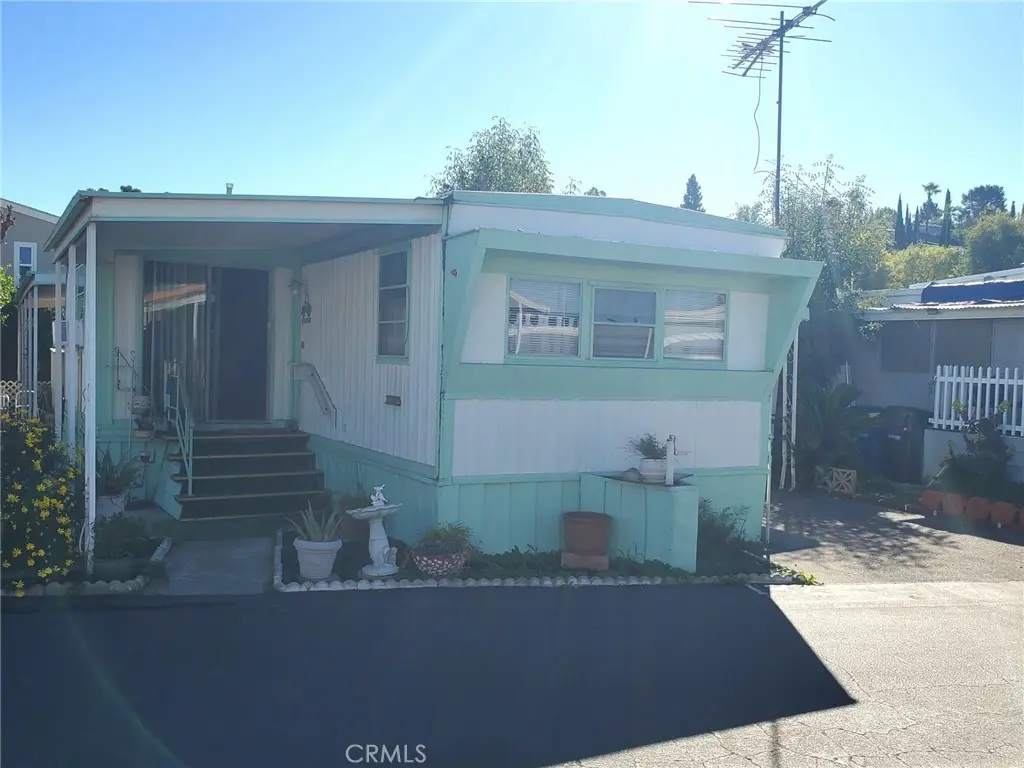
Welcome home to this family friendly home in a quiet gated park. This home has an inviting front porch, which leads into the large living room. The living room features wood paneling, carpeting and large windows. The kitchen is open to the living room and has a linoleum tiled flooring, a ceiling fan and lots of cabinets. The 1st bedroom has wood paneling and a large closet. The bathroom has a tub/shower combination with doors and additional storage. The main bedroom has wood paneling with 2 large closets and drawers built into the closets. The home is 12 X 56 plus an expando and features a side yard with a patio. The water heater is only 1 year old! This home has one of the lowest space rents in the area! Schedule your showing today.
Key facts
- Ceiling fan
- Inviting front porch
- Lots of cabinets
Tags
Neighborhood map
What this means for you Summary
Snapshot
- This is a 2-bed/1.0-bath manufactured listed at $160k. Condition is rated fair.
Deal economics
- At list price, monthly cash flow is $863 ($10k/yr) — positive.
- The deal already cash-flows at list — no discount required.
- Meets the 1% rule at list price ($2k rent vs $160k).
- Recommended offer: $141k (12.0% below list) — sets the bar for market timing.
- Cap rate 12.8% vs local median 2.1% in Los Angeles — top-decile yield for the area; either an underpriced asset or a hidden risk that comps aren't pricing in. Stress-test before assuming the spread holds.
Location & tenants
- Location reads 68/100 on livability (#273 in CA) — a middle-class / working-renter tenant base. Strengths: amenities A+, commute A+, employment B; Watch: health & safety C-, schools D+, crime F.
- Los Angeles Unified (urban): math 29% / reading 54% proficiency, ranked #223 of 517 in CA (top 43%) — families likely to look elsewhere, expect single-tenant / working-renter base with shorter leases; 67% free/reduced lunch — lower-income household profile, screen leases tightly.
- Market conditions: 80 active listings in the ZIP; 12 comparable units currently listed for rent nearby; rentals at typical pace (median 25d on market — plan ~3-4 weeks tenant-placement turnaround); 42% of comp listings sitting > 30 days — soft ceiling on asking rent; solid renter incomes; 19,697 units permitted in Los Angeles County in 2024 (9,426 in 5+ unit buildings).
- This rent runs 35% of the median local income ($84k/yr) — at the standard rent-burdened threshold; future hikes will face affordability resistance.
Forward outlook
- Local home prices are declining (-3.0%/yr); year-one equity from $1k of loan paydown is wiped out by about $5k of value loss. Plan a longer hold.
- Los Angeles County population projected at +9% by 2050 — modest demand growth; plan on rents tracking national, not racing it.
- At projected returns (-3.0% appreciation + 3.0% rent growth), your $45k cash investment doubles in ~6 years — after that, you're playing with house money.
Negotiation context
- It's been on market 149 days — a 12% lower offer ($141k) is reasonable based on typical stale-listing flexibility.
Risks & watch-outs
- Climate carrying-cost: major wildfire risk; extreme-heat days projected 6→16/yr by 2055 (HVAC capex compounding) — expect insurance premiums to compound above CPI over the hold.
Questions for the listing agent
- It's been on market 149 days. Have you received any prior offers? Is the seller open to a 12% concession, seller financing, or rate buy-down credit?
- Have any recent inspections been done? Can we get a copy of the seller's disclosures and any deferred-maintenance estimates?
- Built in 1963 — when were the roof, HVAC, electrical panel, plumbing, and water heater last replaced?
- Why hasn't it sold? Are there any deal-killer items the seller is aware of (foundation, flood, title, zoning, code violations)?
- Is there a deadline driving the sale (1031 exchange, divorce, estate, relocation)? That informs how much negotiation room exists.
- Schools are D-rated, which usually means shorter tenancies and higher turnover. Who's the typical renter profile here, and what's been the actual vacancy rate?
- Crime grade is F in this area — have there been break-ins, vandalism, or insurance claims at this property in the last 3 years? What carrier currently insures it and at what premium?
- What's the average days-on-market for RENTAL listings here right now (not sales)? A rising rental-DOM trend means longer vacancies and softer asking-rent achievability than the comps imply.
- What's the recent tenant-quality profile in this submarket — average credit score on applications, eviction rate, late-payment / NSF rate, and stable-employment percentage? A property-management company in the area should have these aggregated.
- How much new for-sale + rental construction is in the pipeline within 1–3 miles? Heavy new supply typically softens prices + rents 12–24 months out; constrained supply supports both.
Investment metrics
- 1% rule
- 1.56% ✓
- Cap rate
- 12.77%
- Cash-on-cash
- 23.13%
- DSCR
- 2.03
- GRM
- 5.3
CMA / ARV
- ARV (median comp)
- $202,274
- List price
- $159,900
- Delta
- -20.95%
- Verdict
- UNDERPRICED
- Comps
- 5 within 1.0 mi
Show comp detail 3 sales within ~0.75 mi
| Address | Dist | Beds/Ba | Sqft | Sold | Price | $/sf | Match |
|---|---|---|---|---|---|---|---|
| 12600 Van Nuys Blvd Spc 21 | 0.58mi | 3/2.0 (+1) | 800 (0%) | 13mo | $234,300 | $293 | 53 |
| 12600 Van Nuys Blvd #20 | 0.57mi | 3/1.0 (+1) | 880 (+10%) | 13mo | $215,000 | $244 | 41 |
| 10471 Glenoaks Blvd #56 | 0.72mi | 1/1.0 (-1) | 720 (-10%) | 10mo | $130,000 | $181 | 36 |
Match score weights: distance 35% · size 25% · config 20% · recency 20%. Top-matched comps best support the ARV.
Projected returns pro-forma
-3.0% appreciation · 3.0% rent growth · sell at horizon
- IRR
- 16.1%
- Equity multiple
- 1.65×
- Total profit
- $29,093
- Equity at exit
- $23,842
- IRR
- 24.8%
- Equity multiple
- 3.15×
- Total profit
- $96,265
- Equity at exit
- $13,825
Cash invested: $44,772 (down + closing). Projections, not guarantees.
Landlord ↔ Tenant lean methodology
- Overall (CITY)
- 0 Strongly Tenant-Friendly
- State California
- 18 Strongly Tenant-Friendly · D+13
- County
- — inherits STATE
- City Los Angeles
- 0 Strongly Tenant-Friendly · D+22
ZIP-level market 91331
- Active inventory
- 80
- Price-to-rent
- 5.3×
Monthly cashflow live
- Estimated rent
- $2,491 high interval (Pro) →
- Mortgage (P&I)
- −$839
- Tax est. 1.5%
- −$200 /mo · $2,398/yr
- Insurance
- −$67
- HOA
- −$0
- Vacancy / Maint / Mgmt
- −$523
- Net cashflow
- $863
Break-even live
UW: 25.0% down · 7.5% · 30yr · 1.5% tax · 5.0% vac · 8.0% maint · 8.0% mgmt
Financing live
Cash to close
- Down payment
- $39,975
- Closing costs
- $4,797
- Reserves months
- —
- Total cash needed
- —
Loan-product check · same deal, 3 products live
Conventional
25% down · 7.5% · 30yr
- Down + closing
- —
- Monthly P&I
- —
- Monthly cashflow
- —
- DSCR
- —
- Eligible?
- —
Personal DTI + credit; lowest rate.
DSCR
20% down · 8.5% · 30yr
- Down + closing
- —
- Monthly P&I
- —
- Monthly cashflow
- —
- DSCR
- —
- Eligible?
- —
No personal income docs; deal must DSCR.
Hard money
10% down · 12.0% · 12mo
- Down + closing
- —
- Monthly P&I
- —
- Monthly cashflow
- —
- DSCR
- —
- Eligible?
- —
Short-term bridge; refi at stabilization.
Rent comps 12 comps
| Address | Beds | Baths | Sqft | Rent | $/sqft | DOM | Units | Dist |
|---|---|---|---|---|---|---|---|---|
| 10820 Glenoaks Blvd Pacoima, CA | 1.0 | 1.0 | 524 | $1,995 | $3.81 | 5d | 2 | 0.25mi |
| 11150 Glenoaks Blvd #104 Pacoima, CA | 2.0 | 1.0 | 792 | $2,500 | $3.16 | 43d | 1 | 0.41mi |
| 12411 Osborne St #106 Pacoima, CA | 2.0 | 2.0 | 921 | $2,442 | $2.65 | 43d | 1 | 0.49mi |
| 13110 Pinney St Pacoima, CA | 1.0 | 2.0 | 800 | $2,500 | $3.12 | 10d | 1 | 0.66mi |
| 11886 Foothill Blvd Sylmar, CA | 2.0 | 2.0 | 810 | $2,485 | $3.07 | 3d | 3 | 0.76mi |
| 13102 Filmore St Pacoima, CA | 3.0 | 2.0 | 738 | $3,000 | $4.07 | 43d | 1 | 0.76mi |
| 11777 Foothill Blvd Sylmar, CA | 1.0–2.0 | 1.0–2.0 | 788 | $2,596 | $3.29 | 43d | 1 | 0.91mi |
| 13328 Louvre St Pacoima, CA | 2.0 | 1.0 | 650 | $3,000 | $4.62 | 24d | 1 | 0.97mi |
| 13621 N Fellows Ave Pacoima, CA | 3.0 | 2.0 | 1000 | $2,875 | $2.88 | 20d | 1 | 1.07mi |
| 13165 Garber St Pacoima, CA | 3.0 | 1.0 | 1108 | $3,000 | $2.71 | 24d | 1 | 1.10mi |
| 10214 O'Melveny Ave Unit 10212 Pacoima, CA | 3.0 | 2.0 | 1037 | $3,500 | $3.38 | 20d | 1 | 1.30mi |
| 13704 Pinney St Pacoima, CA | 3.0 | 2.0 | 1100 | $3,500 | $3.18 | 43d | 1 | 1.48mi |
Listing history 14 events
-
2026-06-18days on market $159,900 Active 149 DOM
-
2026-06-17days on market $159,900 Active 148 DOM
-
2026-06-16days on market $159,900 Active 147 DOM
-
2026-06-15days on market $159,900 Active 146 DOM
-
2026-06-13days on market $159,900 Active 144 DOM
-
2026-06-09days on market $159,900 Active 140 DOM
-
2026-06-08days on market $159,900 Active 139 DOM
-
2026-06-07days on market $159,900 Active 138 DOM
-
2026-06-04days on market $159,900 Active 135 DOM
-
2026-06-03days on market $159,900 Active 134 DOM
-
2026-06-02days on market $159,900 Active 133 DOM
-
2026-06-01days on market $159,900 Active 132 DOM
-
2026-05-31days on market $159,900 Active 131 DOM
-
2026-01-20$159,900 Active 749-char remark
Show marketing remark (749 chars)
Welcome home to this family friendly home in a quiet gated park. This home has an inviting front porch, which leads into the large living room. The living room features wood paneling, carpeting and large windows. The kitchen is open to the living room and has a linoleum tiled flooring, a ceiling fan and lots of cabinets. The 1st bedroom has wood paneling and a large closet. The bathroom has a tub/shower combination with doors and additional storage. The main bedroom has wood paneling with 2 large closets and drawers built into the closets. The home is 12 X 56 plus an expando and features a side yard with a patio. The water heater is only 1 year old! This home has one of the lowest space rents in the area! Schedule your showing today.
ⓘ Source: listings_history table (triggers on properties + properties_extension) + one-shot
backfill from property_details.listing_events for pre-trigger history.
Climate risk First Street
- Flood 1/10 Low FEMA zone X (unshaded) · 0% chance over 30 yrs
- Wildfire 6/10 Major
- Heat 6/10 Major 6 d/yr ≥97°F today · 16 d/yr by 30 yrs out
- Wind 1/10 Low
- Air quality 7/10 Severe 13 unhealthy d/yr today · 16 by 30 yrs out
Nearby sold comps map
Loading sold comps map…
Walkable amenities ~0.75 mi
Loading nearby amenities…
Taxation est. · year 1
- Rental income
- $29,895
- − Mortgage interest
- −$8,957
- − Property taxes
- −$2,398
- − Insurance
- −$800
- − Repairs & maintenance
- −$2,392
- − Management
- −$2,392
- − Depreciation
- −$4,652
- Taxable income
- $8,305
- Est. tax owed @ 24.0%
- −$1,993
- After-tax cash flow
- $8,363/yr
For passive investors: Depreciation is non-cash, so a rental often shows a tax loss while cash-flowing — sheltering income. Rental losses are passive: they offset passive income freely, and up to $25,000/yr can offset ordinary (W-2) income if you actively participate and your MAGI is under $100k (phasing out to $0 by $150k); unused losses carry forward. On sale, claimed depreciation is recaptured at up to 25%, and gains may owe capital-gains tax (a 1031 exchange can defer both). Figures are a year-1 estimate at your 24.0% rate — not tax advice; consult a CPA.
Condition & rehab AI · 12 photos
This manufactured home requires moderate renovations to update the kitchen and bathroom, paint the interior walls, and improve the landscaping. These updates would significantly increase its resale and rental value.
Repairs flagged
- Moderate kitchen cabinets — dated and in need of replacement
- Minor bathroom fixtures — dated and in need of replacement
Value-add opportunities
- Both update kitchen cabinets and fixtures — modernizing the kitchen would improve both resale and rental value
- Both paint interior walls — painting the interior walls would improve the home's curb appeal and interior aesthetics
- Both landscape the yard — improving the landscaping would enhance the home's curb appeal and increase its rental value
Renovation cost estimate screening
| Repair item | Severity | Est. cost |
|---|---|---|
| kitchen cabinets · dated and in need of replacement | Moderate | $3,000–15,000 |
| bathroom fixtures · dated and in need of replacement | Minor | $500–3,000 |
| Total estimated repair cost · 2 items | $3,500–18,000 |
Value-add ROI direction
- Both update kitchen cabinets and fixtures — modernizing the kitchen would improve both resale and rental value ↑
- Both paint interior walls — painting the interior walls would improve the home's curb appeal and interior aesthetics ↑
- Both landscape the yard — improving the landscaping would enhance the home's curb appeal and increase its rental value ↑
ⓘ Cost ranges are severity-bucket heuristics (US national rule-of-thumb). Get contractor quotes + a written scope before underwriting a rehab budget.
Schools (NCES district)
- District
- Los Angeles Unified
- NCES district ID
- 0622710
- Math proficiency
- 29% ▼ -4.00%
- Reading proficiency
- 54% ▲ 10.00%
- Median HH income
- $50,403
- Composite
- 35.67/100
- National rank
- #4875
- State rank
- #223 of 517 in CA
Livability — Los Angeles
- Score
- 68/100
- State rank
- #273
- US rank
- #9237
Category grades
Schools grade is shown separately in the Schools card above.
Census & demographics
- Census place
- Los Angeles, CA
- County
- Los Angeles County · 9,444,647 people
- City population
- 3,838,149
- Metro
- Los Angeles-Long Beach-Anaheim, CA
- Population (ZIP)
- 97,608
- Household income
- $84,227
- Rent vs Own
- Severe rent burden
- 2850.0
Population outlook (Los Angeles County) Hauer SSP2
- Today (2025)
- 10,940,515 people
- By 2030
- 11,256,481 · +2.9%
- By 2040
- 11,729,929 · +7.2%
- By 2050
- 11,948,407 · +9.2%
- By 2075
- 11,818,114 · +8.0%
- By 2100
- 10,842,928 · -0.9%
Race, ethnicity, and origin ACS 2023
- Neighborhood character
- Predominantly Hispanic (87%)
- Race & ethnicity
- Hispanic / Latino 87% Two or more races 32% Asian 5% White 4% Black 2% Native American 1%
- Hispanic origin (detail)
- Mexican 67%
- Foreign-born
- 42% · Canada, Vietnam
- Languages at home
- 18% English-only · Spanish 77% Tagalog/Filipino 2% Other Indo-European 1%
Political lean MEDSL · Los Angeles
- 2024 margin
- Solid D (+32.9) · D 64.8% · R 31.9% · Other 3.3%
- 2008→2024 swing
- -7.4pp toward R · 2008: 40.4pp · 2024: 32.9pp
- All cycles
- 2024: D+32.9 2020: D+44.2 2016: D+48.0 2012: D+40.0 2008: D+40.4
Not yet ingested
- Civics
- —
Market trends
- HPI YoY
- ▼ -865.28%
- Current HPI
- 541.1058
- Rent YoY
- —
- Metro
- Los Angeles-Long Beach-Anaheim, CA
- State GDP YoY
- ▲ 3.21%
- F500 in state
- 116
Industry mix (Fortune 500 HQ in CA)
| Industry | F500 HQs | Revenue |
|---|---|---|
| Technology | 27 | $1,492B |
|
||
| Financial Services | 3 | $174B |
|
||
| Retail | 3 | $44B |
|
||
| Insurance | 3 | $26B |
|
||
| Media / Entertainment | 2 | $115B |
|
||
| Pharmaceuticals / Biotech | 2 | $62B |
|
||
Price history
1 event — show timeline
- 2026-01-20 Listed $159,900 CRMLS
Cash-flow waterfall
monthlySold comps — $/sqft
last 12 mo · ≤1 miLoading sold comps…