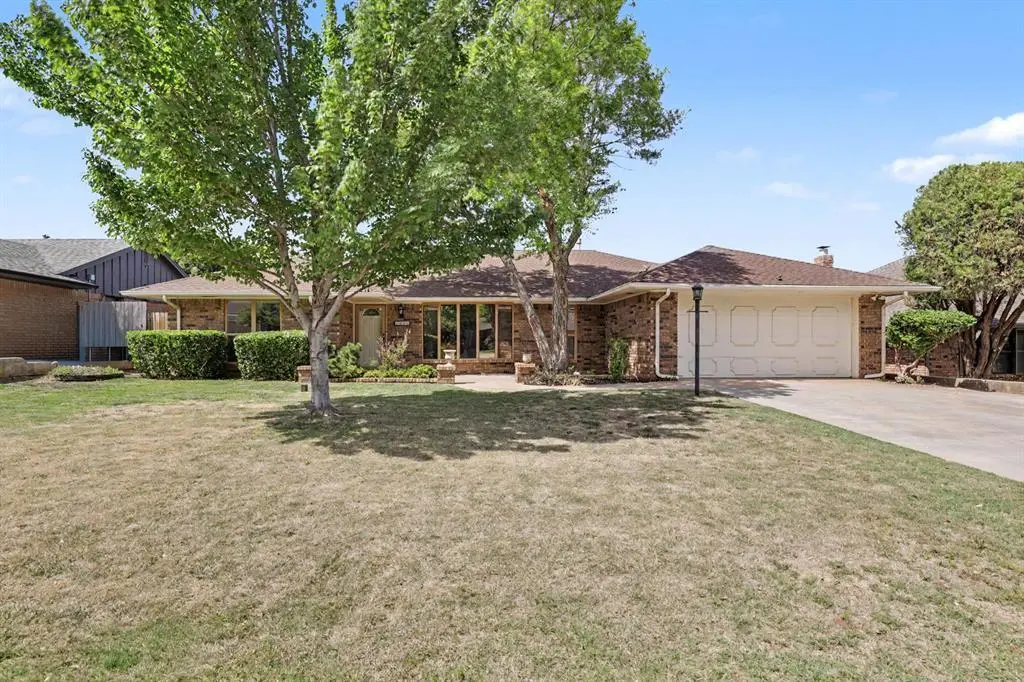
5609 NW 114th St · Oklahoma City, OK
Flood risk 1/10 · Minimal
- FEMA flood zone
- X (unshaded)
- Chance of flooding over 30 yrs
- 0.0%
- Est. flood insurance / yr
- $507 – $1,088
Fire risk 1/10 · Minimal
- Est. fire insurance / yr
- $2,463 – $4,575
Heat risk 6/10 · Moderate
- Hot days now (above 107°F)
- 7 days/yr
- Hot days in 30 yrs
- 20 days/yr
Wind risk 2/10 · Minimal
- Chance of severe wind over 30 yrs
- 2.0%
Air-quality risk 2/10 · Minimal
- Unhealthy air days now
- 1 days/yr
- Unhealthy air days in 30 yrs
- 1 days/yr
Risk factors via First Street. Map © Google.
Why this score? — see what drove the D+ grade
The composite is a weighted blend of 9 inputs, each scored 0–100. Each bar is that input's sub-score; the figure is the points it added to the 100-point composite (weight × sub-score).
- ARV discount +15.0/15.0
- Cash flow +14.2/30.0
- DSCR +4.3/10.0
- Livability +4.0/5.0
- Rent growth +3.9/5.0
- 1% rule +3.1/10.0
- Condition / age +2.5/5.0
- Schools +1.3/10.0
- Appreciation +0.0/10.0
$249,777
🖨 Deal sheet 📄 Offer letter ✓ Due diligence
Listing remarks
* * * MULTIPLE OFFER SITUATION- highest and best offers due on 5/4/26 at 12PM * * * Located in a well-established Oklahoma City neighborhood, 5609 NW 114th St offers space, potential, and an opportunity to truly make it your own. This 4-bedroom, 3-bath home is priced with updates in mind, making it ideal for buyers ready to add their personal touch. Inside, you’ll find a spacious and inviting layout with multiple living areas, perfect for both everyday living and entertaining. The kitchen features ample cabinetry, formica countertops, and flows seamlessly into the dinette and formal dining area. The primary suite includes an en-suite bathroom and walk-in closet space, while the a
Key facts
- Walk-in closet space
- Mother-in-law suite
- Sizable backyard
Tags
Property features AI
Finance
- Other: In-law plan included; Property status: existing
- Financial info: Loan qualification available; Not assumable
- HOA & community: No mandatory association dues
Exterior
- Parking: Concrete driveway; 2-car garage
- Utilities: Electricity available; Natural gas available; Public water/sewer
- Home design: Single-family residence; One level; Residential property; Interior lot
- Construction: Brick and frame construction; Composition roof (replaced 2021); Slab foundation
- Exterior features: Covered patio; Covered porch; Screened porch; Rain gutters; Exterior storage
Interior
- Kitchen: Built-in range (gas); Dishwasher; Disposal
- Bedrooms: 4 bedrooms; Primary bedroom with ceiling fan, full bath and walk-in closet; Other bedrooms with ceiling fans
- Flooring: Carpet; Tile; Vinyl
- Bathrooms: 3 full bathrooms
- Interior features: Ceiling fans; Built-ins; Fireplace
- Laundry & utility: Inside utility
Neighborhood map
What this means for you Summary
Snapshot
- This is a 4-bed/2.0-bath single-family listed at $250k.
Deal economics
- At list price, monthly cash flow is $41 ($489/yr) — positive.
- The deal already cash-flows at list — no discount required.
- To meet the 1% rule (rent ≥ 1% of price), the offer needs to be $203k (18.5% below list).
- Recommended offer: $203k (18.5% below list) — sets the bar for 1% rule.
- Cap rate 6.5% vs local median 3.7% in Oklahoma City — top-decile yield for the area; either an underpriced asset or a hidden risk that comps aren't pricing in. Stress-test before assuming the spread holds.
Location & tenants
- Location reads 80/100 on livability (#3 in OK, #1,635 nationally) — a professional / high-income tenant draw. Strengths: amenities A+, commute A+, cost of living A+; Watch: crime F.
- Putnam City (urban): math 12% / reading 16% proficiency, ranked #227 of 270 in OK (top 84%) — low school quality limits family demand, transient renter base, plan for 1-2y turnover; 65% free/reduced lunch — lower-income household profile, screen leases tightly.
- Zoned schools: Dennis Es (math 27% / reading 27%, grade F, #311 of 845 statewide, top 40%, 513 students, 0% FRL); Putnam City North Hs (math 18% / reading 29%, grade F, #218 of 447 statewide, top 49%, 1,579 students, 0% FRL) — zoned schools average 0% FRL vs 65% district-wide (65 pts lower); this property's tenant base skews higher-income than the district average.
- Market conditions: Rents rising fast (+5.6%/yr); 166 active listings in the ZIP; 12 comparable units currently listed for rent nearby; rentals at typical pace (median 21d on market — plan ~3-4 weeks tenant-placement turnaround); solid renter incomes; 5,365 units permitted in Oklahoma County in 2024 (569 in 5+ unit buildings).
Forward outlook
- Local home prices are declining (-3.0%/yr); year-one equity from $2k of loan paydown is wiped out by about $7k of value loss. Plan a longer hold.
- Oklahoma County population projected at +41% by 2050 — long-run rental-demand tailwind backs the buy-and-hold thesis.
Negotiation context
- Only 3 days on market — expect competitive offers; lowballing is unlikely to land.
- Current owner paid $80k; list at $250k implies a 212% gain — meaningful room to come down on a strong offer.
Risks & watch-outs
- Climate carrying-cost: extreme-heat days projected 7→20/yr by 2055 (HVAC capex compounding) — expect insurance premiums to compound above CPI over the hold.
Questions for the listing agent
- Built in 1974 — when were the roof, HVAC, electrical panel, plumbing, and water heater last replaced?
- Is there a deadline driving the sale (1031 exchange, divorce, estate, relocation)? That informs how much negotiation room exists.
- Schools are F-rated, which usually means shorter tenancies and higher turnover. Who's the typical renter profile here, and what's been the actual vacancy rate?
- Crime grade is F in this area — have there been break-ins, vandalism, or insurance claims at this property in the last 3 years? What carrier currently insures it and at what premium?
- The area grade is low — what's the realistic commute time and amenity access for the typical tenant pool here? Any planned neighborhood developments (good or bad) we should know about?
- What's the average days-on-market for RENTAL listings here right now (not sales)? A rising rental-DOM trend means longer vacancies and softer asking-rent achievability than the comps imply.
- What's the recent tenant-quality profile in this submarket — average credit score on applications, eviction rate, late-payment / NSF rate, and stable-employment percentage? A property-management company in the area should have these aggregated.
- How much new for-sale + rental construction is in the pipeline within 1–3 miles? Heavy new supply typically softens prices + rents 12–24 months out; constrained supply supports both.
Investment metrics
- 1% rule
- 0.81% ✗
- Cap rate
- 6.49%
- Cash-on-cash
- 0.70%
- DSCR
- 1.03
- GRM
- 10.2
CMA / ARV
- ARV (on-the-fly)
- $311,360
- Comps found
- 12
Show comp detail 12 sales within ~0.75 mi
| Address | Dist | Beds/Ba | Sqft | Sold | Price | $/sf | Match |
|---|---|---|---|---|---|---|---|
| 5609 NW 114th St | 0.00mi | 4/3.0 | 2,224 (0%) | 0mo | $260,000 | $117 | 96 |
| 11717 Bellhurst Ave | 0.21mi | 3/2.0 (-1) | 2,151 (-3%) | 2mo | $325,000 | $151 | 78 |
| 11212 N Ann Arbor Ave | 0.38mi | 4/3.0 | 2,281 (+3%) | 0mo | $272,500 | $119 | 73 |
| 5508 NW 108th Ter | 0.41mi | 4/2.5 | 2,296 (+3%) | 5mo | $242,000 | $105 | 69 |
| 5213 NW 111th Ter | 0.31mi | 4/3.0 | 2,434 (+9%) | 0mo | $315,000 | $129 | 66 |
| 5524 NW 107 St | 0.49mi | 4/2.5 | 2,420 (+9%) | 3mo | $320,000 | $132 | 58 |
| 10716 Eastlake Cir | 0.57mi | 4/2.5 | 2,350 (+6%) | 5mo | $330,000 | $140 | 58 |
| 12301 Arthur Ave | 0.59mi | 3/2.0 (-1) | 2,107 (-5%) | 2mo | $380,000 | $180 | 57 |
| 5409 NW 121st St | 0.52mi | 3/2.5 (-1) | 2,400 (+8%) | 0mo | $400,000 | $167 | 55 |
| 10613 Whitechapel St | 0.57mi | 3/2.5 (-1) | 2,340 (+5%) | 5mo | $391,475 | $167 | 54 |
| 6120 Winchester Dr | 0.61mi | 4/3.0 | 2,390 (+8%) | 2mo | $289,000 | $121 | 54 |
| 12304 Maiden Ln | 0.63mi | 3/2.5 (-1) | 2,345 (+5%) | 4mo | $399,900 | $171 | 52 |
Match score weights: distance 35% · size 25% · config 20% · recency 20%. Top-matched comps best support the ARV.
Projected returns pro-forma
-3.0% appreciation · 5.59% rent growth · sell at horizon
- IRR
- -12.6%
- Equity multiple
- 0.54×
- Total profit
- $-32,508
- Equity at exit
- $37,243
- IRR
- -0.3%
- Equity multiple
- 0.98×
- Total profit
- $-1,701
- Equity at exit
- $21,596
Cash invested: $69,938 (down + closing). Projections, not guarantees.
Landlord ↔ Tenant lean methodology
- Overall (STATE)
- 83 Strongly Landlord-Friendly
- State Oklahoma
- 83 Strongly Landlord-Friendly · R+20
- County
- — inherits STATE
- City
- — inherits STATE
ZIP-level market 73162
- Rents YoY
- 5.6%
- Active inventory
- 166
- Price-to-rent
- 10.2×
Monthly cashflow live
- Estimated rent
- $2,035 high interval (Pro) →
- Mortgage (P&I)
- −$1,310
- Tax from tax record
- −$153 /mo · $1,833/yr
- Insurance
- −$104
- HOA
- −$0
- Vacancy / Maint / Mgmt
- −$427
- Net cashflow
- $41
Break-even live
UW: 25.0% down · 7.5% · 30yr · 1.5% tax · 5.0% vac · 8.0% maint · 8.0% mgmt
Financing live
Cash to close
- Down payment
- $62,444
- Closing costs
- $7,493
- Reserves months
- —
- Total cash needed
- —
Loan-product check · same deal, 3 products live
Conventional
25% down · 7.5% · 30yr
- Down + closing
- —
- Monthly P&I
- —
- Monthly cashflow
- —
- DSCR
- —
- Eligible?
- —
Personal DTI + credit; lowest rate.
DSCR
20% down · 8.5% · 30yr
- Down + closing
- —
- Monthly P&I
- —
- Monthly cashflow
- —
- DSCR
- —
- Eligible?
- —
No personal income docs; deal must DSCR.
Hard money
10% down · 12.0% · 12mo
- Down + closing
- —
- Monthly P&I
- —
- Monthly cashflow
- —
- DSCR
- —
- Eligible?
- —
Short-term bridge; refi at stabilization.
Rent comps 12 comps
| Address | Beds | Baths | Sqft | Rent | $/sqft | DOM | Units | Dist |
|---|---|---|---|---|---|---|---|---|
| 5613 NW 115th St Oklahoma City, OK | 4.0 | 2.0 | 1978 | $2,200 | $1.11 | 21d | 1 | 0.09mi |
| 12405 Bannockburn Pl Oklahoma City, OK | 3.0 | 2.0 | 1642 | $1,450 | $0.88 | 23d | 1 | 0.78mi |
| 4605 Dove Tree Ln Oklahoma City, OK | 3.0 | 2.0 | 1507 | $1,650 | $1.09 | 44d | 1 | 0.80mi |
| 10201 Island View Dr Oklahoma City, OK | 3.0 | 2.0 | 2023 | $1,700 | $0.84 | 2d | 1 | 0.86mi |
| 12400 Eric Field Pl Oklahoma City, OK | 3.0 | 3.0 | 2233 | $1,725 | $0.77 | 14d | 1 | 0.89mi |
| 12425 Acadia Ct Oklahoma City, OK | 3.0 | 2.0 | 1746 | $1,700 | $0.97 | 23d | 1 | 0.90mi |
| 6804 Elk Canyon Rd Oklahoma City, OK | 3.0 | 2.0 | 1725 | $1,400 | $0.81 | 4d | 1 | 1.26mi |
| 7136 NW 115th St Unit 7138 Oklahoma City, OK | 3.0 | 2.0 | 1489 | $1,325 | $0.89 | 23d | 1 | 1.27mi |
| 6913 Fawn Canyon Dr Oklahoma City, OK | 3.0 | 2.0 | 1572 | $1,699 | $1.08 | 21d | 1 | 1.27mi |
| 9605 Hefner Village Blvd Oklahoma City, OK | 3.0 | 2.5 | 1474 | $1,600 | $1.09 | 3d | 1 | 1.28mi |
| 7137 NW 116th St Unit 7137 Oklahoma City, OK | 3.0 | 2.0 | 1465 | $1,350 | $0.92 | 23d | 1 | 1.28mi |
| 7028 Elk Canyon Rd Oklahoma City, OK | 3.0 | 2.0 | 1404 | $1,495 | $1.06 | 17d | 1 | 1.40mi |
Listing history 4 events
-
2026-05-05status Pending
-
2026-05-01$249,777 Active
-
1992-09-24soldstatus $80,000
-
1982-12-01soldstatus $90,500
ⓘ Source: listings_history table (triggers on properties + properties_extension) + one-shot
backfill from property_details.listing_events for pre-trigger history.
Tax reassessment forecast OK · Resets to sale price
- Current annual tax
- $1,833 · $153/mo
- Projected year-2 tax
- $2,248 · $187/mo
- Expected delta
- +$415/yr (+$35/mo · 22.6%)
ⓘ Screening estimate from a state-policy table — verify with the county assessor before closing.
Climate risk First Street
- Flood 1/10 Low FEMA zone X (unshaded) · 0% chance over 30 yrs
- Wildfire 1/10 Low
- Heat 6/10 Major 7 d/yr ≥107°F today · 20 d/yr by 30 yrs out
- Wind 2/10 Low 2% chance of damaging wind over 30 yrs
- Air quality 2/10 Low 1 unhealthy d/yr today · 1 by 30 yrs out
Nearby sold comps map
Loading sold comps map…
Walkable amenities ~0.75 mi
Loading nearby amenities…
Taxation est. · year 1
- Rental income
- $24,417
- − Mortgage interest
- −$13,991
- − Property taxes
- −$1,833
- − Insurance
- −$1,249
- − Repairs & maintenance
- −$1,953
- − Management
- −$1,953
- − Depreciation
- −$7,266
- Taxable loss
- −$3,830
- Est. tax savings @ 24.0%
- +$919
- After-tax cash flow
- $1,408/yr
For passive investors: Depreciation is non-cash, so a rental often shows a tax loss while cash-flowing — sheltering income. Rental losses are passive: they offset passive income freely, and up to $25,000/yr can offset ordinary (W-2) income if you actively participate and your MAGI is under $100k (phasing out to $0 by $150k); unused losses carry forward. On sale, claimed depreciation is recaptured at up to 25%, and gains may owe capital-gains tax (a 1031 exchange can defer both). Figures are a year-1 estimate at your 24.0% rate — not tax advice; consult a CPA.
Schools (NCES district)
- District
- Putnam City
- NCES district ID
- 4025290
- Math proficiency
- 12% ▼ -18.00%
- Reading proficiency
- 16% ▼ -14.00%
- Median HH income
- $46,657
- Composite
- 12.61/100
- National rank
- #9614
- State rank
- #227 of 270 in OK
Livability — Oklahoma City
- Score
- 80/100
- State rank
- #3
- US rank
- #1635
Category grades
Schools grade is shown separately in the Schools card above.
Census & demographics
- Census place
- Oklahoma City, OK
- County
- Oklahoma County · 771,644 people
- City population
- 498,656
- Metro
- Oklahoma City, OK
- Population (ZIP)
- 28,728
- Household income
- $88,031
- Rent vs Own
- Severe rent burden
- 913.0
Population outlook (Oklahoma County) Hauer SSP2
- Today (2025)
- 911,875 people
- By 2030
- 982,413 · +7.7%
- By 2040
- 1,130,468 · +24.0%
- By 2050
- 1,288,422 · +41.3%
- By 2075
- 1,711,482 · +87.7%
- By 2100
- 2,088,448 · +129.0%
Race, ethnicity, and origin ACS 2023
- Neighborhood character
- Diverse neighborhood (Simpson 0.59)
- Race & ethnicity
- White 62% Black 14% Two or more races 11% Hispanic / Latino 8% Asian 6% Native American 2%
- Hispanic origin (detail)
- Mexican 5%
- Common ancestry
- Slovak 4% Italian 2% Serbian 1%
- Foreign-born
- 8% · Vietnam, Canada, China
- Languages at home
- 90% English-only · Spanish 4% Vietnamese 2% Other Asian/Pacific 1%
Political lean MEDSL · Oklahoma
- 2024 margin
- Toss-up / Even · D 48.0% · R 49.7% · Other 2.3%
- 2008→2024 swing
- +15.1pp toward D · 2008: -16.8pp · 2024: -1.7pp
- All cycles
- 2024: R+1.7 2020: R+1.1 2016: R+10.5 2012: R+16.7 2008: R+16.8
Not yet ingested
- Civics
- —
Market trends
- HPI YoY
- ▼ -172.35%
- Current HPI
- 205.6639
- Rent YoY
- ▲ 5.59%
- Metro
- Oklahoma City, OK
- State GDP YoY
- ▲ 1.55%
- F500 in state
- 6
Industry mix (Fortune 500 HQ in OK)
| Industry | F500 HQs | Revenue |
|---|---|---|
| Energy | 3 | $48B |
|
||
Price history
+176.0% since first listed4 events — show timeline
- 2026-05-05 Pending — MLSOK
- 2026-05-01 Listed $249,777 MLSOK
- 1992-09-24 Sold (Public Records) $80,000 Public Records
- 1982-12-01 Sold (Public Records) $90,500 Public Records
Property tax history
+2.0%/yrLatest (2016): $1,833 · +1.4% YoY. Source: county tax records.
Cash-flow waterfall
monthlySold comps — $/sqft
last 12 mo · ≤1 miLoading sold comps…