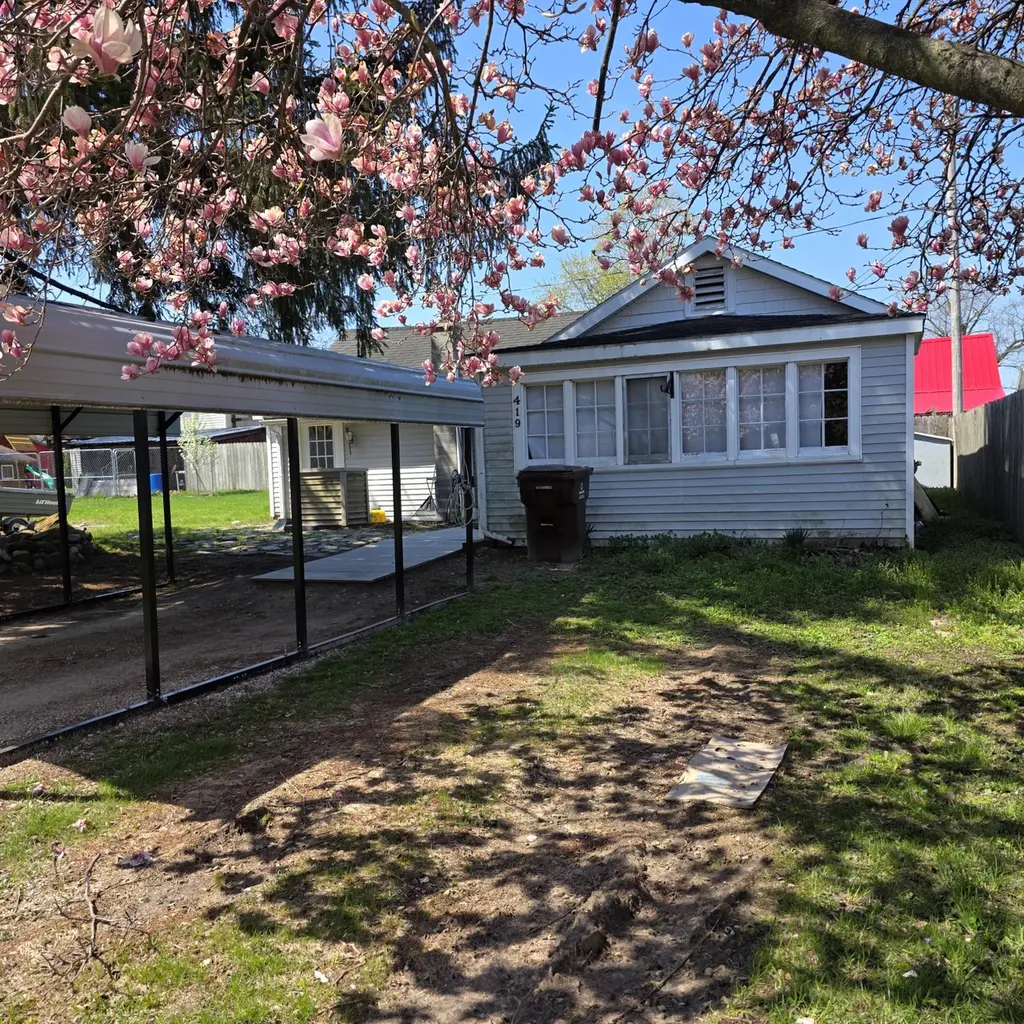
419 Jermyn St · Ionia, MI
Flood risk 1/10 · Minimal
- FEMA flood zone
- X (unshaded)
- Chance of flooding over 30 yrs
- 0.0%
- Est. flood insurance / yr
- $473 – $860
Fire risk 1/10 · Minimal
- Est. fire insurance / yr
- $784 – $1,456
Heat risk 2/10 · Minimal
- Hot days now (above 97°F)
- 7 days/yr
- Hot days in 30 yrs
- 15 days/yr
Wind risk 2/10 · Minimal
- Chance of severe wind over 30 yrs
- —
Air-quality risk 2/10 · Minimal
- Unhealthy air days now
- 1 days/yr
- Unhealthy air days in 30 yrs
- 2 days/yr
Risk factors via First Street. Map © Google.
Why this score? — see what drove the C+ grade
The composite is a weighted blend of 9 inputs, each scored 0–100. Each bar is that input's sub-score; the figure is the points it added to the 100-point composite (weight × sub-score).
- Cash flow +24.4/30.0
- ARV discount +15.0/15.0
- DSCR +7.9/10.0
- 1% rule +6.1/10.0
- Livability +3.6/5.0
- Schools +2.6/10.0
- Rent growth +2.5/5.0
- Condition / age +2.5/5.0
- Appreciation +0.0/10.0
$115,000
🖨 Deal sheet 📄 Offer letter ✓ Due diligence
Listing remarks MLS
Welcome to 419 Jermyn St, a great investment opportunity! This 2-bed, 1-bath ranch offers 815 sqft of living space on a 0.14 acre lot with Public Water & Sewer, including a traditional Michigan Dirt Basement, and carport for parking your vehicle!The home features a brand new water heater, and a functional layout, updated flooring and kitchen, making it a solid option for investors or buyers looking to build equity, or downsize. Schedule your private showing today!
Key facts
- Carport
- New water heater
- Updated flooring
Tags
Neighborhood map
What this means for you Summary
Snapshot
- This is a 2-bed/1.0-bath single-family listed at $115k.
Deal economics
- At list price, monthly cash flow is $234 ($3k/yr) — positive.
- The deal already cash-flows at list — no discount required.
- Meets the 1% rule at list price ($1k rent vs $115k).
- Cap rate 8.7% vs local median 3.9% in Ionia — top-decile yield for the area; either an underpriced asset or a hidden risk that comps aren't pricing in. Stress-test before assuming the spread holds.
Location & tenants
- Location reads 71/100 on livability (#276 in MI) — a middle-class / working-renter tenant base. Strengths: cost of living A+, housing A+, crime A; Watch: schools F, amenities F, commute F.
- Ionia Public Schools (town): math 23% / reading 39% proficiency, ranked #353 of 540 in MI (top 65%) — families likely to look elsewhere, expect single-tenant / working-renter base with shorter leases.
- Market conditions: 87 active listings in the ZIP; 94 units permitted in Ionia County in 2024 (0 in 5+ unit buildings).
Forward outlook
- Local home prices are declining (-3.0%/yr); year-one equity from $795 of loan paydown is wiped out by about $3k of value loss. Plan a longer hold.
- Ionia County population projected to shrink 8% by 2050 — rents likely to lag national; underwrite the cash flow, not the appreciation.
Negotiation context
- Only 5 days on market — expect competitive offers; lowballing is unlikely to land.
- 6 sale attempts since 3y ago with the ask held roughly flat each time — persistent listings suggest the price (not the market) is what's stuck; bring a comps-based counter.
Risks & watch-outs
- Watch-outs: built in 1910 — expect roof / HVAC / electrical / plumbing capex.
Questions for the listing agent
- Built in 1910 — when were the roof, HVAC, electrical panel, plumbing, and water heater last replaced?
- Is there a deadline driving the sale (1031 exchange, divorce, estate, relocation)? That informs how much negotiation room exists.
- Schools are F-rated, which usually means shorter tenancies and higher turnover. Who's the typical renter profile here, and what's been the actual vacancy rate?
- What's the average days-on-market for RENTAL listings here right now (not sales)? A rising rental-DOM trend means longer vacancies and softer asking-rent achievability than the comps imply.
- What's the recent tenant-quality profile in this submarket — average credit score on applications, eviction rate, late-payment / NSF rate, and stable-employment percentage? A property-management company in the area should have these aggregated.
- How much new for-sale + rental construction is in the pipeline within 1–3 miles? Heavy new supply typically softens prices + rents 12–24 months out; constrained supply supports both.
Investment metrics
- 1% rule
- 1.11% ✓
- Cap rate
- 8.73%
- Cash-on-cash
- 8.71%
- DSCR
- 1.39
- GRM
- 7.5
CMA / ARV
- ARV (on-the-fly)
- $157,295
- Comps found
- 9
Show comp detail 9 sales within ~0.75 mi
| Address | Dist | Beds/Ba | Sqft | Sold | Price | $/sf | Match |
|---|---|---|---|---|---|---|---|
| 510 Beresford St | 0.20mi | 2/1.0 | 786 (-4%) | 7mo | $95,000 | $121 | 79 |
| 540 Nicholson St | 0.32mi | 2/1.0 | 860 (+6%) | 4mo | $122,000 | $142 | 72 |
| 820 Hackett St | 0.32mi | 2/1.0 | 792 (-3%) | 10mo | $150,000 | $189 | 72 |
| 547 Jermyn St | 0.25mi | 2/1.0 | 862 (+6%) | 20mo | $183,000 | $212 | 62 |
| 518 N State St | 0.50mi | 3/1.0 (+1) | 864 (+6%) | 1mo | $201,500 | $233 | 61 |
| 812 Forest St | 0.46mi | 2/1.0 | 736 (-10%) | 11mo | $171,500 | $233 | 53 |
| 439 Taylor Ct | 0.50mi | 3/1.0 (+1) | 882 (+8%) | 12mo | $170,000 | $193 | 48 |
| 409 Taylor Ct | 0.51mi | 2/1.0 | 712 (-13%) | 14mo | $145,900 | $205 | 44 |
| 419 Forest St | 0.74mi | 2/1.0 | 924 (+13%) | 21mo | $174,800 | $189 | 26 |
Match score weights: distance 35% · size 25% · config 20% · recency 20%. Top-matched comps best support the ARV.
Projected returns pro-forma
-3.0% appreciation · 3.0% rent growth · sell at horizon
- IRR
- -3.1%
- Equity multiple
- 0.88×
- Total profit
- $-3,739
- Equity at exit
- $17,147
- IRR
- 6.6%
- Equity multiple
- 1.49×
- Total profit
- $15,937
- Equity at exit
- $9,943
Cash invested: $32,200 (down + closing). Projections, not guarantees.
Landlord ↔ Tenant lean methodology
- Overall (STATE)
- 62 Landlord-Friendly
- State Michigan
- 62 Landlord-Friendly · EVEN
- County
- — inherits STATE
- City
- — inherits STATE
ZIP-level market 48846
- Active inventory
- 87
- Price-to-rent
- 7.5×
Monthly cashflow live
- Estimated rent
- $1,271 medium interval (Pro) →
- Mortgage (P&I)
- −$603
- Tax from tax record
- −$119 /mo · $1,432/yr
- Insurance
- −$48
- HOA
- −$0
- Vacancy / Maint / Mgmt
- −$267
- Net cashflow
- $234
Break-even live
UW: 25.0% down · 7.5% · 30yr · 1.5% tax · 5.0% vac · 8.0% maint · 8.0% mgmt
Financing live
Cash to close
- Down payment
- $28,750
- Closing costs
- $3,450
- Reserves months
- —
- Total cash needed
- —
Loan-product check · same deal, 3 products live
Conventional
25% down · 7.5% · 30yr
- Down + closing
- —
- Monthly P&I
- —
- Monthly cashflow
- —
- DSCR
- —
- Eligible?
- —
Personal DTI + credit; lowest rate.
DSCR
20% down · 8.5% · 30yr
- Down + closing
- —
- Monthly P&I
- —
- Monthly cashflow
- —
- DSCR
- —
- Eligible?
- —
No personal income docs; deal must DSCR.
Hard money
10% down · 12.0% · 12mo
- Down + closing
- —
- Monthly P&I
- —
- Monthly cashflow
- —
- DSCR
- —
- Eligible?
- —
Short-term bridge; refi at stabilization.
Listing history 16 events
-
2026-04-28status Pending 474-char remark
Show marketing remark (474 chars)
Welcome to 419 Jermyn St, a great investment opportunity! This 2-bed, 1-bath ranch offers 815 sqft of living space on a 0.14 acre lot with Public Water & Sewer, including a traditional Michigan Dirt Basement, and carport for parking your vehicle!The home features a brand new water heater, and a functional layout, updated flooring and kitchen, making it a solid option for investors or buyers looking to build equity, or downsize. Schedule your private showing today!
-
2026-04-27status Pending
-
2026-04-22$115,000 Active 474-char remark
Show marketing remark (474 chars)
Welcome to 419 Jermyn St, a great investment opportunity! This 2-bed, 1-bath ranch offers 815 sqft of living space on a 0.14 acre lot with Public Water & Sewer, including a traditional Michigan Dirt Basement, and carport for parking your vehicle!The home features a brand new water heater, and a functional layout, updated flooring and kitchen, making it a solid option for investors or buyers looking to build equity, or downsize. Schedule your private showing today!
-
2026-04-22$115,000 Active
Show marketing remark (474 chars)
Welcome to 419 Jermyn St, a great investment opportunity! This 2-bed, 1-bath ranch offers 815 sqft of living space on a 0.14 acre lot with Public Water & Sewer, including a traditional Michigan Dirt Basement, and carport for parking your vehicle!The home features a brand new water heater, and a functional layout, updated flooring and kitchen, making it a solid option for investors or buyers looking to build equity, or downsize. Schedule your private showing today!
-
2023-11-09soldstatus $110,000 Sold
-
2023-11-09soldstatus $110,000 Sold
-
2023-11-09soldstatus $110,000 Closed
-
2023-11-08soldstatus $110,100
-
2023-10-20status Pending
-
2023-10-20status Pending
-
2023-10-20status Pending
-
2023-10-16$99,900 Active
-
2023-10-16$99,900 Active
-
2023-10-16$99,900 Active
ⓘ Source: listings_history table (triggers on properties + properties_extension) + one-shot
backfill from property_details.listing_events for pre-trigger history.
Tax reassessment forecast MI · Partial reset (capped growth)
- Current annual tax
- $1,432 · $119/mo
- Projected year-2 tax
- $1,602 · $133/mo
- Expected delta
- +$169/yr (+$14/mo · 11.8%)
ⓘ Screening estimate from a state-policy table — verify with the county assessor before closing.
Climate risk First Street
- Flood 1/10 Low FEMA zone X (unshaded) · 0% chance over 30 yrs
- Wildfire 1/10 Low
- Heat 2/10 Low 7 d/yr ≥97°F today · 15 d/yr by 30 yrs out
- Wind 2/10 Low
- Air quality 2/10 Low 1 unhealthy d/yr today · 2 by 30 yrs out
Nearby sold comps map
Loading sold comps map…
Walkable amenities ~0.75 mi
Loading nearby amenities…
Taxation est. · year 1
- Rental income
- $15,253
- − Mortgage interest
- −$6,442
- − Property taxes
- −$1,432
- − Insurance
- −$575
- − Repairs & maintenance
- −$1,220
- − Management
- −$1,220
- − Depreciation
- −$3,345
- Taxable income
- $1,018
- Est. tax owed @ 24.0%
- −$244
- After-tax cash flow
- $2,561/yr
For passive investors: Depreciation is non-cash, so a rental often shows a tax loss while cash-flowing — sheltering income. Rental losses are passive: they offset passive income freely, and up to $25,000/yr can offset ordinary (W-2) income if you actively participate and your MAGI is under $100k (phasing out to $0 by $150k); unused losses carry forward. On sale, claimed depreciation is recaptured at up to 25%, and gains may owe capital-gains tax (a 1031 exchange can defer both). Figures are a year-1 estimate at your 24.0% rate — not tax advice; consult a CPA.
Schools (NCES district)
- District
- Ionia Public Schools
- NCES district ID
- 2619250
- Math proficiency
- 23% ▼ -11.00%
- Reading proficiency
- 39% ▼ -8.00%
- Median HH income
- $41,130
- Composite
- 26.12/100
- National rank
- #7283
- State rank
- #353 of 540 in MI
Livability — Ionia
- Score
- 71/100
- State rank
- #276
- US rank
- #6795
Category grades
Schools grade is shown separately in the Schools card above.
Census & demographics
- City population
- 21,940
- Population (ZIP)
- 21,940
Population outlook (Ionia County) Hauer SSP2
- Today (2025)
- 63,958 people
- By 2030
- 63,321 · -1.0%
- By 2040
- 61,544 · -3.8%
- By 2050
- 58,682 · -8.2%
- By 2075
- 48,909 · -23.5%
- By 2100
- 35,867 · -43.9%
Race, ethnicity, and origin ACS 2023
- Neighborhood character
- Predominantly White (78%)
- Race & ethnicity
- White 78% Black 10% Two or more races 8% Hispanic / Latino 7%
- Hispanic origin (detail)
- Mexican 6% Puerto Rican 1%
- Common ancestry
- Iranian 7% Romanian 3% Italian 3%
- Foreign-born
- 1% · Canada
- Languages at home
- 97% English-only · Spanish 3%
Political lean MEDSL · Ionia
- 2024 margin
- Solid R (+31.9) · D 33.3% · R 65.2% · Other 1.5%
- 2008→2024 swing
- -26.0pp toward R · 2008: -5.8pp · 2024: -31.9pp
- All cycles
- 2024: R+31.9 2020: R+30.3 2016: R+31.0 2012: R+12.8 2008: R+5.8
Not yet ingested
- Civics
- —
Market trends
- HPI YoY
- ▼ -134.67%
- Current HPI
- 247.6648
- Rent YoY
- —
- Metro
- —
- State GDP YoY
- ▲ 1.37%
- F500 in state
- 28
Industry mix (Fortune 500 HQ in MI)
| Industry | F500 HQs | Revenue |
|---|---|---|
| Automotive Parts | 3 | $48B |
|
||
| Automotive | 2 | $372B |
|
||
| Chemicals | 1 | $45B |
|
||
| Automotive Retail | 1 | $29B |
|
||
| Healthcare / Medical Devices | 1 | $23B |
|
||
| Automotive Technology | 1 | $20B |
|
||
Price history
+15.1% since first listed16 events — show timeline
- 2026-04-28 Pending — MiRealSource-MiMLS
- 2026-04-28 Pending — REALCOMP
- 2026-04-27 Pending — SW Michigan MLS
- 2026-04-22 Listed $115,000 SW Michigan MLS
- 2026-04-22 Listed $115,000 REALCOMP
- 2026-04-22 Listed $115,000 MiRealSource-MiMLS
- 2023-11-09 Sold (MLS) $110,000 MiRealSource-MiMLS
- 2023-11-09 Sold (MLS) $110,000 SW Michigan MLS
- 2023-11-09 Sold (MLS) $110,000 REALCOMP
- 2023-11-08 Sold (Public Records) $110,100 Public Records
- 2023-10-20 Pending — MiRealSource-MiMLS
- 2023-10-20 Pending — REALCOMP
- 2023-10-20 Pending — SW Michigan MLS
- 2023-10-16 Listed $99,900 MiRealSource-MiMLS
- 2023-10-16 Listed $99,900 SW Michigan MLS
- 2023-10-16 Listed $99,900 REALCOMP
Property tax history
+19.0%/yrLatest (2025): $1,432 · +3.0% YoY. Source: county tax records.
Cash-flow waterfall
monthlySold comps — $/sqft
last 12 mo · ≤1 miLoading sold comps…