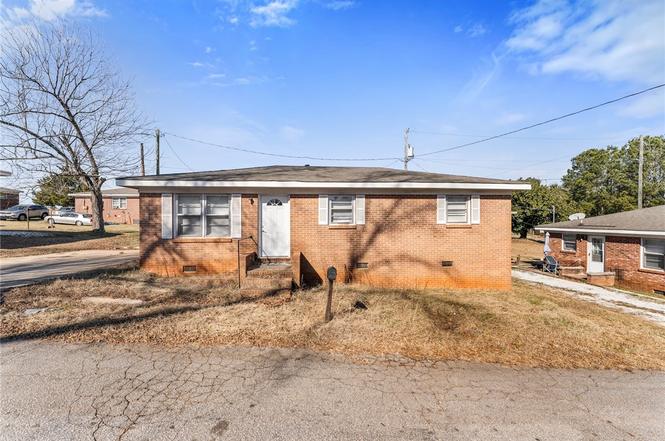
103 Linda Dr · Seneca, SC
Flood risk 1/10 · Minimal
- FEMA flood zone
- X (unshaded)
- Chance of flooding over 30 yrs
- 0.0%
- Est. flood insurance / yr
- $507 – $1,088
Fire risk 4/10 · Minor
- Est. fire insurance / yr
- $783 – $1,453
Heat risk 6/10 · Moderate
- Hot days now (above 104°F)
- 7 days/yr
- Hot days in 30 yrs
- 17 days/yr
Wind risk 2/10 · Minimal
- Chance of severe wind over 30 yrs
- 1.0%
Air-quality risk 3/10 · Minor
- Unhealthy air days now
- 3 days/yr
- Unhealthy air days in 30 yrs
- 3 days/yr
Risk factors via First Street. Map © Google.
Why this score? — see what drove the C- grade
The composite is a weighted blend of 9 inputs, each scored 0–100. Each bar is that input's sub-score; the figure is the points it added to the 100-point composite (weight × sub-score).
- Cash flow +15.8/30.0
- ARV discount +13.2/15.0
- DSCR +4.9/10.0
- Rent growth +4.4/5.0
- Schools +3.7/10.0
- Livability +3.7/5.0
- 1% rule +3.1/10.0
- Condition / age +2.5/5.0
- Appreciation +0.0/10.0
$160,000
🖨 Deal sheet 📄 Offer letter ✓ Due diligence
Listing remarks MLS
This charming brick 3 bedroom, 1 bath home features a combined kitchen and dining area and a cozy living room perfect for relaxing. Recent updates include new piers, joists, subflooring, and vapor barrier in the crawl space, along with new LVP flooring in the kitchen, dining area, hallway and bathroom. Fresh paint and updated shower wall panels add to the appeal! Conveniently located just 5 minutes from Ram Cat Alley, 9 minutes from Lake Keowee Marina, and 12 minutes from Clemson University, this property offers easy access to shopping, dining, recreation, and campus amenities. Previously used as a rental property, this home presents an excellent opportunity for investors, first-time homebuyers, or those looking to downsize. Don't miss your chance to see this move-in-ready home!
Key facts
- New piers
- Cozy living room
- New vapor barrier
Tags
Property features AI
Finance
- Other: Lead-based paint disclosure required; Residential property disclosure required
- HOA & community: No HOA fees
Exterior
- Parking: Paved concrete driveway
- Utilities: Public water; Public sewer; Public garbage pickup; Electric water heater; Electric and natural gas heating via heat pump
- Home design: Single-story property; Built in 1972; Crawl space foundation; Architectural roof
- Construction: Brick veneer exterior; Architectural roof; Crawl space foundation; Approximate year built: 1972
- Exterior features: Level lot; Brick veneer (full)
Interior
- Kitchen: Kitchen approx. 11 x 11; Refrigerator; Electric freestanding range
- Bedrooms: Three bedrooms on the main level; Primary bedroom on main level (approx. 11 x 11); Second bedroom approx. 11 x 10; Third bedroom approx. 11 x 10
- Flooring: Ceramic tile; Luxury vinyl tile/plank
- Bathrooms: One full bathroom (main level)
- Heating & cooling: Heat pump (provides heating and cooling); Natural gas heating available; Electric water heater
- Interior features: Laminate countertops; No fireplace; Breakfast area
- Laundry & utility: Washer and dryer; Laundry located in the kitchen
Neighborhood map
What this means for you Summary
Snapshot
- This is a 2-bed/1.0-bath single-family listed at $160k.
Deal economics
- At list price, monthly cash flow is $73 ($878/yr) — positive.
- The deal already cash-flows at list — no discount required.
- To meet the 1% rule (rent ≥ 1% of price), the offer needs to be $129k (19.3% below list).
- Recommended offer: $129k (19.3% below list) — sets the bar for 1% rule.
- Cap rate 6.8% vs local median 3.4% in Seneca — top-decile yield for the area; either an underpriced asset or a hidden risk that comps aren't pricing in. Stress-test before assuming the spread holds.
Location & tenants
- Location reads 73/100 on livability (#40 in SC) — a middle-class / working-renter tenant base. Strengths: cost of living A+, housing A+, health & safety A+; Watch: amenities C-, crime F, commute F.
- Oconee 01 (rural): math 41% / reading 47% proficiency, ranked #27 of 80 in SC (top 34%) — families likely to look elsewhere, expect single-tenant / working-renter base with shorter leases.
- Zoned schools: Blue Ridge Elementary (math 29% / reading 25%, grade F, #421 of 597 statewide, top 73%, 597 students, 100% FRL) — zoned schools average 100% FRL vs 50% district-wide (50 pts higher); higher-poverty schools than district average — tighter screening recommended.
- Zoned-school proficiency averages 27% at this address vs 44% district-wide (-17 pts) — the specific schools serving this property underperform the Oconee 01 average; the district grade overstates school quality for this exact location.
- Market conditions: Rents rising fast (+7.7%/yr); 367 active listings in the ZIP; 1 comparable units currently listed for rent nearby; 648 units permitted in Oconee County in 2024 (40 in 5+ unit buildings).
Forward outlook
- Local home prices are declining (-3.0%/yr); year-one equity from $1k of loan paydown is wiped out by about $5k of value loss. Plan a longer hold.
Negotiation context
- Only 7 days on market — expect competitive offers; lowballing is unlikely to land.
- 14 sale attempts since 2y ago with the ask held roughly flat each time — persistent listings suggest the price (not the market) is what's stuck; bring a comps-based counter.
Risks & watch-outs
- Climate carrying-cost: extreme-heat days projected 7→17/yr by 2055 (HVAC capex compounding) — expect insurance premiums to compound above CPI over the hold.
Questions for the listing agent
- Built in 1972 — when were the roof, HVAC, electrical panel, plumbing, and water heater last replaced?
- Is there a deadline driving the sale (1031 exchange, divorce, estate, relocation)? That informs how much negotiation room exists.
- Schools are D-rated, which usually means shorter tenancies and higher turnover. Who's the typical renter profile here, and what's been the actual vacancy rate?
- Crime grade is F in this area — have there been break-ins, vandalism, or insurance claims at this property in the last 3 years? What carrier currently insures it and at what premium?
- What's the average days-on-market for RENTAL listings here right now (not sales)? A rising rental-DOM trend means longer vacancies and softer asking-rent achievability than the comps imply.
- What's the recent tenant-quality profile in this submarket — average credit score on applications, eviction rate, late-payment / NSF rate, and stable-employment percentage? A property-management company in the area should have these aggregated.
- How much new for-sale + rental construction is in the pipeline within 1–3 miles? Heavy new supply typically softens prices + rents 12–24 months out; constrained supply supports both.
Investment metrics
- 1% rule
- 0.81% ✗
- Cap rate
- 6.84%
- Cash-on-cash
- 1.96%
- DSCR
- 1.09
- GRM
- 10.3
CMA / ARV
- ARV (on-the-fly)
- $183,360
- Comps found
- 12
Show comp detail 12 sales within ~0.75 mi
| Address | Dist | Beds/Ba | Sqft | Sold | Price | $/sf | Match |
|---|---|---|---|---|---|---|---|
| 600 S Stribling St | 0.13mi | 2/2.0 | 1,015 (+6%) | 8mo | $220,000 | $217 | 74 |
| 306 S Stribling St | 0.29mi | 3/2.0 (+1) | 963 (+0%) | 10mo | $198,000 | $206 | 68 |
| 917 E South 2nd St | 0.33mi | 3/2.0 (+1) | 1,000 (+4%) | 1mo | $192,000 | $192 | 68 |
| 1000 Overbrook Dr | 0.18mi | 2/1.0 | 832 (-13%) | 2mo | $180,000 | $216 | 68 |
| 216 S Stribling St | 0.32mi | 2/2.0 | 1,045 (+9%) | 1mo | $199,900 | $191 | 65 |
| 134 Marshall Ave | 0.40mi | 2/1.0 | 886 (-8%) | 5mo | $142,160 | $160 | 65 |
| 11 Humbert St | 0.37mi | 2/1.0 | 850 (-12%) | 0mo | $67,900 | $80 | 63 |
| 2505 E Brown St | 0.45mi | 2/1.0 | 837 (-13%) | 0mo | $138,000 | $165 | 58 |
| 32 Ames St | 0.55mi | 2/1.0 | 873 (-9%) | 2mo | $45,000 | $52 | 58 |
| 536 E South 5th St | 0.50mi | 2/2.0 | 864 (-10%) | 3mo | $195,000 | $226 | 54 |
| 1201 Goddard Ave | 0.58mi | 2/1.0 | 873 (-9%) | 6mo | $40,000 | $46 | 53 |
| 29 Humbert St | 0.47mi | 2/1.0 | 816 (-15%) | 3mo | $87,500 | $107 | 51 |
Match score weights: distance 35% · size 25% · config 20% · recency 20%. Top-matched comps best support the ARV.
Projected returns pro-forma
-3.0% appreciation · 7.71% rent growth · sell at horizon
- IRR
- -8.7%
- Equity multiple
- 0.67×
- Total profit
- $-14,938
- Equity at exit
- $23,857
- IRR
- 5.5%
- Equity multiple
- 1.48×
- Total profit
- $21,655
- Equity at exit
- $13,834
Cash invested: $44,800 (down + closing). Projections, not guarantees.
Landlord ↔ Tenant lean methodology
- Overall (STATE)
- 90 Strongly Landlord-Friendly
- State South Carolina
- 90 Strongly Landlord-Friendly · R+6
- County
- — inherits STATE
- City
- — inherits STATE
ZIP-level market 29678
- Home prices YoY
- -32.5%
- Rents YoY
- 7.7%
- Active inventory
- 367
- Price-to-rent
- 10.3×
Monthly cashflow live
- Estimated rent
- $1,291 medium interval (Pro) →
- Mortgage (P&I)
- −$839
- Tax from tax record
- −$41 /mo · $487/yr
- Insurance
- −$67
- HOA
- −$0
- Vacancy / Maint / Mgmt
- −$271
- Net cashflow
- $73
Break-even live
UW: 25.0% down · 7.5% · 30yr · 1.5% tax · 5.0% vac · 8.0% maint · 8.0% mgmt
Financing live
Cash to close
- Down payment
- $40,000
- Closing costs
- $4,800
- Reserves months
- —
- Total cash needed
- —
Loan-product check · same deal, 3 products live
Conventional
25% down · 7.5% · 30yr
- Down + closing
- —
- Monthly P&I
- —
- Monthly cashflow
- —
- DSCR
- —
- Eligible?
- —
Personal DTI + credit; lowest rate.
DSCR
20% down · 8.5% · 30yr
- Down + closing
- —
- Monthly P&I
- —
- Monthly cashflow
- —
- DSCR
- —
- Eligible?
- —
No personal income docs; deal must DSCR.
Hard money
10% down · 12.0% · 12mo
- Down + closing
- —
- Monthly P&I
- —
- Monthly cashflow
- —
- DSCR
- —
- Eligible?
- —
Short-term bridge; refi at stabilization.
Rent comps 1 comps
| Address | Beds | Baths | Sqft | Rent | $/sqft | DOM | Units | Dist |
|---|---|---|---|---|---|---|---|---|
| 804 Hunter Oaks Dr Seneca, SC | 2.0–3.0 | 2.0 | 1153 | $895 | $0.78 | 23d | 1 | 1.15mi |
Listing history 6 events
-
2026-06-18days on market $160,000 Active 7 DOM
-
2026-06-17days on market $160,000 Active 6 DOM
-
2026-06-16days on market $160,000 Active 5 DOM
-
2026-06-15days on market $160,000 Active 4 DOM
-
2026-06-13remarks 699-char remark
-
2026-06-13$160,000 Active 2 DOM
ⓘ Source: listings_history table (triggers on properties + properties_extension) + one-shot
backfill from property_details.listing_events for pre-trigger history.
Tax reassessment forecast SC · Resets to sale price
- Current annual tax
- $487 · $41/mo
- Projected year-2 tax
- $912 · $76/mo
- Expected delta
- +$425/yr (+$35/mo · 87.1%)
ⓘ Screening estimate from a state-policy table — verify with the county assessor before closing.
Climate risk First Street
- Flood 1/10 Low FEMA zone X (unshaded) · 0% chance over 30 yrs
- Wildfire 4/10 Moderate
- Heat 6/10 Major 7 d/yr ≥104°F today · 17 d/yr by 30 yrs out
- Wind 2/10 Low 100% chance of damaging wind over 30 yrs
- Air quality 3/10 Moderate 3 unhealthy d/yr today · 3 by 30 yrs out
Nearby sold comps map
Loading sold comps map…
Walkable amenities ~0.75 mi
Loading nearby amenities…
Taxation est. · year 1
- Rental income
- $15,486
- − Mortgage interest
- −$8,962
- − Property taxes
- −$487
- − Insurance
- −$800
- − Repairs & maintenance
- −$1,239
- − Management
- −$1,239
- − Depreciation
- −$4,655
- Taxable loss
- −$1,896
- Est. tax savings @ 24.0%
- +$455
- After-tax cash flow
- $1,333/yr
For passive investors: Depreciation is non-cash, so a rental often shows a tax loss while cash-flowing — sheltering income. Rental losses are passive: they offset passive income freely, and up to $25,000/yr can offset ordinary (W-2) income if you actively participate and your MAGI is under $100k (phasing out to $0 by $150k); unused losses carry forward. On sale, claimed depreciation is recaptured at up to 25%, and gains may owe capital-gains tax (a 1031 exchange can defer both). Figures are a year-1 estimate at your 24.0% rate — not tax advice; consult a CPA.
Schools (NCES district)
- District
- Oconee 01
- NCES district ID
- 4503060
- Math proficiency
- 41% ▼ -7.00%
- Reading proficiency
- 47% ▼ -1.00%
- Median HH income
- $42,074
- Composite
- 37.03/100
- National rank
- #4516
- State rank
- #27 of 80 in SC
Livability — Seneca
- Score
- 73/100
- State rank
- #40
- US rank
- #5072
Category grades
Schools grade is shown separately in the Schools card above.
Census & demographics
- Census place
- Seneca, SC
- County
- Oconee County · 36,517 people
- City population
- 36,517
- Metro
- Seneca, SC
- Population (ZIP)
- 23,767
- Household income
- $52,550
- Rent vs Own
- Severe rent burden
- 822.0
Population outlook (Oconee County) Hauer SSP2
- Today (2025)
- 77,950 people
- By 2030
- 78,551 · +0.8%
- By 2040
- 78,628 · +0.9%
- By 2050
- 77,052 · -1.2%
- By 2075
- 71,098 · -8.8%
- By 2100
- 61,216 · -21.5%
Race, ethnicity, and origin ACS 2023
- Neighborhood character
- Predominantly White (74%)
- Race & ethnicity
- White 74% Black 18% Two or more races 5% Hispanic / Latino 4%
- Common ancestry
- Slovak 2% Lithuanian 2% Italian 2%
- Foreign-born
- 2% · Canada, United Kingdom
- Languages at home
- 97% English-only · Spanish 1% French/Haitian/Cajun 1%
Political lean MEDSL · Oconee
- 2024 margin
- Solid R (+51.5) · D 23.6% · R 75.2% · Other 1.2%
- 2008→2024 swing
- -14.0pp toward R · 2008: -37.5pp · 2024: -51.5pp
- All cycles
- 2024: R+51.5 2020: R+47.4 2016: R+48.1 2012: R+42.6 2008: R+37.5
Not yet ingested
- Civics
- —
Market trends
- HPI YoY
- ▼ -91.37%
- Current HPI
- 189.6751
- Rent YoY
- ▲ 7.71%
- Metro
- Seneca, SC
- State GDP YoY
- ▲ 4.51%
- F500 in state
- 2
Industry mix (Fortune 500 HQ in SC)
| Industry | F500 HQs | Revenue |
|---|---|---|
| Packaging | 1 | $7B |
|
||
Price history
-19.6% since first listed35 events — show timeline
- 2026-06-11 Listed $160,000 WUMLS
- 2026-06-11 Listed $160,000 Greater Greenville MLS
- 2025-11-15 Listing Removed — Greater Greenville MLS
- 2025-11-15 Listing Removed — WUMLS
- 2025-11-03 Contingent — WUMLS
- 2025-11-03 Contingent — Greater Greenville MLS
- 2025-10-23 Listed $95,000 Greater Greenville MLS
- 2025-10-23 Listed $95,000 WUMLS
- 2025-07-15 Listing Removed — WUMLS
- 2025-07-15 Listing Removed — Greater Greenville MLS
- 2025-07-14 Relisted — Greater Greenville MLS
- 2025-07-14 Relisted — WUMLS
- 2025-06-30 Contingent — WUMLS
- 2025-06-30 Contingent — Greater Greenville MLS
- 2025-05-11 Relisted — Greater Greenville MLS
- 2025-05-11 Relisted — WUMLS
- 2025-04-14 Contingent — Greater Greenville MLS
- 2025-04-14 Contingent — WUMLS
- 2025-04-02 Price Changed $130,000 Greater Greenville MLS
- 2025-04-02 Relisted — WUMLS
- 2025-04-02 Price Changed $130,000 WUMLS
- 2025-04-02 Relisted — Greater Greenville MLS
- 2025-03-19 Pending — WUMLS
- 2025-03-19 Pending — Greater Greenville MLS
- 2025-03-19 Listed $148,900 WUMLS
- 2025-01-14 Listed $148,900 Greater Greenville MLS
- 2025-01-14 Listed $148,900 WUMLS
- 2025-01-06 Listing Removed — WUMLS
- 2024-10-14 Price Changed $155,000 WUMLS
- 2024-08-09 Price Changed $165,999 WUMLS
- 2024-06-10 Price Changed $169,999 WUMLS
- 2024-05-08 Price Changed $180,000 WUMLS
- 2024-04-05 Price Changed $189,999 WUMLS
- 2024-03-13 Price Changed $190,999 WUMLS
- 2024-02-21 Listed $199,000 WUMLS
Property tax history
-2.5%/yrLatest (2025): $487 · +0.0% YoY. Source: county tax records.
Cash-flow waterfall
monthlySold comps — $/sqft
last 12 mo · ≤1 miLoading sold comps…