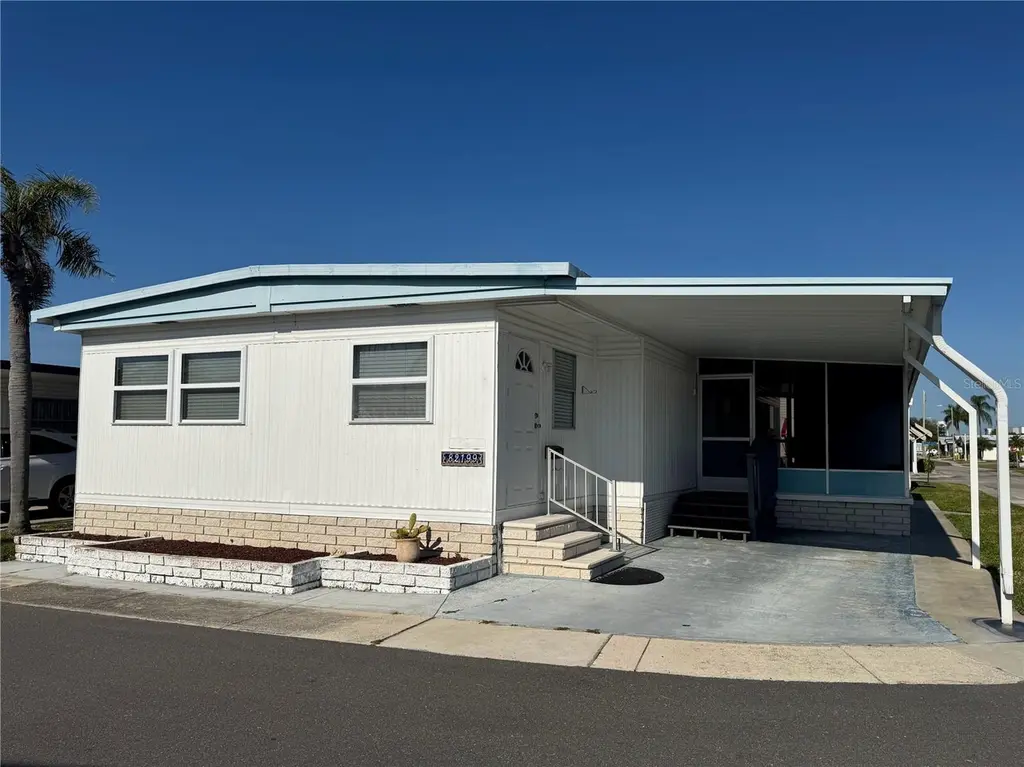
82199 F St N #199 · Pinellas Park, FL
Flood risk 6/10 · Moderate
- FEMA flood zone
- X (unshaded)
- Chance of flooding over 30 yrs
- 0.54%
- Est. flood insurance / yr
- $507 – $1,088
Fire risk 1/10 · Minimal
- Est. fire insurance / yr
- $947 – $1,759
Heat risk 10/10 · Severe
- Hot days now (above 107°F)
- 7 days/yr
- Hot days in 30 yrs
- 26 days/yr
Wind risk 10/10 · Severe
- Chance of severe wind over 30 yrs
- 99.0%
Air-quality risk 4/10 · Minor
- Unhealthy air days now
- 4 days/yr
- Unhealthy air days in 30 yrs
- 4 days/yr
Risk factors via First Street. Map © Google.
Why this score? — see what drove the B- grade
The composite is a weighted blend of 9 inputs, each scored 0–100. Each bar is that input's sub-score; the figure is the points it added to the 100-point composite (weight × sub-score).
- Cash flow +30.0/30.0
- 1% rule +10.0/10.0
- DSCR +10.0/10.0
- ARV discount +5.7/15.0
- Schools +4.3/10.0
- Livability +3.9/5.0
- Condition / age +2.5/5.0
- Rent growth +1.8/5.0
- Appreciation +0.0/10.0
$109,900
🖨 Deal sheet (PDF) 📄 Offer letter ✓ Due diligence
Listing remarks
Under contract-accepting backup offers. * BACK ON MARKET Due to buyer home sale contingency! * Beautifully maintained and fully furnished, this 2 bedroom 2 full bathroom home in the highly desired 55+ Resident Owned Golden Gate Community is your new home in paradise! Bright and sunny with over 1,300 sq ft of living space, you're welcomed into the front Florida sun room where you'll find a quiet spot to enjoy your morning coffee. The living room has plenty of seating with a couch and 2 recliners to enjoy watching TV after a long day at the beach. The dining room is thoughtfully decorated with a modern beachy theme while the kitchen boasts plenty of storage and counter space with a pass
Key facts
- Parking
- Community pool
- Built 1980
Property features AI
Finance
- Other: Furnished; Directions available
- Financial info: Total monthly fees $220 (total annual fees $2,640)
- HOA & community: Monthly association fee $220; Association amenities include pool; Association fee covers cable TV, common area taxes, pool, escrow reserves, internet, grounds maintenance, management, private road, recreational facilities, sewer, trash, and water; Association: Westcoast Management/Terry Cross; Buyer approval required; Clubhouse; Deed restrictions; Golf carts OK; Sidewalks; Senior community; Cats and dogs allowed
Exterior
- Parking: Carport (1 space)
- Utilities: Public water; Public sewer; Electricity connected; Cable connected; Internet available; Sewer connected; Water connected
- Home design: Manufactured home (double wide); One story; East-facing entry
- Construction: Vinyl siding; Metal roof; Crawlspace foundation; Built as a double wide manufactured home
- Exterior features: Covered, enclosed and screened patio/porch (side porch); Awning(s); Hurricane shutters; Exterior lighting; Private mailbox; Sidewalk; Storage (shed)
Interior
- Kitchen: Dishwasher; Microwave; Range; Range hood; Refrigerator
- Bedrooms: 2 bedrooms
- Flooring: Carpet; Laminate
- Bathrooms: 2 full bathrooms
- Heating & cooling: Central heating; Central air
- Interior features: Ceiling fans; Thermostat; Walk-in closet(s); Window treatments; Blinds
- Laundry & utility: Washer; Dryer; Other laundry features
Neighborhood map
What this means for you Summary
Snapshot
- This is a 2-bed/2.0-bath manufactured listed at $110k.
Deal economics
- At list price, monthly cash flow is $684 ($8k/yr) — positive.
- The deal already cash-flows at list — no discount required.
- Meets the 1% rule at list price ($2k rent vs $110k).
- Cap rate 13.8% vs local median 4.0% in Pinellas Park — top-decile yield for the area; either an underpriced asset or a hidden risk that comps aren't pricing in. Stress-test before assuming the spread holds.
Location & tenants
- Location reads 78/100 on livability (#170 in FL, #2,546 nationally) — a middle-class / working-renter tenant base. Strengths: commute A+, cost of living A+, housing A+; Watch: employment D+, schools D-, amenities F.
- Pinellas (suburban): math 51% / reading 51% proficiency, ranked #31 of 73 in FL (top 42%) — acceptable for families but not a draw, mixed tenant base, ~2y average lease.
- Market conditions: Rents soft (-3.0%/yr); 230 active listings in the ZIP; 16 comparable units currently listed for rent nearby; rentals at typical pace (median 16d on market — plan ~3-4 weeks tenant-placement turnaround); 2,676 units permitted in Pinellas County in 2024 (1,422 in 5+ unit buildings).
- This rent runs 45% of the median local income ($58k/yr) — at the standard rent-burdened threshold; future hikes will face affordability resistance.
Forward outlook
- Local home prices are declining (-3.0%/yr); year-one equity from $760 of loan paydown is wiped out by about $3k of value loss. Plan a longer hold.
- Pinellas County population projected at +14% by 2050 — modest demand growth; plan on rents tracking national, not racing it.
- At projected returns (-3.0% appreciation + 0.0% rent growth), your $31k cash investment doubles in ~6 years — after that, you're playing with house money.
Negotiation context
- Only 12 days on market — expect competitive offers; lowballing is unlikely to land.
- 2 sale attempts with the ask held roughly flat each time — persistent listings suggest the price (not the market) is what's stuck; bring a comps-based counter.
- Current owner paid $42k; list at $110k implies a 165% gain — meaningful room to come down on a strong offer.
Risks & watch-outs
- Climate carrying-cost: major flood risk; severe wind risk, 99% chance of damaging wind over 30y; extreme-heat days projected 7→26/yr by 2055 (HVAC capex compounding) — expect insurance premiums to compound above CPI over the hold.
Questions for the listing agent
- What does the HOA fee cover, when was the last increase, and are there any pending special assessments or reserve-fund shortfalls?
- Is there a deadline driving the sale (1031 exchange, divorce, estate, relocation)? That informs how much negotiation room exists.
- Schools are D-rated, which usually means shorter tenancies and higher turnover. Who's the typical renter profile here, and what's been the actual vacancy rate?
- What's the average days-on-market for RENTAL listings here right now (not sales)? A rising rental-DOM trend means longer vacancies and softer asking-rent achievability than the comps imply.
- What's the recent tenant-quality profile in this submarket — average credit score on applications, eviction rate, late-payment / NSF rate, and stable-employment percentage? A property-management company in the area should have these aggregated.
- How much new for-sale + rental construction is in the pipeline within 1–3 miles? Heavy new supply typically softens prices + rents 12–24 months out; constrained supply supports both.
Investment metrics
- 1% rule
- 1.95% ✓
- Cap rate
- 13.76%
- Cash-on-cash
- 26.67%
- DSCR
- 2.19
- GRM
- 4.3
CMA / ARV
- ARV (on-the-fly)
- $105,644
- Comps found
- 3
Show comp detail 3 sales within ~0.75 mi
| Address | Dist | Beds/Ba | Sqft | Sold | Price | $/sf | Match |
|---|---|---|---|---|---|---|---|
| 82199 F St N #199 | 0.00mi | 2/2.0 | 1,372 (0%) | 0mo | $105,000 | $77 | 100 |
| 82277 2nd Ave N #277 | 0.18mi | 2/2.0 | 1,344 (-2%) | 4mo | $140,000 | $104 | 85 |
| 82418 New Circle Dr N | 0.10mi | 2/2.0 | 1,334 (-3%) | 9mo | $100,000 | $75 | 84 |
Match score weights: distance 35% · size 25% · config 20% · recency 20%. Top-matched comps best support the ARV.
Projected returns pro-forma
-3.0% appreciation · 0.0% rent growth · sell at horizon
- IRR
- 16.6%
- Equity multiple
- 1.64×
- Total profit
- $19,637
- Equity at exit
- $16,386
- IRR
- 22.4%
- Equity multiple
- 2.61×
- Total profit
- $49,616
- Equity at exit
- $9,502
Cash invested: $30,772 (down + closing). Projections, not guarantees.
Landlord ↔ Tenant lean methodology
- Overall (STATE)
- 87 Strongly Landlord-Friendly
- State Florida
- 87 Strongly Landlord-Friendly · R+3
- County
- — inherits STATE
- City
- — inherits STATE
ZIP-level market 33781
- Rents YoY
- -3.0%
- Active inventory
- 230
- Price-to-rent
- 4.3×
Monthly cashflow live
- Estimated rent
- $2,148 high interval (Pro) →
- Mortgage (P&I)
- −$576
- Tax from tax record
- −$171 /mo · $2,055/yr
- Insurance
- −$46
- HOA
- −$220
- Vacancy / Maint / Mgmt
- −$451
- Net cashflow
- $684
Break-even live
Sensitivity live
| Price | -10% $746 | -5% $715 | +0% $684 | +5% $653 | +10% $622 |
|---|---|---|---|---|---|
| Rent | -10% $514 | -5% $599 | +0% $684 | +5% $769 | +10% $854 |
| Rate | -1.0pp $739 | -0.5pp $712 | base $684 | +0.5pp $655 | +1.0pp $626 |
UW: 25.0% down · 7.5% · 30yr · 1.5% tax · 5.0% vac · 8.0% maint · 8.0% mgmt
Financing live
Cash to close
- Down payment
- $27,475
- Closing costs
- $3,297
- Reserves months
- —
- Total cash needed
- —
Loan-product check · same deal, 3 products live
Conventional
25% down · 7.5% · 30yr
- Down + closing
- —
- Monthly P&I
- —
- Monthly cashflow
- —
- DSCR
- —
- Eligible?
- —
Personal DTI + credit; lowest rate.
DSCR
20% down · 8.5% · 30yr
- Down + closing
- —
- Monthly P&I
- —
- Monthly cashflow
- —
- DSCR
- —
- Eligible?
- —
No personal income docs; deal must DSCR.
Hard money
10% down · 12.0% · 12mo
- Down + closing
- —
- Monthly P&I
- —
- Monthly cashflow
- —
- DSCR
- —
- Eligible?
- —
Short-term bridge; refi at stabilization.
Rent comps 16 comps
| Address | Beds | Baths | Sqft | Rent | $/sqft | DOM | Units | Dist |
|---|---|---|---|---|---|---|---|---|
| 8851 US Highway 19 N Pinellas Park, FL | 1.0–3.0 | 1.0–2.0 | 993 | $2,295 | $2.31 | 3d | 23 | 0.42mi |
| 3110 Grand Ave Pinellas Park, FL | 1.0–3.0 | 1.0–2.0 | 1104 | $2,467 | $2.23 | 3d | 34 | 0.60mi |
| 4701 88th Ave N Pinellas Park, FL | 1.0–2.0 | 1.0–2.0 | 855 | $1,853 | $2.17 | 11d | 20 | 0.77mi |
| 4420 96th Ave N Pinellas Park, FL | 2.0 | 2.0 | 1586 | $1,850 | $1.17 | 5d | 1 | 0.85mi |
| 2790 Grand Ave Saint Petersburg, FL | 1.0–3.0 | 1.0–2.0 | 1017 | $2,782 | $2.73 | 3d | 16 | 0.90mi |
| 4057 71st Ter N Pinellas Park, FL | 3.0 | 2.5 | 1420 | $2,650 | $1.87 | 5d | 1 | 0.91mi |
| 4771 78th Ave N Pinellas Park, FL | 2.0 | 2.0 | 903 | $1,640 | $1.82 | 25d | 1 | 0.93mi |
| 9505 49th St N Pinellas Park, FL | 1.0–3.0 | 1.0–2.0 | 1049 | $2,297 | $2.19 | 3d | 19 | 1.08mi |
| 4973 91st Ave Unit 12 (C) Pinellas Park, FL | 2.0 | 2.0 | 875 | $1,475 | $1.69 | 15d | 1 | 1.10mi |
| 4973 91st Ave Unit C Pinellas Park, FL | 2.0 | 2.0 | 875 | $1,475 | $1.69 | 15d | 1 | 1.10mi |
| 4631 69th Pl N Pinellas Park, FL | 3.0 | 2.5 | 1420 | $2,595 | $1.83 | 25d | 1 | 1.24mi |
| 7800 52nd St N Pinellas Park, FL | 3.0 | 1.0 | 1163 | $1,850 | $1.59 | 25d | 1 | 1.27mi |
| 7050 48th St N Pinellas Park, FL | 3.0 | 1.5 | 1008 | $2,350 | $2.33 | 25d | 1 | 1.28mi |
| 6898 47th Ln N Pinellas Park, FL | 3.0 | 2.5 | 1500 | $2,525 | $1.68 | 25d | 1 | 1.34mi |
| 4627 67th Ave N Pinellas Park, FL | 3.0 | 2.5 | 1610 | $2,500 | $1.55 | 25d | 1 | 1.36mi |
| 4732 68th Ave N Pinellas Park, FL | 2.0 | 3.0 | 1210 | $2,000 | $1.65 | 25d | 1 | 1.39mi |
HOA detail
- Monthly dues
- $220 · $2,640/yr
Listing history 6 events
-
2026-05-14status Pending
-
2026-05-11status Active
-
2026-05-01status Pending
-
2026-04-21$109,900 Active
-
1995-10-01soldstatus $41,500
-
1993-11-23soldstatus $38,500
ⓘ Source: listings_history table (triggers on properties + properties_extension) + one-shot
backfill from property_details.listing_events for pre-trigger history.
Tax reassessment forecast FL · Resets to sale price
- Current annual tax
- $2,055 · $171/mo
- Projected year-2 tax
- $2,055 · $171/mo
- Expected delta
- $0/yr ($0/mo · 0.0%)
ⓘ Screening estimate from a state-policy table — verify with the county assessor before closing.
Climate risk First Street
- Flood 6/10 Major FEMA zone X (unshaded) · 54% chance over 30 yrs
- Wildfire 1/10 Low
- Heat 10/10 Extreme 7 d/yr ≥107°F today · 26 d/yr by 30 yrs out
- Wind 10/10 Extreme 99% chance of damaging wind over 30 yrs
- Air quality 4/10 Moderate 4 unhealthy d/yr today · 4 by 30 yrs out
Nearby sold comps map
Loading sold comps map…
Walkable amenities ~0.75 mi
Loading nearby amenities…
Taxation est. · year 1
- Rental income
- $25,780
- − Mortgage interest
- −$6,156
- − Property taxes
- −$2,055
- − Insurance
- −$550
- − Repairs & maintenance
- −$2,062
- − Management
- −$2,062
- − HOA
- −$2,640
- − Depreciation
- −$3,197
- Taxable income
- $7,058
- Est. tax owed @ 24.0%
- −$1,694
- After-tax cash flow
- $6,512/yr
For passive investors: Depreciation is non-cash, so a rental often shows a tax loss while cash-flowing — sheltering income. Rental losses are passive: they offset passive income freely, and up to $25,000/yr can offset ordinary (W-2) income if you actively participate and your MAGI is under $100k (phasing out to $0 by $150k); unused losses carry forward. On sale, claimed depreciation is recaptured at up to 25%, and gains may owe capital-gains tax (a 1031 exchange can defer both). Figures are a year-1 estimate at your 24.0% rate — not tax advice; consult a CPA.
Schools (NCES district)
- District
- Pinellas
- NCES district ID
- 1201560
- Math proficiency
- 51% ▼ -5.00%
- Reading proficiency
- 51% ▼ -3.00%
- Median HH income
- $46,270
- Composite
- 43.27/100
- National rank
- #3046
- State rank
- #31 of 73 in FL
Livability — Pinellas Park
- Score
- 78/100
- State rank
- #170
- US rank
- #2546
Category grades
Schools grade is shown separately in the Schools card above.
Census & demographics
- Census place
- Pinellas Park, FL
- County
- Pinellas County · 939,478 people
- City population
- 50,533
- Metro
- Tampa-St. Petersburg-Clearwater, FL
- Population (ZIP)
- 28,072
- Household income
- $57,785
- Rent vs Own
- Severe rent burden
- 1115.0
Population outlook (Pinellas County) Hauer SSP2
- Today (2025)
- 1,027,532 people
- By 2030
- 1,063,586 · +3.5%
- By 2040
- 1,125,020 · +9.5%
- By 2050
- 1,168,637 · +13.7%
- By 2075
- 1,265,188 · +23.1%
- By 2100
- 1,260,357 · +22.7%
Race, ethnicity, and origin ACS 2023
- Neighborhood character
- Diverse neighborhood (Simpson 0.60)
- Race & ethnicity
- White 59% Hispanic / Latino 16% Asian 14% Two or more races 11% Black 7%
- Hispanic origin (detail)
- Mexican 2% Puerto Rican 6% Cuban 5%
- Common ancestry
- Romanian 3% Lithuanian 3% Slovak 2%
- Foreign-born
- 18% · Canada, Vietnam, Jamaica
- Languages at home
- 72% English-only · Spanish 12% Vietnamese 7% Other Asian/Pacific 3%
Political lean MEDSL · Pinellas
- 2024 margin
- Lean R (+5.2) · D 46.9% · R 52.1%
- 2008→2024 swing
- -13.5pp toward R · 2008: 8.3pp · 2024: -5.2pp
- All cycles
- 2024: R+5.2 2020: D+0.2 2016: R+1.1 2012: D+5.6 2008: D+8.3
Not yet ingested
- Civics
- —
Market trends
- HPI YoY
- ▼ -409.77%
- Current HPI
- 348.546
- Rent YoY
- ▼ -2.95%
- Metro
- Tampa-St. Petersburg-Clearwater, FL
- State GDP YoY
- ▲ 3.28%
- F500 in state
- 36
Industry mix (Fortune 500 HQ in FL)
| Industry | F500 HQs | Revenue |
|---|---|---|
| Industrial Technology | 2 | $29B |
|
||
| Insurance | 2 | $17B |
|
||
| Retail | 1 | $60B |
|
||
| Technology Distribution | 1 | $58B |
|
||
| Homebuilding | 1 | $35B |
|
||
| Technology Manufacturing | 1 | $35B |
|
||
Price history
+185.5% since first listed6 events — show timeline
- 2026-05-14 Pending — Stellar MLS as Distributed by MLS Grid
- 2026-05-11 Relisted — Stellar MLS as Distributed by MLS Grid
- 2026-05-01 Pending — Stellar MLS as Distributed by MLS Grid
- 2026-04-21 Listed $109,900 Stellar MLS as Distributed by MLS Grid
- 1995-10-01 Sold (Public Records) $41,500 Public Records
- 1993-11-23 Sold (Public Records) $38,500 Public Records
Property tax history
+4.5%/yrLatest (2025): $2,055 · +7.2% YoY. Source: county tax records.
Cash-flow waterfall
monthlySold comps — $/sqft
last 12 mo · ≤1 miLoading sold comps…