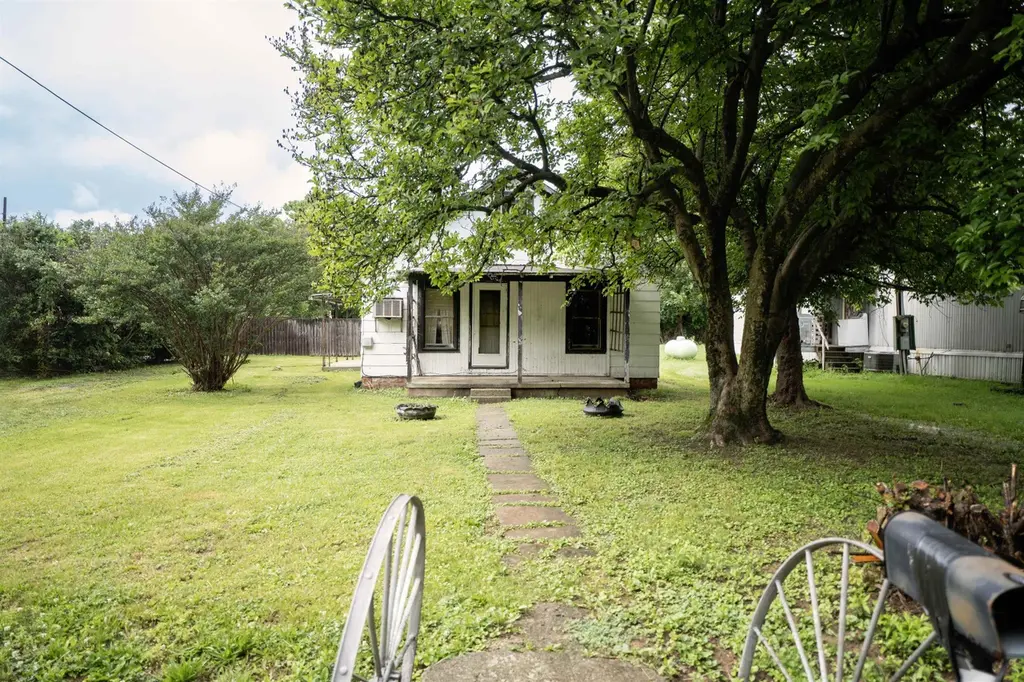
294 South Shore Drive Dr · South Shore, KY
Flood risk 7/10 · Major
- FEMA flood zone
- AE
- Chance of flooding over 30 yrs
- 0.96%
- Est. flood insurance / yr
- $1,737 – $8,500
Fire risk 3/10 · Minor
- Est. fire insurance / yr
- $839 – $1,559
Heat risk 4/10 · Minor
- Hot days now (above 102°F)
- 7 days/yr
- Hot days in 30 yrs
- 19 days/yr
Wind risk 2/10 · Minimal
- Chance of severe wind over 30 yrs
- 1.0%
Air-quality risk 2/10 · Minimal
- Unhealthy air days now
- 0 days/yr
- Unhealthy air days in 30 yrs
- 1 days/yr
Risk factors via First Street. Map © Google.
Why this score? — see what drove the A- grade
The composite is a weighted blend of 9 inputs, each scored 0–100. Each bar is that input's sub-score; the figure is the points it added to the 100-point composite (weight × sub-score).
- Cash flow +30.0/30.0
- ARV discount +15.0/15.0
- 1% rule +10.0/10.0
- DSCR +10.0/10.0
- Appreciation +5.9/10.0
- Livability +3.8/5.0
- Rent growth +2.5/5.0
- Condition / age +2.5/5.0
- Schools +2.4/10.0
$34,900
🖨 Deal sheet (PDF) 📄 Offer letter ✓ Due diligence
Listing remarks
This property is ready for someone with vision and creativity to bring it back to life! While in need of significant TLC and updates, the home offers endless potential. Investment property, fixer-upper, or future dream home, this one is full of opportunity. Conveniently located and priced to reflect improvements, this is your chance to turn potential into reality.
Key facts
- Listed 23 days
Property features AI
Exterior
- Parking: No designated parking
- Utilities: Public water; Public sewer
- Home design: Single-family residence; Residential property
- Construction: Wood siding construction; Metal roof; Block foundation; Built area above grade: 705
- Exterior features: Level lot
Interior
- Bedrooms: Master downstairs
- Bathrooms: 1 full bathroom
- Heating & cooling: Central air; Window air conditioning units
- Interior features: Master suite on the main floor; 4 total rooms
Neighborhood map
What this means for you Summary
Snapshot
- This is a 2-bed/1.0-bath single-family listed at $35k.
Deal economics
- At list price, monthly cash flow is $-1 ($-8/yr) — negative.
- To cash-flow at today's rent, offer at most $35k (0.4% below list).
- Meets the 1% rule at list price ($823 rent vs $35k).
- Recommended offer: $34k (1.5% below list) — sets the bar for market timing.
Location & tenants
- Location reads 76/100 on livability (#89 in KY, #3,524 nationally) — a middle-class / working-renter tenant base. Strengths: crime A+, cost of living A+, health & safety A+; Watch: commute D+, amenities F, employment F.
- Greenup County (suburban): math 23% / reading 35% proficiency, ranked #118 of 165 in KY (top 72%) — low school quality limits family demand, transient renter base, plan for 1-2y turnover.
- Zoned schools: Mckell Elementary School (math 22% / reading 29%, grade F, #477 of 676 statewide, top 71%, 469 students, 70% FRL); Mckell Middle School (math 21% / reading 38%, grade F, #151 of 217 statewide, top 71%, 361 students, 57% FRL); Greenup County High School (math 30% / reading 30%, grade F, #122 of 254 statewide, top 49%, 849 students, 62% FRL).
- Market conditions: 15 active listings in the ZIP; 20 units permitted in Greenup County in 2024 (0 in 5+ unit buildings).
Forward outlook
- In year one you build about $850 of equity ($241 loan paydown + $609 appreciation (1.7% local appreciation)).
- Greenup County population projected at -19% by 2050 — secular population decline; favor cash flow + early exit over multi-decade hold.
- At projected returns (1.7% appreciation + 3.0% rent growth), your $10k cash investment doubles in ~8 years — after that, you're playing with house money.
Negotiation context
- It's been on market 23 days — a 2% lower offer ($34k) is reasonable based on typical stale-listing flexibility.
Risks & watch-outs
- Watch-outs: flood insurance adds $427/mo.
- Climate carrying-cost: in FEMA flood zone AE (mandatory federal flood insurance) — expect insurance premiums to compound above CPI over the hold.
Questions for the listing agent
- What do current leases actually rent for vs. the listed asking? Can we see a recent rent roll and the last 12 months of T-12 income?
- What's the actual annual flood-insurance premium (NFIP or private), and is the property in a SFHA with mandatory coverage?
- Is there a deadline driving the sale (1031 exchange, divorce, estate, relocation)? That informs how much negotiation room exists.
- Schools are D-rated, which usually means shorter tenancies and higher turnover. Who's the typical renter profile here, and what's been the actual vacancy rate?
- What's the average days-on-market for RENTAL listings here right now (not sales)? A rising rental-DOM trend means longer vacancies and softer asking-rent achievability than the comps imply.
- What's the recent tenant-quality profile in this submarket — average credit score on applications, eviction rate, late-payment / NSF rate, and stable-employment percentage? A property-management company in the area should have these aggregated.
- How much new for-sale + rental construction is in the pipeline within 1–3 miles? Heavy new supply typically softens prices + rents 12–24 months out; constrained supply supports both.
Investment metrics
- 1% rule
- 2.36% ✓
- Cap rate
- 20.93%
- Cash-on-cash
- 52.29%
- DSCR
- 3.33
- GRM
- 3.5
CMA / ARV
- ARV (on-the-fly)
- $62,040
- Comps found
- 1
Show comp detail 1 sale within ~0.75 mi
| Address | Dist | Beds/Ba | Sqft | Sold | Price | $/sf | Match |
|---|---|---|---|---|---|---|---|
| 159 E Third Avenue (tan) Ave | 0.30mi | 1/1.0 (-1) | 624 (-12%) | 9mo | $55,000 | $88 | 54 |
Match score weights: distance 35% · size 25% · config 20% · recency 20%. Top-matched comps best support the ARV.
Projected returns pro-forma
1.74% appreciation · 3.0% rent growth · sell at horizon
- IRR
- 4.1%
- Equity multiple
- 1.22×
- Total profit
- $2,162
- Equity at exit
- $13,287
- IRR
- 8.5%
- Equity multiple
- 2.14×
- Total profit
- $11,092
- Equity at exit
- $18,772
Cash invested: $9,772 (down + closing). Projections, not guarantees.
Landlord ↔ Tenant lean methodology
- Overall (STATE)
- 83 Strongly Landlord-Friendly
- State Kentucky
- 83 Strongly Landlord-Friendly · R+16
- County
- — inherits STATE
- City
- — inherits STATE
ZIP-level market 41175
- Home prices YoY
- 0.8%
- Active inventory
- 15
- Price-to-rent
- 3.5×
Monthly cashflow live
- Estimated rent
- $823 medium interval (Pro) →
- Mortgage (P&I)
- −$183
- Tax from tax record
- −$27 /mo · $326/yr
- Insurance
- −$15
- Flood insurance flood zone
- −$427 /mo · $5,118/yr
- HOA
- −$0
- Vacancy / Maint / Mgmt
- −$173
- Net cashflow
- $-1
Break-even live
Sensitivity live
| Price | -10% $19 | -5% $9 | +0% $-1 | +5% $-11 | +10% $-20 |
|---|---|---|---|---|---|
| Rent | -10% $-66 | -5% $-33 | +0% $-1 | +5% $32 | +10% $64 |
| Rate | -1.0pp $17 | -0.5pp $8 | base $-1 | +0.5pp $-10 | +1.0pp $-19 |
UW: 25.0% down · 7.5% · 30yr · 1.5% tax · 5.0% vac · 8.0% maint · 8.0% mgmt
Financing live
Cash to close
- Down payment
- $8,725
- Closing costs
- $1,047
- Reserves months
- —
- Total cash needed
- —
Loan-product check · same deal, 3 products live
Conventional
25% down · 7.5% · 30yr
- Down + closing
- —
- Monthly P&I
- —
- Monthly cashflow
- —
- DSCR
- —
- Eligible?
- —
Personal DTI + credit; lowest rate.
DSCR
20% down · 8.5% · 30yr
- Down + closing
- —
- Monthly P&I
- —
- Monthly cashflow
- —
- DSCR
- —
- Eligible?
- —
No personal income docs; deal must DSCR.
Hard money
10% down · 12.0% · 12mo
- Down + closing
- —
- Monthly P&I
- —
- Monthly cashflow
- —
- DSCR
- —
- Eligible?
- —
Short-term bridge; refi at stabilization.
Listing history 17 events
-
2026-06-21days on market $34,900 Active 23 DOM
-
2026-06-21days on market $34,900 Active 22 DOM
-
2026-06-18days on market $34,900 Active 20 DOM
-
2026-06-17days on market $34,900 Active 19 DOM
-
2026-06-16days on market $34,900 Active 18 DOM
-
2026-06-15days on market $34,900 Active 17 DOM
-
2026-06-13days on market $34,900 Active 15 DOM
-
2026-06-12days on market $34,900 Active 14 DOM
-
2026-06-09days on market $34,900 Active 11 DOM
-
2026-06-08days on market $34,900 Active 10 DOM
-
2026-06-07days on market $34,900 Active 9 DOM
-
2026-06-07days on market $34,900 Active 8 DOM
-
2026-06-04days on market $34,900 Active 5 DOM
-
2026-06-02days on market $34,900 Active 4 DOM
-
2026-06-01days on market $34,900 Active 3 DOM
-
2026-05-31days on market $34,900 Active 2 DOM
-
2026-05-28$34,900 Active
ⓘ Source: listings_history table (triggers on properties + properties_extension) + one-shot
backfill from property_details.listing_events for pre-trigger history.
Tax reassessment forecast KY · Resets to sale price
- Current annual tax
- $326 · $27/mo
- Projected year-2 tax
- $326 · $27/mo
- Expected delta
- $0/yr ($0/mo · 0.0%)
ⓘ Screening estimate from a state-policy table — verify with the county assessor before closing.
Climate risk First Street
- Flood 7/10 Severe FEMA zone AE · 96% chance over 30 yrs
- Wildfire 3/10 Moderate
- Heat 4/10 Moderate 7 d/yr ≥102°F today · 19 d/yr by 30 yrs out
- Wind 2/10 Low 100% chance of damaging wind over 30 yrs
- Air quality 2/10 Low 0 unhealthy d/yr today · 1 by 30 yrs out
Nearby sold comps map
Loading sold comps map…
Walkable amenities ~0.75 mi
Loading nearby amenities…
Taxation est. · year 1
- Rental income
- $9,882
- − Mortgage interest
- −$1,955
- − Property taxes
- −$326
- − Insurance
- −$5,293
- − Repairs & maintenance
- −$791
- − Management
- −$791
- − Depreciation
- −$1,015
- Taxable loss
- −$288
- Est. tax savings @ 24.0%
- +$69
- After-tax cash flow
- $61/yr
For passive investors: Depreciation is non-cash, so a rental often shows a tax loss while cash-flowing — sheltering income. Rental losses are passive: they offset passive income freely, and up to $25,000/yr can offset ordinary (W-2) income if you actively participate and your MAGI is under $100k (phasing out to $0 by $150k); unused losses carry forward. On sale, claimed depreciation is recaptured at up to 25%, and gains may owe capital-gains tax (a 1031 exchange can defer both). Figures are a year-1 estimate at your 24.0% rate — not tax advice; consult a CPA.
Schools (NCES district)
- District
- Greenup County
- NCES district ID
- 2102400
- Math proficiency
- 23% ▼ -19.00%
- Reading proficiency
- 35% ▼ -18.00%
- Median HH income
- $39,526
- Composite
- 24.33/100
- National rank
- #7702
- State rank
- #118 of 165 in KY
Livability — South Shore
- Score
- 76/100
- State rank
- #89
- US rank
- #3524
Category grades
Schools grade is shown separately in the Schools card above.
Census & demographics
- Census place
- South Shore, KY
- County
- Greenup · 24,497 people
- Metro
- Huntington-Ashland, WV-KY-OH
- Population (ZIP)
- 5,612
- Household income
- $48,681
- Rent vs Own
- Severe rent burden
- 10.4
Population outlook (Greenup County) Hauer SSP2
- Today (2025)
- 34,374 people
- By 2030
- 33,145 · -3.6%
- By 2040
- 30,407 · -11.5%
- By 2050
- 27,702 · -19.4%
- By 2075
- 21,970 · -36.1%
- By 2100
- 16,670 · -51.5%
Race, ethnicity, and origin ACS 2023
- Neighborhood character
- Predominantly White (97%)
- Race & ethnicity
- White 97% Two or more races 3% Hispanic / Latino 1%
- Common ancestry
- Slovak 5% Greek 1% Lithuanian 1%
- Foreign-born
- 1% · Canada
- Languages at home
- 99% English-only · Spanish 1%
Political lean MEDSL · Greenup
- 2024 margin
- Solid R (+50.5) · D 24.1% · R 74.6% · Other 1.3%
- 2008→2024 swing
- -36.4pp toward R · 2008: -14.1pp · 2024: -50.5pp
- All cycles
- 2024: R+50.5 2020: R+45.1 2016: R+45.5 2012: R+18.6 2008: R+14.1
Not yet ingested
- Civics
- —
Market trends
- HPI YoY
- ▲ 1.74%
- Current HPI
- 208.0953
- Rent YoY
- —
- Metro
- —
- State GDP YoY
- ▲ 1.81%
- F500 in state
- 4
Industry mix (Fortune 500 HQ in KY)
| Industry | F500 HQs | Revenue |
|---|---|---|
| Healthcare | 1 | $118B |
|
||
| Food / Beverage | 1 | $7B |
|
||
Price history
1 event — show timeline
- 2026-05-28 Listed $34,900 AABOR
Property tax history
+1.2%/yrLatest (2025): $326 · +6.0% YoY. Source: county tax records.
Cash-flow waterfall
monthlySold comps — $/sqft
last 12 mo · ≤1 miLoading sold comps…