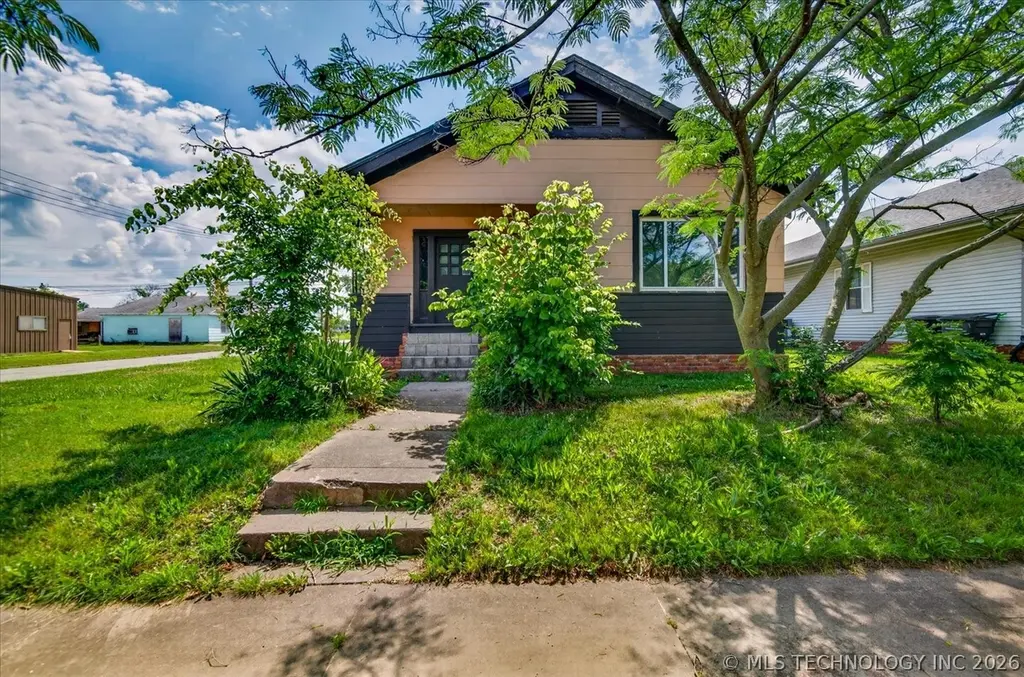
300 S Creek Ave · Bartlesville, OK
Flood risk 1/10 · Minimal
- FEMA flood zone
- X (unshaded)
- Chance of flooding over 30 yrs
- 0.0%
- Est. flood insurance / yr
- $507 – $1,088
Fire risk 6/10 · Moderate
- Est. fire insurance / yr
- $2,463 – $4,575
Heat risk 6/10 · Moderate
- Hot days now (above 113°F)
- 7 days/yr
- Hot days in 30 yrs
- 18 days/yr
Wind risk 2/10 · Minimal
- Chance of severe wind over 30 yrs
- 2.0%
Air-quality risk 2/10 · Minimal
- Unhealthy air days now
- 1 days/yr
- Unhealthy air days in 30 yrs
- 3 days/yr
Risk factors via First Street. Map © Google.
Why this score? — see what drove the C+ grade
The composite is a weighted blend of 9 inputs, each scored 0–100. Each bar is that input's sub-score; the figure is the points it added to the 100-point composite (weight × sub-score).
- Cash flow +19.7/30.0
- Appreciation +10.0/10.0
- ARV discount +9.8/15.0
- DSCR +6.2/10.0
- 1% rule +4.1/10.0
- Livability +3.2/5.0
- Schools +2.6/10.0
- Rent growth +2.5/5.0
- Condition / age +2.5/5.0
$140,000
🖨 Deal sheet (PDF) 📄 Offer letter ✓ Due diligence
Listing remarks
Well maintained 4 bedroom, 2 bath home situated on a corner lot! This home offers several updates for peace of mind, new windows installed April 2026, roof replaced in 2020. Hot water tank, stove, dishwasher, and HVAC system replaced in 2023. Spacious layout with great natural light and functional living spaces. Move-in ready and waiting for its next owner!
Key facts
- 5,650 sq ft lot
- Garage
- Built 1930
Property features AI
Exterior
- Parking: Attached garage (1 car)
- Security: No safety shelter
- Utilities: Electricity available; Natural gas available; Public water; Public sewer
- Home design: Faces west; Crawlspace foundation
- Construction: Wood frame construction; Asphalt/fiberglass roof; Built by builder (year built source: Builder)
- Exterior features: Covered porch; Privacy fencing; No additional exterior features listed
Interior
- Kitchen: Oven; Range; Dishwasher
- Flooring: Wood flooring
- Bathrooms: 2 full bathrooms
- Heating & cooling: Central heating (gas); Central air conditioning
- Interior features: Vinyl windows; Ceramic counters; No additional interior features listed
- Laundry & utility: Gas water heater
Neighborhood map
What this means for you Summary
Snapshot
- This is a 3-bed/1.0-bath single-family listed at $140k.
Deal economics
- At list price, monthly cash flow is $164 ($2k/yr) — positive.
- The deal already cash-flows at list — no discount required.
- To meet the 1% rule (rent ≥ 1% of price), the offer needs to be $127k (9.0% below list).
- Recommended offer: $127k (9.0% below list) — sets the bar for 1% rule.
- Cap rate 7.7% vs local median 4.7% in Bartlesville — top-decile yield for the area; either an underpriced asset or a hidden risk that comps aren't pricing in. Stress-test before assuming the spread holds.
Location & tenants
- Location reads 64/100 on livability (#175 in OK) — a middle-class / working-renter tenant base. Strengths: cost of living A+, housing A+; Watch: employment C-, schools D+, crime D+.
- Bartlesville (town): math 30% / reading 29% proficiency, ranked #59 of 270 in OK (top 22%) — low school quality limits family demand, transient renter base, plan for 1-2y turnover.
- Market conditions: 137 active listings in the ZIP; 1 comparable units currently listed for rent nearby; 46 units permitted in Washington County in 2024 (0 in 5+ unit buildings).
Forward outlook
- In year one you build about $15k of equity ($968 loan paydown + $14k appreciation (10.0% local appreciation)).
- Washington County population projected at +12% by 2050 — modest demand growth; plan on rents tracking national, not racing it.
- At projected returns (10.0% appreciation + 3.0% rent growth), your $39k cash investment doubles in ~3 years — after that, you're playing with house money.
- By year 3, paydown + projected appreciation supports a ~$38k cash-out refi (75% LTV) — recoverable capital for the next deal without selling this one.
Negotiation context
- Only 1 days on market — expect competitive offers; lowballing is unlikely to land.
- 6 sale attempts since 26y ago with the ask held roughly flat each time — persistent listings suggest the price (not the market) is what's stuck; bring a comps-based counter.
- Current owner paid $27k; list at $140k implies a 426% gain — meaningful room to come down on a strong offer.
Risks & watch-outs
- Watch-outs: built in 1930 — expect roof / HVAC / electrical / plumbing capex.
- Climate carrying-cost: major wildfire risk; extreme-heat days projected 7→18/yr by 2055 (HVAC capex compounding) — expect insurance premiums to compound above CPI over the hold.
Questions for the listing agent
- Built in 1930 — when were the roof, HVAC, electrical panel, plumbing, and water heater last replaced?
- Is there a deadline driving the sale (1031 exchange, divorce, estate, relocation)? That informs how much negotiation room exists.
- Schools are D-rated, which usually means shorter tenancies and higher turnover. Who's the typical renter profile here, and what's been the actual vacancy rate?
- Crime grade is D in this area — have there been break-ins, vandalism, or insurance claims at this property in the last 3 years? What carrier currently insures it and at what premium?
- What's the average days-on-market for RENTAL listings here right now (not sales)? A rising rental-DOM trend means longer vacancies and softer asking-rent achievability than the comps imply.
- What's the recent tenant-quality profile in this submarket — average credit score on applications, eviction rate, late-payment / NSF rate, and stable-employment percentage? A property-management company in the area should have these aggregated.
- How much new for-sale + rental construction is in the pipeline within 1–3 miles? Heavy new supply typically softens prices + rents 12–24 months out; constrained supply supports both.
Investment metrics
- 1% rule
- 0.91% ✗
- Cap rate
- 7.70%
- Cash-on-cash
- 5.02%
- DSCR
- 1.22
- GRM
- 9.2
CMA / ARV
- ARV (on-the-fly)
- $147,651
- Comps found
- 10
Show comp detail 10 sales within ~0.75 mi
| Address | Dist | Beds/Ba | Sqft | Sold | Price | $/sf | Match |
|---|---|---|---|---|---|---|---|
| 402 S Wyandotte Ave | 0.29mi | 3/2.5 | 1,663 (+0%) | 2mo | $260,000 | $156 | 78 |
| 120 S Chickasaw Ave | 0.14mi | 3/2.5 | 1,600 (-4%) | 10mo | $79,000 | $49 | 73 |
| 812 SE Delaware | 0.59mi | 3/2.0 | 1,636 (-1%) | 3mo | $99,900 | $61 | 63 |
| 107 S Creek Ave | 0.15mi | 3/1.5 | 1,452 (-12%) | 14mo | $129,500 | $89 | 58 |
| 405 S Seneca Ave | 0.25mi | 4/1.0 (+1) | 1,424 (-14%) | 6mo | $114,000 | $80 | 55 |
| 111 N Quapaw Ave | 0.21mi | 4/3.0 (+1) | 1,738 (+5%) | 18mo | $142,000 | $82 | 54 |
| 524 S Wyandotte Ave | 0.36mi | 3/2.0 | 1,428 (-14%) | 5mo | $150,500 | $105 | 52 |
| 410 S Wyandotte Ave | 0.30mi | 4/2.0 (+1) | 1,560 (-6%) | 23mo | $207,000 | $133 | 48 |
| 920 SE Delaware Ave | 0.68mi | 2/2.0 (-1) | 1,568 (-6%) | 11mo | $225,000 | $143 | 41 |
| 805 S Osage Ave | 0.72mi | 3/1.5 | 1,792 (+8%) | 18mo | $155,000 | $86 | 36 |
Match score weights: distance 35% · size 25% · config 20% · recency 20%. Top-matched comps best support the ARV.
Projected returns pro-forma
10.0% appreciation · 3.0% rent growth · sell at horizon
- IRR
- 27.9%
- Equity multiple
- 3.21×
- Total profit
- $86,633
- Equity at exit
- $126,123
- IRR
- 24.3%
- Equity multiple
- 7.30×
- Total profit
- $246,793
- Equity at exit
- $271,989
Cash invested: $39,200 (down + closing). Projections, not guarantees.
Landlord ↔ Tenant lean methodology
- Overall (STATE)
- 83 Strongly Landlord-Friendly
- State Oklahoma
- 83 Strongly Landlord-Friendly · R+20
- County
- — inherits STATE
- City
- — inherits STATE
ZIP-level market 74003
- Home prices YoY
- 5.0%
- Active inventory
- 137
- Price-to-rent
- 9.2×
Monthly cashflow live
- Estimated rent
- $1,274 medium interval (Pro) →
- Mortgage (P&I)
- −$734
- Tax from tax record
- −$50 /mo · $598/yr
- Insurance
- −$58
- HOA
- −$0
- Vacancy / Maint / Mgmt
- −$268
- Net cashflow
- $164
Break-even live
Sensitivity live
| Price | -10% $243 | -5% $204 | +0% $164 | +5% $124 | +10% $85 |
|---|---|---|---|---|---|
| Rent | -10% $63 | -5% $114 | +0% $164 | +5% $214 | +10% $265 |
| Rate | -1.0pp $234 | -0.5pp $200 | base $164 | +0.5pp $128 | +1.0pp $91 |
UW: 25.0% down · 7.5% · 30yr · 1.5% tax · 5.0% vac · 8.0% maint · 8.0% mgmt
Financing live
Cash to close
- Down payment
- $35,000
- Closing costs
- $4,200
- Reserves months
- —
- Total cash needed
- —
Loan-product check · same deal, 3 products live
Conventional
25% down · 7.5% · 30yr
- Down + closing
- —
- Monthly P&I
- —
- Monthly cashflow
- —
- DSCR
- —
- Eligible?
- —
Personal DTI + credit; lowest rate.
DSCR
20% down · 8.5% · 30yr
- Down + closing
- —
- Monthly P&I
- —
- Monthly cashflow
- —
- DSCR
- —
- Eligible?
- —
No personal income docs; deal must DSCR.
Hard money
10% down · 12.0% · 12mo
- Down + closing
- —
- Monthly P&I
- —
- Monthly cashflow
- —
- DSCR
- —
- Eligible?
- —
Short-term bridge; refi at stabilization.
Rent comps 1 comps
| Address | Beds | Baths | Sqft | Rent | $/sqft | DOM | Units | Dist |
|---|---|---|---|---|---|---|---|---|
| 821 S Johnstone Ave Bartlesville, OK | 1.0–2.0 | 1.0–2.0 | 888 | $1,521 | $1.71 | 25d | 1 | 0.85mi |
Listing history 17 events
-
2026-05-30status Pending
-
2026-05-28$140,000 Active
-
2023-08-14historical
-
2022-12-16historical
-
2022-06-21$125,900 Active
-
2022-02-19historical
-
2022-01-07price $1,600,000
-
2021-10-09$145,455 Active
-
2020-01-24historical
-
2020-01-08price $46,500
-
2020-01-07$53,500 Active
-
2008-12-12soldstatus $26,600
-
2008-11-04historical
-
2008-10-24$29,000
-
2003-11-07soldstatus $61,000
-
2001-04-10historical
-
2000-10-09$49,000
ⓘ Source: listings_history table (triggers on properties + properties_extension) + one-shot
backfill from property_details.listing_events for pre-trigger history.
Tax reassessment forecast OK · Resets to sale price
- Current annual tax
- $598 · $50/mo
- Projected year-2 tax
- $1,260 · $105/mo
- Expected delta
- +$662/yr (+$55/mo · 110.7%)
ⓘ Screening estimate from a state-policy table — verify with the county assessor before closing.
Climate risk First Street
- Flood 1/10 Low FEMA zone X (unshaded) · 0% chance over 30 yrs
- Wildfire 6/10 Major
- Heat 6/10 Major 7 d/yr ≥113°F today · 18 d/yr by 30 yrs out
- Wind 2/10 Low 2% chance of damaging wind over 30 yrs
- Air quality 2/10 Low 1 unhealthy d/yr today · 3 by 30 yrs out
Nearby sold comps map
Loading sold comps map…
Walkable amenities ~0.75 mi
Loading nearby amenities…
Taxation est. · year 1
- Rental income
- $15,286
- − Mortgage interest
- −$7,842
- − Property taxes
- −$598
- − Insurance
- −$700
- − Repairs & maintenance
- −$1,223
- − Management
- −$1,223
- − Depreciation
- −$4,073
- Taxable loss
- −$373
- Est. tax savings @ 24.0%
- +$89
- After-tax cash flow
- $2,057/yr
For passive investors: Depreciation is non-cash, so a rental often shows a tax loss while cash-flowing — sheltering income. Rental losses are passive: they offset passive income freely, and up to $25,000/yr can offset ordinary (W-2) income if you actively participate and your MAGI is under $100k (phasing out to $0 by $150k); unused losses carry forward. On sale, claimed depreciation is recaptured at up to 25%, and gains may owe capital-gains tax (a 1031 exchange can defer both). Figures are a year-1 estimate at your 24.0% rate — not tax advice; consult a CPA.
Schools (NCES district)
- District
- Bartlesville
- NCES district ID
- 4003630
- Math proficiency
- 30% ▼ -13.00%
- Reading proficiency
- 29% ▼ -10.00%
- Median HH income
- $48,889
- Composite
- 25.69/100
- National rank
- #7389
- State rank
- #59 of 270 in OK
Livability — Bartlesville
- Score
- 64/100
- State rank
- #175
- US rank
- #13940
Category grades
Schools grade is shown separately in the Schools card above.
Census & demographics
- Census place
- Bartlesville, OK
- County
- Washington County · 41,935 people
- City population
- 41,935
- Metro
- Bartlesville, OK
- Population (ZIP)
- 14,024
- Household income
- $47,168
- Rent vs Own
- Severe rent burden
- 395.0
Population outlook (Washington County) Hauer SSP2
- Today (2025)
- 54,946 people
- By 2030
- 56,249 · +2.4%
- By 2040
- 58,867 · +7.1%
- By 2050
- 61,600 · +12.1%
- By 2075
- 69,355 · +26.2%
- By 2100
- 73,067 · +33.0%
Race, ethnicity, and origin ACS 2023
- Neighborhood character
- Predominantly White (69%)
- Race & ethnicity
- White 69% Two or more races 14% Hispanic / Latino 7% Native American 7% Black 4%
- Hispanic origin (detail)
- Mexican 6%
- Common ancestry
- Slovak 2% Lithuanian 2% Italian 2%
- Foreign-born
- 2% · Canada
- Languages at home
- 96% English-only · Spanish 4%
Political lean MEDSL · Washington
- 2024 margin
- Solid R (+47.6) · D 25.0% · R 72.7% · Other 2.4%
- 2008→2024 swing
- -3.1pp toward R · 2008: -44.6pp · 2024: -47.6pp
- All cycles
- 2024: R+47.6 2020: R+48.0 2016: R+48.5 2012: R+47.8 2008: R+44.6
Not yet ingested
- Civics
- —
Market trends
- HPI YoY
- ▲ 14.78%
- Current HPI
- 309.9534
- Rent YoY
- —
- Metro
- Bartlesville, OK
- State GDP YoY
- ▲ 1.55%
- F500 in state
- 6
Industry mix (Fortune 500 HQ in OK)
| Industry | F500 HQs | Revenue |
|---|---|---|
| Energy | 3 | $48B |
|
||
Price history
+185.7% since first listed17 events — show timeline
- 2026-05-30 Pending — MLS Technology, Inc.
- 2026-05-28 Listed $140,000 MLS Technology, Inc.
- 2023-08-14 Rental Removed — BUILDIUM
- 2022-12-16 Listing Removed — MLS Technology, Inc.
- 2022-06-21 Listed $125,900 MLS Technology, Inc.
- 2022-02-19 Listing Removed — MLS Technology, Inc.
- 2022-01-07 Price Changed $1,600,000 MLS Technology, Inc.
- 2021-10-09 Listed $145,455 MLS Technology, Inc.
- 2020-01-24 Listing Removed — MLS Technology, Inc.
- 2020-01-08 Price Changed $46,500 MLS Technology, Inc.
- 2020-01-07 Listed $53,500 MLS Technology, Inc.
- 2008-12-12 Sold (MLS) $26,600 MLS Technology, Inc.
- 2008-11-04 Listing Removed — MLS Technology, Inc.
- 2008-10-24 Listed $29,000 MLS Technology, Inc.
- 2003-11-07 Sold (Public Records) $61,000 Public Records
- 2001-04-10 Listing Removed — MLS Technology, Inc.
- 2000-10-09 Listed $49,000 MLS Technology, Inc.
Property tax history
-1.1%/yrLatest (2025): $598 · +1.9% YoY. Source: county tax records.
Cash-flow waterfall
monthlySold comps — $/sqft
last 12 mo · ≤1 miLoading sold comps…