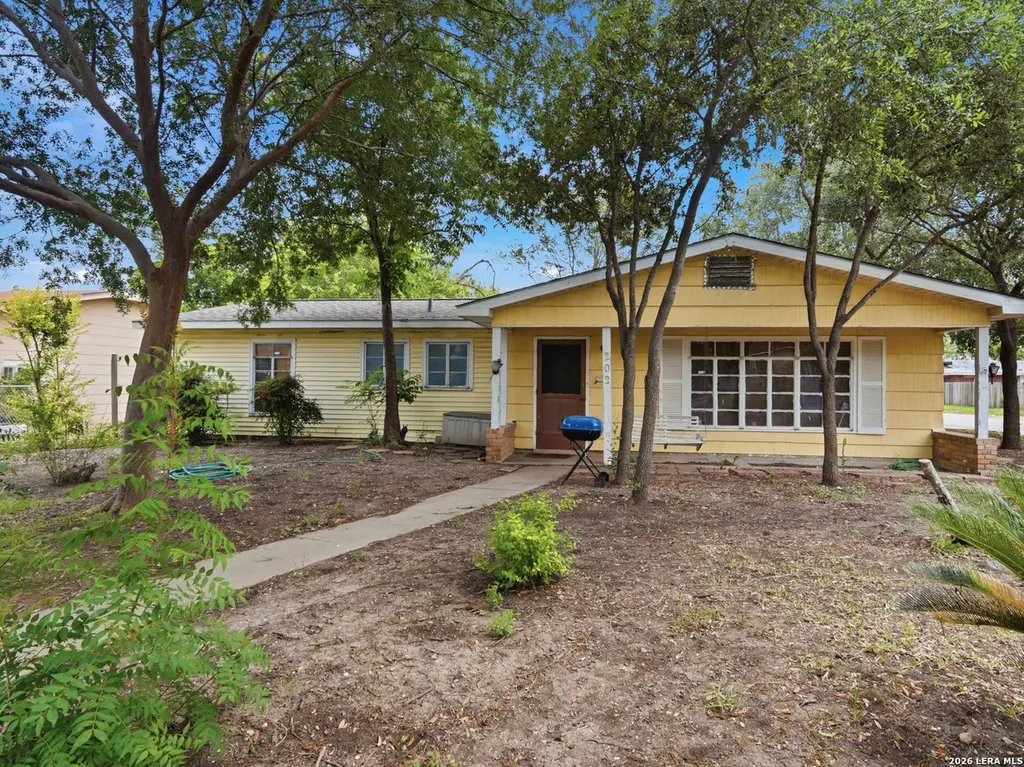
202 Cresham Dr · San Antonio, TX
Flood risk 1/10 · Minimal
- FEMA flood zone
- X (unshaded)
- Chance of flooding over 30 yrs
- 0.0%
- Est. flood insurance / yr
- $507 – $1,088
Fire risk 1/10 · Minimal
- Est. fire insurance / yr
- $1,222 – $2,270
Heat risk 8/10 · Major
- Hot days now (above 108°F)
- 7 days/yr
- Hot days in 30 yrs
- 22 days/yr
Wind risk 6/10 · Moderate
- Chance of severe wind over 30 yrs
- 77.0%
Air-quality risk 2/10 · Minimal
- Unhealthy air days now
- 0 days/yr
- Unhealthy air days in 30 yrs
- 1 days/yr
Risk factors via First Street. Map © Google.
Why this score? — see what drove the C grade
The composite is a weighted blend of 9 inputs, each scored 0–100. Each bar is that input's sub-score; the figure is the points it added to the 100-point composite (weight × sub-score).
- Cash flow +23.1/30.0
- ARV discount +7.5/15.0
- DSCR +7.4/10.0
- 1% rule +7.0/10.0
- Livability +4.0/5.0
- Schools +3.8/10.0
- Condition / age +2.5/5.0
- Rent growth +1.1/5.0
- Appreciation +0.0/10.0
$150,000
🖨 Deal sheet 📄 Offer letter ✓ Due diligence
Listing remarks
This 3-bedroom, 2-bath home sits on a spacious corner lot in a prime central location with convenient access to Loop 410, Hwy 281, Alamo Heights, Terrell Hills, and Fort Sam Houston. Just minutes from the airport, shopping, and dining, the location offers exceptional convenience. This home is full of potential and ready for your vision with 2 living areas, 2 dining rooms, and a large laundry room with ample storage. The yard offers enough room for entertaining and family fun. All this home needs is you and your imagination. With some TLC, this gem could truly shine. Whether you are looking for your next investment opportunity or a place to make your own, this home is packed with possibiliti
Key facts
- Corner lot
- 8,494 sq ft lot
- Garage
Tags
Property features AI
Finance
- Other: Possession at closing/funding; Listed for sale
- HOA & community: Subdivision: WILSHIRE TERRACE
Exterior
- Parking: Converted garage
- Utilities: City water system (SAWS); City sewer (SAWS); City garbage service; Gas supplied by CPS; Electricity supplied by CPS
- Home design: Pre-owned single-family property; Faces north
- Construction: Approximately 62 years old; Asbestos shingle, wood and siding exterior; Slab foundation; Composition roof
- Exterior features: Chain link fence; Mature trees; Corner lot; Paved streets and curbs
Interior
- Kitchen: Stove/Range
- Bedrooms: Master bedroom on lower level with ceiling fan; Bedroom 2; Bedroom 3
- Flooring: Ceramic tile; Linoleum; Unstained concrete
- Bathrooms: Two full bathrooms; Master bathroom with tub/shower combination and single vanity
- Heating & cooling: Central heating (electric); One central air conditioning unit; Living room fireplace
- Interior features: Ceiling fans; Two living areas; Living/dining room combination; Separate dining room; Two eating areas; Utility room inside; Ground level / no steps; Converted garage used as interior space; Some window coverings remain
- Laundry & utility: Washer connection; Dryer connection; Laundry on main level; Utility room
Neighborhood map
What this means for you Summary
Snapshot
- This is a 3-bed/1.0-bath single-family listed at $150k.
Deal economics
- At list price, monthly cash flow is $269 ($3k/yr) — positive.
- The deal already cash-flows at list — no discount required.
- Meets the 1% rule at list price ($2k rent vs $150k).
- Recommended offer: $148k (1.5% below list) — sets the bar for market timing.
- Cap rate 8.4% vs local median 3.8% in San Antonio — top-decile yield for the area; either an underpriced asset or a hidden risk that comps aren't pricing in. Stress-test before assuming the spread holds.
Location & tenants
- Location reads 80/100 on livability (#31 in TX, #1,616 nationally) — a professional / high-income tenant draw. Strengths: amenities A+, commute A+, cost of living A+; Watch: crime F.
- North East ISD (urban): math 38% / reading 49% proficiency, ranked #276 of 826 in TX (top 33%) — families likely to look elsewhere, expect single-tenant / working-renter base with shorter leases.
- Zoned schools: Wilshire El (math 32% / reading 37%, grade F, #1,995 of 4,322 statewide, top 50%, 265 students, 87% FRL); Roosevelt H S (math 20% / reading 40%, grade F, #1,096 of 1,632 statewide, top 68%, 2,599 students, 72% FRL) — zoned schools average 79% FRL vs 41% district-wide (38 pts higher); higher-poverty schools than district average — tighter screening recommended.
- Market conditions: Rents falling (-5.6%/yr); 131 active listings in the ZIP; 40 comparable units currently listed for rent nearby; rentals at typical pace (median 17d on market — plan ~3-4 weeks tenant-placement turnaround); 8,308 units permitted in Bexar County in 2024 (2,506 in 5+ unit buildings).
- This rent runs 38% of the median local income ($57k/yr) — at the standard rent-burdened threshold; future hikes will face affordability resistance.
Forward outlook
- Local home prices are declining (-3.0%/yr); year-one equity from $1k of loan paydown is wiped out by about $4k of value loss. Plan a longer hold.
- Bexar County population projected at +50% by 2050 — long-run rental-demand tailwind backs the buy-and-hold thesis.
Negotiation context
- It's been on market 26 days — a 2% lower offer ($148k) is reasonable based on typical stale-listing flexibility.
Risks & watch-outs
- Climate carrying-cost: major wind risk, 77% chance of damaging wind over 30y; extreme-heat days projected 7→22/yr by 2055 (HVAC capex compounding) — expect insurance premiums to compound above CPI over the hold.
Questions for the listing agent
- Built in 1964 — when were the roof, HVAC, electrical panel, plumbing, and water heater last replaced?
- Is there a deadline driving the sale (1031 exchange, divorce, estate, relocation)? That informs how much negotiation room exists.
- Crime grade is F in this area — have there been break-ins, vandalism, or insurance claims at this property in the last 3 years? What carrier currently insures it and at what premium?
- What's the average days-on-market for RENTAL listings here right now (not sales)? A rising rental-DOM trend means longer vacancies and softer asking-rent achievability than the comps imply.
- What's the recent tenant-quality profile in this submarket — average credit score on applications, eviction rate, late-payment / NSF rate, and stable-employment percentage? A property-management company in the area should have these aggregated.
- How much new for-sale + rental construction is in the pipeline within 1–3 miles? Heavy new supply typically softens prices + rents 12–24 months out; constrained supply supports both.
Investment metrics
- 1% rule
- 1.20% ✓
- Cap rate
- 8.45%
- Cash-on-cash
- 7.70%
- DSCR
- 1.34
- GRM
- 7.0
CMA / ARV
- ARV (on-the-fly)
- $310,434
- Comps found
- 12
Show comp detail 12 sales within ~0.75 mi
| Address | Dist | Beds/Ba | Sqft | Sold | Price | $/sf | Match |
|---|---|---|---|---|---|---|---|
| 127 Sabyan | 0.10mi | 3/2.0 | 1,448 (-13%) | 6mo | $184,000 | $127 | 64 |
| 619 Olney | 0.55mi | 4/2.0 (+1) | 1,628 (-2%) | 2mo | $430,000 | $264 | 60 |
| 503 Timberlane Dr | 0.28mi | 4/2.0 (+1) | 1,599 (-4%) | 15mo | $239,500 | $150 | 59 |
| 916 Morningside | 0.50mi | 2/2.0 (-1) | 1,572 (-6%) | 3mo | $475,000 | $302 | 56 |
| 107 Grantham | 0.46mi | 3/2.0 | 1,835 (+10%) | 6mo | $276,000 | $150 | 53 |
| 527 Blakeley Dr | 0.61mi | 3/2.5 | 1,557 (-7%) | 8mo | $299,000 | $192 | 47 |
| 727 Rittiman Rd | 0.65mi | 3/2.0 | 1,644 (-2%) | 19mo | $199,999 | $122 | 47 |
| 630 Sumner | 0.55mi | 3/2.0 | 1,504 (-10%) | 10mo | $119,900 | $80 | 45 |
| 712 Rittiman | 0.51mi | 4/2.0 (+1) | 1,836 (+10%) | 10mo | $375,000 | $204 | 42 |
| 3754 Electra | 0.44mi | 4/3.0 (+1) | 1,829 (+10%) | 16mo | $339,999 | $186 | 37 |
| 1016 Canterbury Hill St | 0.62mi | 2/2.0 (-1) | 1,560 (-6%) | 21mo | $350,000 | $224 | 34 |
| 3950 Tropical Dr | 0.68mi | 3/2.0 | 1,456 (-13%) | 20mo | $239,999 | $165 | 26 |
Match score weights: distance 35% · size 25% · config 20% · recency 20%. Top-matched comps best support the ARV.
Projected returns pro-forma
-3.0% appreciation · 0.0% rent growth · sell at horizon
- IRR
- -8.2%
- Equity multiple
- 0.71×
- Total profit
- $-12,320
- Equity at exit
- $22,365
- IRR
- -3.6%
- Equity multiple
- 0.80×
- Total profit
- $-8,594
- Equity at exit
- $12,969
Cash invested: $42,000 (down + closing). Projections, not guarantees.
Landlord ↔ Tenant lean methodology
- Overall (STATE)
- 87 Strongly Landlord-Friendly
- State Texas
- 87 Strongly Landlord-Friendly · R+5
- County
- — inherits STATE
- City
- — inherits STATE
ZIP-level market 78218
- Home prices YoY
- -16.1%
- Rents YoY
- -5.6%
- Active inventory
- 131
- Price-to-rent
- 7.0×
Monthly cashflow live
- Estimated rent
- $1,797 high interval (Pro) →
- Mortgage (P&I)
- −$787
- Tax from tax record
- −$301 /mo · $3,611/yr
- Insurance
- −$62
- HOA
- −$0
- Vacancy / Maint / Mgmt
- −$377
- Net cashflow
- $269
Break-even live
UW: 25.0% down · 7.5% · 30yr · 1.5% tax · 5.0% vac · 8.0% maint · 8.0% mgmt
Financing live
Cash to close
- Down payment
- $37,500
- Closing costs
- $4,500
- Reserves months
- —
- Total cash needed
- —
Loan-product check · same deal, 3 products live
Conventional
25% down · 7.5% · 30yr
- Down + closing
- —
- Monthly P&I
- —
- Monthly cashflow
- —
- DSCR
- —
- Eligible?
- —
Personal DTI + credit; lowest rate.
DSCR
20% down · 8.5% · 30yr
- Down + closing
- —
- Monthly P&I
- —
- Monthly cashflow
- —
- DSCR
- —
- Eligible?
- —
No personal income docs; deal must DSCR.
Hard money
10% down · 12.0% · 12mo
- Down + closing
- —
- Monthly P&I
- —
- Monthly cashflow
- —
- DSCR
- —
- Eligible?
- —
Short-term bridge; refi at stabilization.
Rent comps 40 comps
| Address | Beds | Baths | Sqft | Rent | $/sqft | DOM | Units | Dist |
|---|---|---|---|---|---|---|---|---|
| 258 Cresham Dr San Antonio, TX | 3.0 | 2.0 | 1383 | $1,650 | $1.19 | 44d | 1 | 0.16mi |
| 2530 Harry Wurzbach Rd San Antonio, TX | 1.0–3.0 | 1.0–2.0 | 950 | $1,420 | $1.49 | 3d | 10 | 0.25mi |
| 1006 Sumner Dr San Antonio, TX | 3.0 | 2.0 | 1314 | $1,697 | $1.29 | 24d | 1 | 0.28mi |
| 339 Brettonwood Dr San Antonio, TX | 3.0 | 2.0 | 1063 | $2,000 | $1.88 | 24d | 1 | 0.33mi |
| 3615 Electra Dr San Antonio, TX | 4.0 | 2.0 | 1992 | $2,299 | $1.15 | 10d | 1 | 0.35mi |
| 742 Olney Dr San Antonio, TX | 3.0 | 2.0 | 1469 | $1,445 | $0.98 | 44d | 1 | 0.39mi |
| 354 Brettonwood Dr Unit 1 San Antonio, TX | 3.0 | 1.0 | 1056 | $1,395 | $1.32 | 44d | 1 | 0.39mi |
| 3623 Invicta Dr San Antonio, TX | 3.0 | 2.0 | 1688 | $1,695 | $1.00 | 2d | 1 | 0.42mi |
| 258 Antrim Dr San Antonio, TX | 3.0 | 2.0 | 1252 | $1,595 | $1.27 | 44d | 1 | 0.42mi |
| 3730 La Sabre Dr San Antonio, TX | 4.0 | 2.0 | 1434 | $1,900 | $1.32 | 44d | 1 | 0.49mi |
| 630 Sumner Dr San Antonio, TX | 4.0 | 2.0 | 1368 | $1,975 | $1.44 | 18d | 1 | 0.56mi |
| 515 Blakeley Dr San Antonio, TX | 3.0 | 2.0 | 1118 | $2,000 | $1.79 | 16d | 1 | 0.68mi |
| 842 Corinne Dr #21 San Antonio, TX | 3.0 | 2.0 | 1248 | $49,000 | $39.26 | 22d | 1 | 0.72mi |
| 1049 Ivy Ln San Antonio, TX | 3.0 | 2.0 | 2147 | $2,850 | $1.33 | 8d | 1 | 0.74mi |
| 414 Olney Dr San Antonio, TX | 2.0 | 2.0 | 1186 | $1,495 | $1.26 | 22d | 1 | 0.81mi |
| 3202 Eisenhauer Rd San Antonio, TX | 2.0–3.0 | 2.0–2.5 | 1375 | $1,795 | $1.30 | 3d | 2 | 0.83mi |
| 1320 Austin Hwy San Antonio, TX | 3.0 | 1.0–2.0 | 981 | $1,633 | $1.66 | 2d | 38 | 0.83mi |
| 3202 Eisenhauer Rd #801 San Antonio, TX | 2.0 | 2.0 | 1407 | $1,795 | $1.28 | 3d | 1 | 0.83mi |
| 528 Rittiman Rd San Antonio, TX | 2.0 | 1.0 | 1520 | $2,200 | $1.45 | 13d | 1 | 0.87mi |
| 217 Deerwood Dr San Antonio, TX | 2.0 | 1.0 | 1100 | $1,200 | $1.09 | 44d | 1 | 0.87mi |
| 4102 Waikiki Dr San Antonio, TX | 3.0 | 1.0 | 1167 | $1,395 | $1.20 | 14d | 1 | 0.89mi |
| 323 Byrnes Dr San Antonio, TX | 4.0 | 2.0 | 1336 | $1,950 | $1.46 | 24d | 1 | 0.91mi |
| 4229 Renault Dr San Antonio, TX | 3.0 | 2.0 | 1152 | $1,525 | $1.32 | 18d | 1 | 0.91mi |
| 3102 Eisenhauer Rd San Antonio, TX | 2.0 | 2.5 | 1742 | $1,862 | $1.07 | 3d | 2 | 0.93mi |
| 127 Rainbow Dr San Antonio, TX | 2.0–3.0 | 2.0 | 1000 | $1,453 | $1.45 | 4d | 1 | 0.93mi |
| 310 Sumner Dr San Antonio, TX | 3.0 | 2.0 | 1382 | $1,650 | $1.19 | 16d | 1 | 0.94mi |
| 6347 Kingston Dr San Antonio, TX | 3.0 | 2.0 | 1672 | $1,800 | $1.08 | 4d | 1 | 0.98mi |
| 116 Lyman Dr San Antonio, TX | 3.0 | 2.0 | 1468 | $2,150 | $1.46 | 44d | 1 | 1.00mi |
| 6419 N Vandiver Rd San Antonio, TX | 1.0–3.0 | 1.0–2.0 | 1020 | $2,260 | $2.21 | 2d | 8 | 1.01mi |
| 417 S Vandiver Rd San Antonio, TX | 2.0 | 2.0 | 1597 | $1,895 | $1.19 | 44d | 1 | 1.02mi |
| 463 Bryn Mawr Dr Unit 463 San Antonio, TX | 2.0 | 1.0 | 1108 | $985 | $0.89 | 3d | 1 | 1.02mi |
| 459 Bryn Mawr Dr San Antonio, TX | 2.0 | 1.0 | 2020 | $1,195 | $0.59 | 44d | 1 | 1.03mi |
| 4207 Waikiki Dr San Antonio, TX | 3.0 | 2.0 | 1144 | $1,475 | $1.29 | 44d | 1 | 1.03mi |
| 1186 Garraty Rd San Antonio, TX | 2.0 | 2.5 | 1050 | $2,195 | $2.09 | 16d | 1 | 1.05mi |
| 140 Arvin Dr San Antonio, TX | 2.0 | 1.5 | 1663 | $2,395 | $1.44 | 2d | 1 | 1.06mi |
| 6900 N Vandiver Rd San Antonio, TX | 2.0 | 2.0 | 1235 | $975 | $0.79 | 8d | 1 | 1.06mi |
| 1149 Garraty Rd San Antonio, TX | 3.0 | 2.0 | 2084 | $2,900 | $1.39 | 2d | 1 | 1.06mi |
| 106 Covina Ave San Antonio, TX | 3.0 | 2.0 | 1421 | $2,000 | $1.41 | 2d | 1 | 1.06mi |
| 4310 Judivan San Antonio, TX | 3.0 | 2.0 | 1859 | $2,300 | $1.24 | 19d | 1 | 1.09mi |
| 417 Harmon Dr San Antonio, TX | 3.0 | 2.0 | 1408 | $1,975 | $1.40 | 18d | 1 | 1.14mi |
Listing history 16 events
-
2026-06-18days on market $150,000 Active 26 DOM
-
2026-06-17days on market $150,000 Active 25 DOM
-
2026-06-16days on market $150,000 Active 24 DOM
-
2026-06-15days on market $150,000 Active 23 DOM
-
2026-06-13days on market $150,000 Active 21 DOM
-
2026-06-13days on market $150,000 Active 20 DOM
-
2026-06-09days on market $150,000 Active 17 DOM
-
2026-06-08days on market $150,000 Active 16 DOM
-
2026-06-07days on market $150,000 Active 15 DOM
-
2026-06-04days on market $150,000 Active 12 DOM
-
2026-06-03statusdays on market $150,000 Active 11 DOM
-
2026-06-02days on market $150,000 New 10 DOM
-
2026-06-01days on market $150,000 New 9 DOM
-
2026-05-31days on market $150,000 New 8 DOM
-
2026-05-23$150,000 New
-
1991-10-01soldstatus
ⓘ Source: listings_history table (triggers on properties + properties_extension) + one-shot
backfill from property_details.listing_events for pre-trigger history.
Tax reassessment forecast TX · Resets to sale price
- Current annual tax
- $3,611 · $301/mo
- Projected year-2 tax
- $3,611 · $301/mo
- Expected delta
- $0/yr ($0/mo · 0.0%)
ⓘ Screening estimate from a state-policy table — verify with the county assessor before closing.
Climate risk First Street
- Flood 1/10 Low FEMA zone X (unshaded) · 0% chance over 30 yrs
- Wildfire 1/10 Low
- Heat 8/10 Severe 7 d/yr ≥108°F today · 22 d/yr by 30 yrs out
- Wind 6/10 Major 77% chance of damaging wind over 30 yrs
- Air quality 2/10 Low 0 unhealthy d/yr today · 1 by 30 yrs out
Nearby sold comps map
Loading sold comps map…
Walkable amenities ~0.75 mi
Loading nearby amenities…
Taxation est. · year 1
- Rental income
- $21,560
- − Mortgage interest
- −$8,402
- − Property taxes
- −$3,611
- − Insurance
- −$750
- − Repairs & maintenance
- −$1,725
- − Management
- −$1,725
- − Depreciation
- −$4,364
- Taxable income
- $984
- Est. tax owed @ 24.0%
- −$236
- After-tax cash flow
- $2,996/yr
For passive investors: Depreciation is non-cash, so a rental often shows a tax loss while cash-flowing — sheltering income. Rental losses are passive: they offset passive income freely, and up to $25,000/yr can offset ordinary (W-2) income if you actively participate and your MAGI is under $100k (phasing out to $0 by $150k); unused losses carry forward. On sale, claimed depreciation is recaptured at up to 25%, and gains may owe capital-gains tax (a 1031 exchange can defer both). Figures are a year-1 estimate at your 24.0% rate — not tax advice; consult a CPA.
Schools (NCES district)
- District
- North East ISD
- NCES district ID
- 4832940
- Math proficiency
- 38% ▼ -14.00%
- Reading proficiency
- 49% ▼ -4.00%
- Median HH income
- $57,715
- Composite
- 38.1/100
- National rank
- #4276
- State rank
- #276 of 826 in TX
Livability — San Antonio
- Score
- 80/100
- State rank
- #31
- US rank
- #1616
Category grades
Schools grade is shown separately in the Schools card above.
Census & demographics
- Census place
- San Antonio, TX
- County
- Bexar County · 1,990,555 people
- City population
- 1,806,925
- Metro
- San Antonio-New Braunfels, TX
- Population (ZIP)
- 39,428
- Household income
- $57,285
- Rent vs Own
- Severe rent burden
- 2508.0
Population outlook (Bexar County) Hauer SSP2
- Today (2025)
- 2,336,851 people
- By 2030
- 2,560,728 · +9.6%
- By 2040
- 3,020,569 · +29.3%
- By 2050
- 3,493,522 · +49.5%
- By 2075
- 4,668,459 · +99.8%
- By 2100
- 5,533,242 · +136.8%
Race, ethnicity, and origin ACS 2023
- Neighborhood character
- Diverse neighborhood (Simpson 0.64)
- Race & ethnicity
- Hispanic / Latino 53% Two or more races 26% White 25% Black 14% Asian 3% Native American 2%
- Hispanic origin (detail)
- Mexican 41% Puerto Rican 3%
- Common ancestry
- Serbian 2% Italian 1% Romanian 1%
- Foreign-born
- 18% · Canada, Vietnam, China
- Languages at home
- 60% English-only · Spanish 34% Vietnamese 1% Other Asian/Pacific 1%
Political lean MEDSL · Bexar
- 2024 margin
- Lean D (+9.8) · D 54.3% · R 44.6% · Other 1.1%
- 2008→2024 swing
- +4.2pp toward D · 2008: 5.6pp · 2024: 9.8pp
- All cycles
- 2024: D+9.8 2020: D+18.2 2016: D+13.5 2012: D+4.6 2008: D+5.6
Not yet ingested
- Civics
- —
Market trends
- HPI YoY
- ▼ -52.17%
- Current HPI
- 271.2807
- Rent YoY
- ▼ -5.56%
- Metro
- San Antonio-New Braunfels, TX
- State GDP YoY
- ▲ 3.95%
- F500 in state
- 110
Industry mix (Fortune 500 HQ in TX)
| Industry | F500 HQs | Revenue |
|---|---|---|
| Energy | 16 | $1,198B |
|
||
| Technology | 5 | $198B |
|
||
| Engineering / Construction | 4 | $72B |
|
||
| Energy Services | 3 | $60B |
|
||
| Utilities | 3 | $41B |
|
||
| Healthcare | 2 | $330B |
|
||
Price history
2 events — show timeline
- 2026-05-23 Listed $150,000 LERA
- 1991-10-01 Sold (Public Records) — Public Records
Property tax history
+5.2%/yrLatest (2025): $3,611 · +0.7% YoY. Source: county tax records.
Cash-flow waterfall
monthlySold comps — $/sqft
last 12 mo · ≤1 miLoading sold comps…