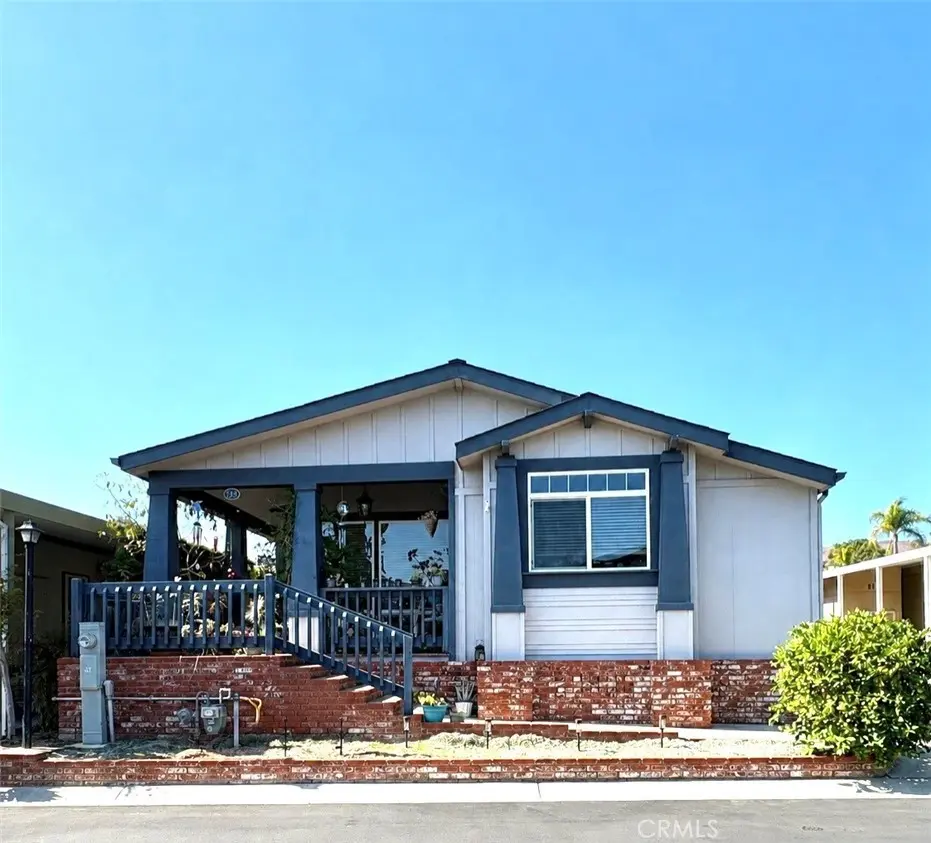
1051 Site #283 · Brea, CA
Flood risk 1/10 · Minimal
- FEMA flood zone
- X (unshaded)
- Chance of flooding over 30 yrs
- 0.0%
- Est. flood insurance / yr
- $507 – $1,088
Fire risk 5/10 · Moderate
- Est. fire insurance / yr
- $659 – $1,223
Heat risk 6/10 · Moderate
- Hot days now (above 96°F)
- 7 days/yr
- Hot days in 30 yrs
- 22 days/yr
Wind risk 1/10 · Minimal
- Chance of severe wind over 30 yrs
- —
Air-quality risk 5/10 · Moderate
- Unhealthy air days now
- 7 days/yr
- Unhealthy air days in 30 yrs
- 9 days/yr
Risk factors via First Street. Map © Google.
Why this score? — see what drove the D+ grade
The composite is a weighted blend of 9 inputs, each scored 0–100. Each bar is that input's sub-score; the figure is the points it added to the 100-point composite (weight × sub-score).
- Cash flow +21.3/30.0
- DSCR +6.8/10.0
- Schools +5.1/10.0
- 1% rule +4.3/10.0
- Livability +3.8/5.0
- Rent growth +2.9/5.0
- Condition / age +2.5/5.0
- ARV discount +0.0/15.0
- Appreciation +0.0/10.0
$389,000
🖨 Deal sheet 📄 Offer letter ✓ Due diligence
Listing remarks MLS
Gorgeous Silvercrest for sale at The Crestmont Estates all age manufactured home community in Brea! This beautiful and highly upgraded home offers 3 large bedrooms and 2 full bathrooms. There is a great wrap around porch and 1 car garage with a private drive way that can accommodate another 3 cars. The home is highly upgraded including bamboo and tile flooring, real marble countertops, ceiling height backsplash in kitchen, fully tiled walls in showers as well as a walk in jetted tub in master bath!
Key facts
- 32.47 acre lot
- Garage
- Community pool
Property features AI
Finance
- Other: Mobile home remains on site; Mobile dimensions approx. 30' x 61'
- Financial info: Land lease of $1,830 monthly
- HOA & community: Community pool; Curbs in neighborhood; Park name: Crestmont; Manager approval required for move-in
Exterior
- Parking: Garage (1 space); Total 1 parking space; Has parking
- Utilities: Public sewer; District/public water
- Home design: Craftsman model; Single-story; Entry at main level
- Construction: Hardboard and fiber cement siding; Cellulose insulation
- Exterior features: Front porch; Wrap-around porch; Brick accents; Porch; Community pool; Close to clubhouse
Interior
- Kitchen: Kitchen island; Granite counters; Microwave; Ice maker; Gas range; Gas oven
- Bedrooms: All bedrooms on main floor; Main floor primary bedroom; Primary bathroom; Walk-in closet
- Flooring: Tile; Bamboo
- Bathrooms: Two full bathrooms; Double sinks; Jetted tub; Bathtub and separate shower
- Heating & cooling: Central cooling; Central furnace heating
- Interior features: Ceiling fan; Cathedral/vaulted ceilings; Granite counters; Double pane windows; Blinds; Main-floor entry (Main); Single-level home
- Laundry & utility: Dedicated laundry room; Washer included; Dryer included
Neighborhood map
What this means for you Summary
Snapshot
- This is a 3-bed/2.0-bath manufactured listed at $389k.
Deal economics
- At list price, monthly cash flow is $572 ($7k/yr) — positive.
- The deal already cash-flows at list — no discount required.
- To meet the 1% rule (rent ≥ 1% of price), the offer needs to be $360k (7.5% below list).
- Recommended offer: $360k (7.5% below list) — sets the bar for 1% rule.
- Cap rate 8.1% vs local median 2.1% in Brea — top-decile yield for the area; either an underpriced asset or a hidden risk that comps aren't pricing in. Stress-test before assuming the spread holds.
Location & tenants
- Location reads 76/100 on livability (#100 in CA, #3,570 nationally) — a middle-class / working-renter tenant base. Strengths: amenities A+, employment A+, schools A-; Watch: health & safety C-, cost of living F.
- Brea-Olinda Unified (suburban): math 48% / reading 65% proficiency, ranked #84 of 517 in CA (top 16%) — acceptable for families but not a draw, mixed tenant base, ~2y average lease.
- Market conditions: Rents rising (+1.8%/yr); 63 active listings in the ZIP; 16 comparable units currently listed for rent nearby; rentals leasing fast (median 13d on market — plan ~1-2 weeks tenant-placement turnaround); high-income renter base; 6,974 units permitted in Orange County in 2024 (3,839 in 5+ unit buildings).
- This rent runs 35% of the median local income ($124k/yr) — at the standard rent-burdened threshold; future hikes will face affordability resistance.
Forward outlook
- Local home prices are declining (-3.0%/yr); year-one equity from $3k of loan paydown is wiped out by about $12k of value loss. Plan a longer hold.
- Orange County population projected at +14% by 2050 — modest demand growth; plan on rents tracking national, not racing it.
Negotiation context
- Only 14 days on market — expect competitive offers; lowballing is unlikely to land.
- 2 sale attempts since 4y ago; this cycle's ask is 8% above the opening price — seller raised mid-cycle; expect resistance to lowballs.
Risks & watch-outs
- Climate carrying-cost: moderate wildfire risk; extreme-heat days projected 7→22/yr by 2055 (HVAC capex compounding) — expect insurance premiums to compound above CPI over the hold.
Questions for the listing agent
- Is there a deadline driving the sale (1031 exchange, divorce, estate, relocation)? That informs how much negotiation room exists.
- Schools are A-rated — typically a magnet for longer-tenancy family renters. What's the average tenant stay here, and is there a school-zone premium baked into asking?
- The area grade is low — what's the realistic commute time and amenity access for the typical tenant pool here? Any planned neighborhood developments (good or bad) we should know about?
- What's the average days-on-market for RENTAL listings here right now (not sales)? A rising rental-DOM trend means longer vacancies and softer asking-rent achievability than the comps imply.
- What's the recent tenant-quality profile in this submarket — average credit score on applications, eviction rate, late-payment / NSF rate, and stable-employment percentage? A property-management company in the area should have these aggregated.
- How much new for-sale + rental construction is in the pipeline within 1–3 miles? Heavy new supply typically softens prices + rents 12–24 months out; constrained supply supports both.
Investment metrics
- 1% rule
- 0.93% ✗
- Cap rate
- 8.06%
- Cash-on-cash
- 6.30%
- DSCR
- 1.28
- GRM
- 9.0
CMA / ARV
- ARV (on-the-fly)
- $283,900
- Comps found
- 8
Show comp detail 8 sales within ~0.75 mi
| Address | Dist | Beds/Ba | Sqft | Sold | Price | $/sf | Match |
|---|---|---|---|---|---|---|---|
| 1051 Site Dr #227 | 0.00mi | 3/2.0 | 1,664 (-2%) | 8mo | $252,000 | $151 | 90 |
| 1051 Site Dr #109 | 0.00mi | 3/2.0 | 1,738 (+2%) | 14mo | $280,000 | $161 | 85 |
| 1051 Site Dr #51 | 0.00mi | 3/2.0 | 1,620 (-5%) | 11mo | $270,000 | $167 | 83 |
| 1051 Site Dr #15 | 0.00mi | 3/2.0 | 1,620 (-5%) | 15mo | $325,000 | $201 | 80 |
| 1051 Site Dr #265 | 0.00mi | 3/2.0 | 1,624 (-4%) | 16mo | $315,000 | $194 | 80 |
| 1051 Site Dr #31 | 0.00mi | 3/2.0 | 1,680 (-1%) | 23mo | $230,000 | $137 | 79 |
| 1051 Site Dr #288 | 0.00mi | 3/2.0 | 1,600 (-6%) | 24mo | $300,000 | $188 | 70 |
| 1051 N Site Dr #168 | 0.00mi | 4/2.0 (+1) | 1,926 (+13%) | 14mo | $269,000 | $140 | 61 |
Match score weights: distance 35% · size 25% · config 20% · recency 20%. Top-matched comps best support the ARV.
Projected returns pro-forma
-3.0% appreciation · 1.78% rent growth · sell at horizon
- IRR
- -7.9%
- Equity multiple
- 0.71×
- Total profit
- $-31,168
- Equity at exit
- $58,001
- IRR
- 0.2%
- Equity multiple
- 1.01×
- Total profit
- $1,478
- Equity at exit
- $33,634
Cash invested: $108,920 (down + closing). Projections, not guarantees.
Landlord ↔ Tenant lean methodology
- Overall (STATE)
- 18 Strongly Tenant-Friendly
- State California
- 18 Strongly Tenant-Friendly · D+13
- County
- — inherits STATE
- City
- — inherits STATE
ZIP-level market 92821
- Rents YoY
- 1.8%
- Active inventory
- 63
- Price-to-rent
- 9.0×
Monthly cashflow live
- Estimated rent
- $3,599 high interval (Pro) →
- Mortgage (P&I)
- −$2,040
- Tax from tax record
- −$69 /mo · $828/yr
- Insurance
- −$162
- HOA
- −$0
- Vacancy / Maint / Mgmt
- −$756
- Net cashflow
- $572
Break-even live
UW: 25.0% down · 7.5% · 30yr · 1.5% tax · 5.0% vac · 8.0% maint · 8.0% mgmt
Financing live
Cash to close
- Down payment
- $97,250
- Closing costs
- $11,670
- Reserves months
- —
- Total cash needed
- —
Loan-product check · same deal, 3 products live
Conventional
25% down · 7.5% · 30yr
- Down + closing
- —
- Monthly P&I
- —
- Monthly cashflow
- —
- DSCR
- —
- Eligible?
- —
Personal DTI + credit; lowest rate.
DSCR
20% down · 8.5% · 30yr
- Down + closing
- —
- Monthly P&I
- —
- Monthly cashflow
- —
- DSCR
- —
- Eligible?
- —
No personal income docs; deal must DSCR.
Hard money
10% down · 12.0% · 12mo
- Down + closing
- —
- Monthly P&I
- —
- Monthly cashflow
- —
- DSCR
- —
- Eligible?
- —
Short-term bridge; refi at stabilization.
Rent comps 16 comps
| Address | Beds | Baths | Sqft | Rent | $/sqft | DOM | Units | Dist |
|---|---|---|---|---|---|---|---|---|
| 350 W Central Ave Brea, CA | 1.0–3.0 | 1.0–2.5 | 1024 | $4,210 | $4.11 | 1d | 8 | 0.42mi |
| 730 Brooklyn Dr Brea, CA | 2.0 | 2.5 | 1210 | $3,400 | $2.81 | 24d | 1 | 0.45mi |
| 250 W Central Ave Brea, CA | 2.0 | 2.0 | 1100 | $2,930 | $2.66 | 17d | 2 | 0.52mi |
| 319 W Lambert Rd Brea, CA | 2.0 | 2.0 | 1120 | $3,333 | $2.98 | 4d | 9 | 0.78mi |
| 308 Mountain Ct Brea, CA | 3.0 | 2.0 | 1730 | $3,550 | $2.05 | 43d | 1 | 0.95mi |
| 1511 Kinsler Ct Brea, CA | 3.0 | 2.5 | 1605 | $4,095 | $2.55 | 15d | 1 | 0.98mi |
| 369 Meadow Ct Brea, CA | 3.0 | 2.0 | 1281 | $3,450 | $2.69 | 43d | 1 | 1.11mi |
| 1913 Lotus Pl Brea, CA | 4.0 | 2.0 | 1627 | $4,100 | $2.52 | 1d | 1 | 1.30mi |
| 141 N Fonda St Unit 1 La Habra, CA | 3.0 | 2.5 | 1300 | $3,400 | $2.62 | 10d | 1 | 1.42mi |
| 201 Laurel Ave #7 Brea, CA | 2.0 | 2.5 | 1218 | $3,450 | $2.83 | 43d | 1 | 1.43mi |
| 1500 Eastpark Dr Unit 3 La Habra, CA | 2.0 | 1.5 | 1286 | $2,500 | $1.94 | 1d | 1 | 1.44mi |
| 209 S Fonda St La Habra, CA | 2.0 | 2.0 | 1200 | $3,500 | $2.92 | 1d | 1 | 1.45mi |
| 331 Pomelo Ave Brea, CA | 3.0 | 2.0 | 1538 | $4,200 | $2.73 | 43d | 1 | 1.46mi |
| 242 S Redwood Ave Unit C Brea, CA | 3.0 | 2.5 | 1590 | $3,995 | $2.51 | 7d | 1 | 1.48mi |
| 664 Olive Ave Brea, CA | 4.0 | 2.0 | 1472 | $4,500 | $3.06 | 6d | 1 | 1.49mi |
| 628 E Birch St Unit D Brea, CA | 2.0 | 1.5 | 1104 | $2,850 | $2.58 | 13d | 1 | 1.49mi |
Listing history 10 events
-
2026-06-18days on market $389,000 Coming Soon 14 DOM
-
2026-06-17days on market $389,000 Coming Soon 13 DOM
-
2026-06-16days on market $389,000 Coming Soon 12 DOM
-
2026-06-15days on market $389,000 Coming Soon 11 DOM
-
2026-06-13days on market $389,000 Coming Soon 9 DOM
-
2026-06-13days on market $389,000 Coming Soon 8 DOM
-
2026-06-09days on market $389,000 Coming Soon 5 DOM
-
2026-06-08days on market $389,000 Coming Soon 4 DOM
-
2026-06-07remarks 681-char remark
-
2026-06-07$389,000 Coming Soon 3 DOM
ⓘ Source: listings_history table (triggers on properties + properties_extension) + one-shot
backfill from property_details.listing_events for pre-trigger history.
Tax reassessment forecast CA · Resets to sale price
- Current annual tax
- $828 · $69/mo
- Projected year-2 tax
- $2,956 · $246/mo
- Expected delta
- +$2,129/yr (+$177/mo · 257.1%)
ⓘ Screening estimate from a state-policy table — verify with the county assessor before closing.
Climate risk First Street
- Flood 1/10 Low FEMA zone X (unshaded) · 0% chance over 30 yrs
- Wildfire 5/10 Major
- Heat 6/10 Major 7 d/yr ≥96°F today · 22 d/yr by 30 yrs out
- Wind 1/10 Low
- Air quality 5/10 Major 7 unhealthy d/yr today · 9 by 30 yrs out
Nearby sold comps map
Loading sold comps map…
Walkable amenities ~0.75 mi
Loading nearby amenities…
Taxation est. · year 1
- Rental income
- $43,186
- − Mortgage interest
- −$21,790
- − Property taxes
- −$828
- − Insurance
- −$1,945
- − Repairs & maintenance
- −$3,455
- − Management
- −$3,455
- − Depreciation
- −$11,316
- Taxable income
- $397
- Est. tax owed @ 24.0%
- −$95
- After-tax cash flow
- $6,769/yr
For passive investors: Depreciation is non-cash, so a rental often shows a tax loss while cash-flowing — sheltering income. Rental losses are passive: they offset passive income freely, and up to $25,000/yr can offset ordinary (W-2) income if you actively participate and your MAGI is under $100k (phasing out to $0 by $150k); unused losses carry forward. On sale, claimed depreciation is recaptured at up to 25%, and gains may owe capital-gains tax (a 1031 exchange can defer both). Figures are a year-1 estimate at your 24.0% rate — not tax advice; consult a CPA.
Schools (NCES district)
- District
- Brea-Olinda Unified
- NCES district ID
- 0605880
- Math proficiency
- 48% ▼ -14.00%
- Reading proficiency
- 65% ▼ -2.00%
- Median HH income
- $83,131
- Composite
- 51.28/100
- National rank
- #1748
- State rank
- #84 of 517 in CA
Livability — Brea
- Score
- 76/100
- State rank
- #100
- US rank
- #3570
Category grades
Schools grade is shown separately in the Schools card above.
Census & demographics
- Census place
- Brea, CA
- County
- Orange County · 3,096,323 people
- City population
- 41,623
- Metro
- Los Angeles-Long Beach-Anaheim, CA
- Population (ZIP)
- 41,623
- Household income
- $123,629
- Rent vs Own
- Severe rent burden
- 1655.0
Population outlook (Orange County) Hauer SSP2
- Today (2025)
- 3,477,456 people
- By 2030
- 3,613,117 · +3.9%
- By 2040
- 3,835,945 · +10.3%
- By 2050
- 3,968,736 · +14.1%
- By 2075
- 4,097,053 · +17.8%
- By 2100
- 3,903,633 · +12.3%
Race, ethnicity, and origin ACS 2023
- Neighborhood character
- Diverse neighborhood (Simpson 0.69)
- Race & ethnicity
- White 38% Hispanic / Latino 32% Asian 24% Two or more races 14% Black 1%
- Hispanic origin (detail)
- Mexican 27%
- Common ancestry
- Slovak 2% Lithuanian 2% Italian 1%
- Foreign-born
- 23% · Canada, South Korea, China
- Languages at home
- 66% English-only · Spanish 16% Korean 6% Chinese 4%
Political lean MEDSL · Orange
- 2024 margin
- Toss-up / Even · D 49.7% · R 47.1% · Other 3.2%
- 2008→2024 swing
- +5.2pp toward D · 2008: -2.6pp · 2024: 2.6pp
- All cycles
- 2024: D+2.6 2020: D+9.0 2016: D+7.7 2012: R+8.3 2008: R+2.6
Not yet ingested
- Civics
- —
Market trends
- HPI YoY
- ▼ -826.78%
- Current HPI
- 374.8663
- Rent YoY
- ▲ 1.78%
- Metro
- Los Angeles-Long Beach-Anaheim, CA
- State GDP YoY
- ▲ 3.21%
- F500 in state
- 116
Industry mix (Fortune 500 HQ in CA)
| Industry | F500 HQs | Revenue |
|---|---|---|
| Technology | 27 | $1,492B |
|
||
| Financial Services | 3 | $174B |
|
||
| Retail | 3 | $44B |
|
||
| Insurance | 3 | $26B |
|
||
| Media / Entertainment | 2 | $115B |
|
||
| Pharmaceuticals / Biotech | 2 | $62B |
|
||
Price history
+8.4% since first listed5 events — show timeline
- 2026-06-05 Coming Soon $389,000 CRMLS
- 2022-05-31 Sold (MLS) $369,000 CRMLS
- 2022-05-23 Relisted — CRMLS
- 2022-05-01 Pending — CRMLS
- 2022-04-21 Listed $359,000 CRMLS
Property tax history
-3.9%/yrLatest (2025): $828 · +3.2% YoY. Source: county tax records.
Cash-flow waterfall
monthlySold comps — $/sqft
last 12 mo · ≤1 miLoading sold comps…