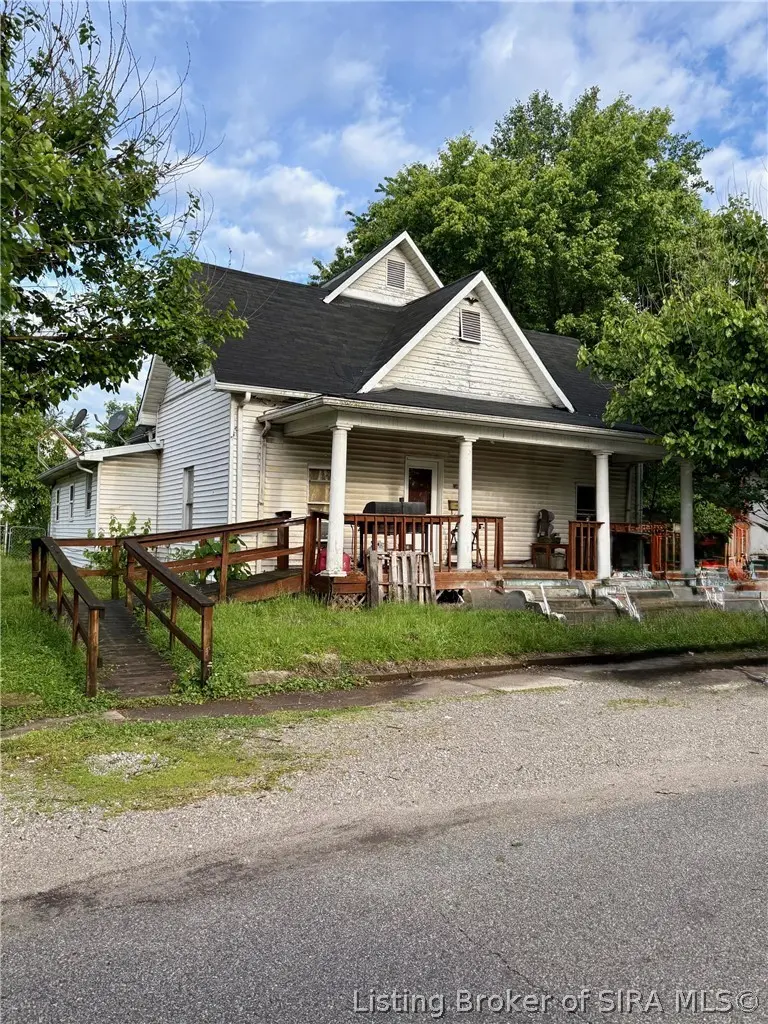
140 N Meridian St · Scottsburg, IN
Flood risk 1/10 · Minimal
- FEMA flood zone
- X (unshaded)
- Chance of flooding over 30 yrs
- 0.0%
- Est. flood insurance / yr
- $507 – $1,088
Fire risk 1/10 · Minimal
- Est. fire insurance / yr
- $717 – $1,331
Heat risk 5/10 · Moderate
- Hot days now (above 105°F)
- 7 days/yr
- Hot days in 30 yrs
- 20 days/yr
Wind risk 2/10 · Minimal
- Chance of severe wind over 30 yrs
- 1.0%
Air-quality risk 2/10 · Minimal
- Unhealthy air days now
- 0 days/yr
- Unhealthy air days in 30 yrs
- 1 days/yr
Risk factors via First Street. Map © Google.
Why this score? — see what drove the B- grade
The composite is a weighted blend of 9 inputs, each scored 0–100. Each bar is that input's sub-score; the figure is the points it added to the 100-point composite (weight × sub-score).
- Cash flow +30.0/30.0
- 1% rule +10.0/10.0
- DSCR +10.0/10.0
- ARV discount +7.5/15.0
- Livability +3.5/5.0
- Schools +3.2/10.0
- Rent growth +2.5/5.0
- Condition / age +2.5/5.0
- Appreciation +0.0/10.0
$49,900
🖨 Deal sheet 📄 Offer letter ✓ Due diligence
Listing remarks MLS
3 bedroom 1 bath home located convenient to downtown.
Key facts
- 0.26 acre lot
- Built 1900
- Listed 43 days
Property features AI
Finance
- Other: Lot approximately 0.26 acre (dimensions ~109 x 104); Paved road access
Exterior
- Parking: No garage
- Utilities: Public water; Public sewer
- Home design: Single-story home; Vinyl siding; Shingle roof; Residential zoning; Resale condition
- Construction: Block foundation; Crawlspace foundation; Built with vinyl siding
- Exterior features: Covered porch
Interior
- Kitchen: Kitchen on the first floor
- Bedrooms: Two first-floor bedrooms
- Bathrooms: 1 full bathroom; 1 half bathroom
- Heating & cooling: Window/wall air conditioning units
- Interior features: Crawl space basement
Neighborhood map
What this means for you Summary
Snapshot
- This is a 3-bed/1.0-bath single-family listed at $50k.
Deal economics
- At list price, monthly cash flow is $667 ($8k/yr) — positive.
- The deal already cash-flows at list — no discount required.
- Meets the 1% rule at list price ($1k rent vs $50k).
- Recommended offer: $48k (3.0% below list) — sets the bar for market timing.
- Cap rate 22.3% vs local median 4.1% in Scottsburg — top-decile yield for the area; either an underpriced asset or a hidden risk that comps aren't pricing in. Stress-test before assuming the spread holds.
Location & tenants
- Location reads 70/100 on livability (#152 in IN) — a middle-class / working-renter tenant base. Strengths: cost of living A+, health & safety A+, housing A; Watch: amenities F, commute F, employment D-.
- Scott County School District 2 (town): math 33% / reading 43% proficiency, ranked #166 of 301 in IN (top 55%) — families likely to look elsewhere, expect single-tenant / working-renter base with shorter leases.
- Market conditions: 106 active listings in the ZIP; 2 comparable units currently listed for rent nearby; 73 units permitted in Scott County in 2024 (0 in 5+ unit buildings).
Forward outlook
- Local home prices are declining (-3.0%/yr); year-one equity from $345 of loan paydown is wiped out by about $1k of value loss. Plan a longer hold.
- Scott County population projected at -23% by 2050 — secular population decline; favor cash flow + early exit over multi-decade hold.
- At projected returns (-3.0% appreciation + 3.0% rent growth), your $14k cash investment doubles in ~2 years — after that, you're playing with house money.
Negotiation context
- It's been on market 43 days — a 3% lower offer ($48k) is reasonable based on typical stale-listing flexibility.
- 2 sale attempts since 14y ago; this cycle's ask has dropped $10k (17%) from the opening price — seller is motivated, your offer sets the floor, not the list.
- Current owner paid $20k; list at $50k implies a 150% gain — meaningful room to come down on a strong offer.
Risks & watch-outs
- Watch-outs: built in 1900 — expect roof / HVAC / electrical / plumbing capex.
- Climate carrying-cost: extreme-heat days projected 7→20/yr by 2055 (HVAC capex compounding) — expect insurance premiums to compound above CPI over the hold.
Questions for the listing agent
- It's been on market 43 days. Have you received any prior offers? Is the seller open to a 3% concession, seller financing, or rate buy-down credit?
- Built in 1900 — when were the roof, HVAC, electrical panel, plumbing, and water heater last replaced?
- Is there a deadline driving the sale (1031 exchange, divorce, estate, relocation)? That informs how much negotiation room exists.
- What's the average days-on-market for RENTAL listings here right now (not sales)? A rising rental-DOM trend means longer vacancies and softer asking-rent achievability than the comps imply.
- What's the recent tenant-quality profile in this submarket — average credit score on applications, eviction rate, late-payment / NSF rate, and stable-employment percentage? A property-management company in the area should have these aggregated.
- How much new for-sale + rental construction is in the pipeline within 1–3 miles? Heavy new supply typically softens prices + rents 12–24 months out; constrained supply supports both.
Investment metrics
- 1% rule
- 2.57% ✓
- Cap rate
- 22.34%
- Cash-on-cash
- 57.31%
- DSCR
- 3.55
- GRM
- 3.2
CMA / ARV
- ARV (median comp)
- $181,090
- List price
- $49,900
- Delta
- -72.44%
- Verdict
- UNDERPRICED
- Comps
- 20 within 1.0 mi
Show comp detail 12 sales within ~0.75 mi
| Address | Dist | Beds/Ba | Sqft | Sold | Price | $/sf | Match |
|---|---|---|---|---|---|---|---|
| 155 N Gardner St | 0.27mi | 3/1.0 | 1,341 (-0%) | 4mo | $139,000 | $104 | 83 |
| 192 N Meridian St | 0.04mi | 3/2.0 | 1,233 (-8%) | 1mo | $165,000 | $134 | 80 |
| 205 S Second St | 0.40mi | 3/1.0 | 1,304 (-3%) | 2mo | $184,000 | $141 | 75 |
| 516 W Green St | 0.31mi | 3/2.0 | 1,291 (-4%) | 6mo | $236,900 | $184 | 70 |
| 1198 Allen St | 0.58mi | 3/1.5 | 1,350 (+0%) | 1mo | $239,900 | $178 | 69 |
| 615 Lakeshore Dr | 0.45mi | 2/1.5 (-1) | 1,320 (-2%) | 3mo | $140,000 | $106 | 66 |
| 267 N Railroad St | 0.18mi | 3/3.5 | 1,248 (-7%) | 6mo | $159,998 | $128 | 64 |
| 914 W Owen St | 0.43mi | 3/2.0 | 1,282 (-5%) | 6mo | $72,000 | $56 | 63 |
| 628 S First St | 0.52mi | 3/2.0 | 1,296 (-4%) | 5mo | $95,000 | $73 | 61 |
| 476 N Meridian St | 0.32mi | 4/2.0 (+1) | 1,234 (-8%) | 3mo | $183,500 | $149 | 60 |
| 1237 Woodland Ave | 0.74mi | 3/2.0 | 1,417 (+5%) | 6mo | $229,750 | $162 | 48 |
| 1236 Woodland Ave | 0.75mi | 3/2.0 | 1,434 (+7%) | 4mo | $225,000 | $157 | 47 |
Match score weights: distance 35% · size 25% · config 20% · recency 20%. Top-matched comps best support the ARV.
Projected returns pro-forma
-3.0% appreciation · 3.0% rent growth · sell at horizon
- IRR
- 55.8%
- Equity multiple
- 3.46×
- Total profit
- $34,432
- Equity at exit
- $7,440
- IRR
- 60.8%
- Equity multiple
- 7.07×
- Total profit
- $84,785
- Equity at exit
- $4,314
Cash invested: $13,972 (down + closing). Projections, not guarantees.
Landlord ↔ Tenant lean methodology
- Overall (STATE)
- 90 Strongly Landlord-Friendly
- State Indiana
- 90 Strongly Landlord-Friendly · R+11
- County
- — inherits STATE
- City
- — inherits STATE
ZIP-level market 47170
- Home prices YoY
- -22.3%
- Active inventory
- 106
- Price-to-rent
- 3.2×
Monthly cashflow live
- Estimated rent
- $1,281 medium interval (Pro) →
- Mortgage (P&I)
- −$262
- Tax est. 1.5%
- −$62 /mo · $748/yr
- Insurance
- −$21
- HOA
- −$0
- Vacancy / Maint / Mgmt
- −$269
- Net cashflow
- $667
Break-even live
UW: 25.0% down · 7.5% · 30yr · 1.5% tax · 5.0% vac · 8.0% maint · 8.0% mgmt
Financing live
Cash to close
- Down payment
- $12,475
- Closing costs
- $1,497
- Reserves months
- —
- Total cash needed
- —
Loan-product check · same deal, 3 products live
Conventional
25% down · 7.5% · 30yr
- Down + closing
- —
- Monthly P&I
- —
- Monthly cashflow
- —
- DSCR
- —
- Eligible?
- —
Personal DTI + credit; lowest rate.
DSCR
20% down · 8.5% · 30yr
- Down + closing
- —
- Monthly P&I
- —
- Monthly cashflow
- —
- DSCR
- —
- Eligible?
- —
No personal income docs; deal must DSCR.
Hard money
10% down · 12.0% · 12mo
- Down + closing
- —
- Monthly P&I
- —
- Monthly cashflow
- —
- DSCR
- —
- Eligible?
- —
Short-term bridge; refi at stabilization.
Rent comps 2 comps
| Address | Beds | Baths | Sqft | Rent | $/sqft | DOM | Units | Dist |
|---|---|---|---|---|---|---|---|---|
| 432 N Meridian St Scottsburg, IN | 3.0 | 2.0 | 1300 | $1,200 | $0.92 | 43d | 1 | 0.23mi |
| 737 Ray St Scottsburg, IN | 3.0 | 1.0 | 989 | $1,475 | $1.49 | 43d | 1 | 0.42mi |
Listing history 19 events
-
2026-06-18days on market $49,900 Active 43 DOM
-
2026-06-17days on market $49,900 Active 42 DOM
-
2026-06-16days on market $49,900 Active 41 DOM
-
2026-06-15days on market $49,900 Active 40 DOM
-
2026-06-13days on market $49,900 Active 38 DOM
-
2026-06-12days on market $49,900 Active 37 DOM
-
2026-06-09days on market $49,900 Active 34 DOM
-
2026-06-08days on market $49,900 Active 33 DOM
-
2026-06-07days on market $49,900 Active 32 DOM
-
2026-06-07days on market $49,900 Active 31 DOM
-
2026-06-04days on market $49,900 Active 28 DOM
-
2026-06-02days on market $49,900 Active 27 DOM
-
2026-06-01days on market $49,900 Active 26 DOM
-
2026-05-31days on market $49,900 Active 25 DOM
-
2026-05-31days on market $49,900 Active 24 DOM
-
2026-05-14price $49,900 422-char remark
-
2026-05-05$59,900 Active 422-char remark
-
2012-12-17soldstatus $20,000 53-char remark
Show marketing remark (53 chars)
3 bedroom 1 bath home located convenient to downtown.
-
2012-07-20$29,900 53-char remark
Show marketing remark (53 chars)
3 bedroom 1 bath home located convenient to downtown.
ⓘ Source: listings_history table (triggers on properties + properties_extension) + one-shot
backfill from property_details.listing_events for pre-trigger history.
Climate risk First Street
- Flood 1/10 Low FEMA zone X (unshaded) · 0% chance over 30 yrs
- Wildfire 1/10 Low
- Heat 5/10 Major 7 d/yr ≥105°F today · 20 d/yr by 30 yrs out
- Wind 2/10 Low 100% chance of damaging wind over 30 yrs
- Air quality 2/10 Low 0 unhealthy d/yr today · 1 by 30 yrs out
Nearby sold comps map
Loading sold comps map…
Walkable amenities ~0.75 mi
Loading nearby amenities…
Taxation est. · year 1
- Rental income
- $15,374
- − Mortgage interest
- −$2,795
- − Property taxes
- −$748
- − Insurance
- −$250
- − Repairs & maintenance
- −$1,230
- − Management
- −$1,230
- − Depreciation
- −$1,452
- Taxable income
- $7,669
- Est. tax owed @ 24.0%
- −$1,841
- After-tax cash flow
- $6,167/yr
For passive investors: Depreciation is non-cash, so a rental often shows a tax loss while cash-flowing — sheltering income. Rental losses are passive: they offset passive income freely, and up to $25,000/yr can offset ordinary (W-2) income if you actively participate and your MAGI is under $100k (phasing out to $0 by $150k); unused losses carry forward. On sale, claimed depreciation is recaptured at up to 25%, and gains may owe capital-gains tax (a 1031 exchange can defer both). Figures are a year-1 estimate at your 24.0% rate — not tax advice; consult a CPA.
Schools (NCES district)
- District
- Scott County School District 2
- NCES district ID
- 1810020
- Math proficiency
- 33% ▼ -10.00%
- Reading proficiency
- 43% ▼ -6.00%
- Median HH income
- $45,529
- Composite
- 32.37/100
- National rank
- #5734
- State rank
- #166 of 301 in IN
Livability — Scottsburg
- Score
- 70/100
- State rank
- #152
- US rank
- #7609
Category grades
Schools grade is shown separately in the Schools card above.
Census & demographics
- Census place
- Scottsburg, IN
- Population (ZIP)
- 15,279
Population outlook (Scott County) Hauer SSP2
- Today (2025)
- 22,525 people
- By 2030
- 21,609 · -4.1%
- By 2040
- 19,536 · -13.3%
- By 2050
- 17,370 · -22.9%
- By 2075
- 12,862 · -42.9%
- By 2100
- 9,340 · -58.5%
Race, ethnicity, and origin ACS 2023
- Neighborhood character
- Predominantly White (92%)
- Race & ethnicity
- White 92% Two or more races 4% Hispanic / Latino 3%
- Common ancestry
- Slovak 2% Lithuanian 1% Italian 1%
- Foreign-born
- 1% · Canada
- Languages at home
- 97% English-only · Spanish 1% Other Indo-European 1%
Political lean MEDSL · Scott
- 2024 margin
- Solid R (+51.5) · D 23.4% · R 74.9% · Other 1.6%
- 2008→2024 swing
- -49.5pp toward R · 2008: -2.0pp · 2024: -51.5pp
- All cycles
- 2024: R+51.5 2020: R+45.6 2016: R+37.9 2012: R+6.2 2008: R+2.0
Not yet ingested
- Civics
- —
Market trends
- HPI YoY
- ▼ -64.30%
- Current HPI
- 223.9909
- Rent YoY
- —
- Metro
- —
- State GDP YoY
- ▲ 2.90%
- F500 in state
- 18
Industry mix (Fortune 500 HQ in IN)
| Industry | F500 HQs | Revenue |
|---|---|---|
| Industrial Machinery | 2 | $37B |
|
||
| Healthcare | 1 | $177B |
|
||
| Pharmaceuticals | 1 | $45B |
|
||
| Metals / Steel | 1 | $18B |
|
||
| Agriculture | 1 | $17B |
|
||
| Packaging | 1 | $12B |
|
||
Price history
+66.9% since first listed4 events — show timeline
- 2026-05-14 Price Changed $49,900 SIRA
- 2026-05-05 Listed $59,900 SIRA
- 2012-12-17 Sold (MLS) $20,000 SIRA
- 2012-07-20 Listed $29,900 SIRA
Property tax history
-24.7%/yrLatest (2024): $80 · +63.3% YoY. Source: county tax records.
Cash-flow waterfall
monthlySold comps — $/sqft
last 12 mo · ≤1 miLoading sold comps…