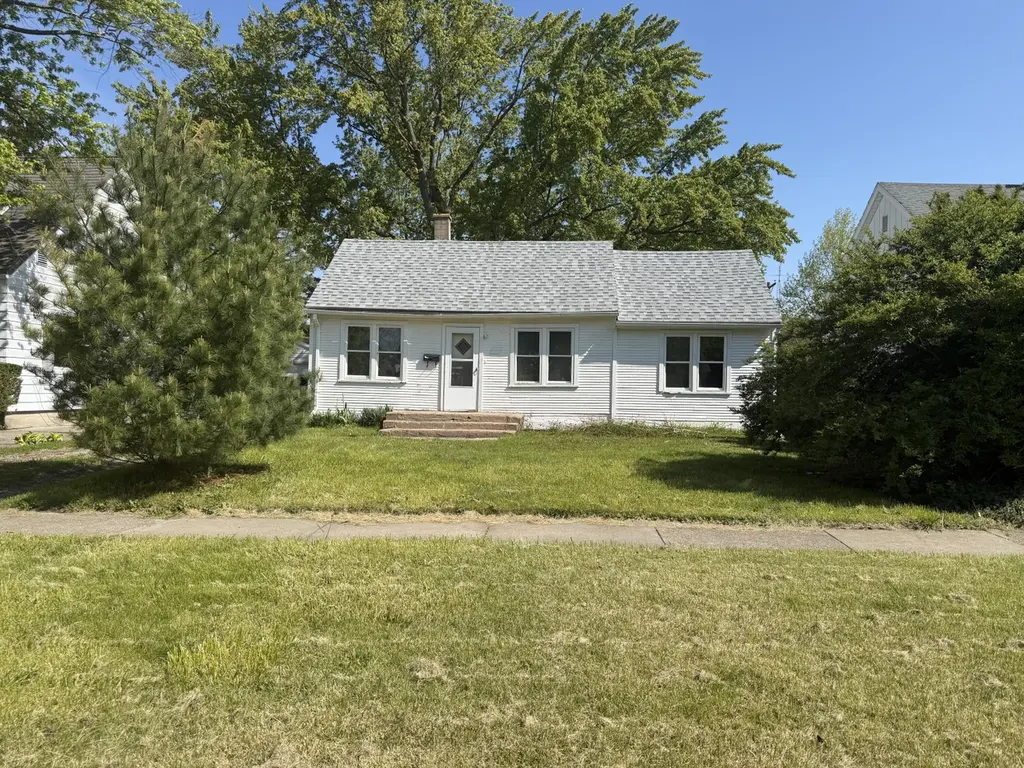
705 Columbia Ave · St. Joseph, MI
Flood risk 1/10 · Minimal
- FEMA flood zone
- X (unshaded)
- Chance of flooding over 30 yrs
- 0.0%
- Est. flood insurance / yr
- $473 – $860
Fire risk 1/10 · Minimal
- Est. fire insurance / yr
- $784 – $1,456
Heat risk 2/10 · Minimal
- Hot days now (above 100°F)
- 7 days/yr
- Hot days in 30 yrs
- 14 days/yr
Wind risk 2/10 · Minimal
- Chance of severe wind over 30 yrs
- —
Air-quality risk 5/10 · Moderate
- Unhealthy air days now
- 8 days/yr
- Unhealthy air days in 30 yrs
- 8 days/yr
Risk factors via First Street. Map © Google.
Why this score? — see what drove the B grade
The composite is a weighted blend of 9 inputs, each scored 0–100. Each bar is that input's sub-score; the figure is the points it added to the 100-point composite (weight × sub-score).
- Cash flow +30.0/30.0
- 1% rule +10.0/10.0
- DSCR +10.0/10.0
- ARV discount +7.5/15.0
- Schools +5.1/10.0
- Livability +2.5/5.0
- Condition / age +2.5/5.0
- Rent growth +2.4/5.0
- Appreciation +0.0/10.0
$95,000
🖨 Deal sheet 📄 Offer letter ✓ Due diligence
Listing remarks MLS
This fully gutted 2-bedroom, 1-bath home is located just minutes from downtown, Silver Beach, local restaurants, shopping, and Lake Michigan. With the interior already opened up, investors and rehabbers can move directly into planning and reconstruction. St. Joseph continues to attract strong demand from both local buyers and second-home purchasers thanks to its walkable downtown, waterfront lifestyle, and easy I-94 access. Nearby renovated homes support strong resale potential for buyers with the right vision and rehab plan. Two detached garages add additional flexibility for storage, workshop space, or additional value-add potential. Property is being sold as-is.
Key facts
- Easy i-94 access
- Waterfront lifestyle
- Detached garages
Tags
Property features AI
Exterior
- Parking: Detached garage; 3-car garage
- Utilities: Public water
- Home design: Ranch-style single-family home; Built in 1939; Single-story
- Construction: Wood siding; Shingle roof; Built in 1939
- Exterior features: Paved road access; Lot roughly 0.14 acres
Interior
- Bathrooms: 1 full bathroom
- Heating & cooling: Forced air heating
- Interior features: Partial basement; 2 total rooms
- Laundry & utility: Natural gas water heater
Neighborhood map
What this means for you Summary
Snapshot
- This is a 2-bed/1.0-bath single-family listed at $95k.
Deal economics
- At list price, monthly cash flow is $428 ($5k/yr) — positive.
- The deal already cash-flows at list — no discount required.
- Meets the 1% rule at list price ($2k rent vs $95k).
- Cap rate 11.7% vs local median 2.6% in St. Joseph — top-decile yield for the area; either an underpriced asset or a hidden risk that comps aren't pricing in. Stress-test before assuming the spread holds.
Location & tenants
- Location reads: area grade B — affects rentability + tenant quality, not the cash-flow math above.
- St. Joseph Public Schools (suburban): math 53% / reading 64% proficiency, ranked #47 of 540 in MI (top 9%) — acceptable for families but not a draw, mixed tenant base, ~2y average lease; only 18% free/reduced lunch — higher-income household profile.
- Market conditions: Rents soft (-0.2%/yr); 221 active listings in the ZIP; 1 comparable units currently listed for rent nearby; solid renter incomes; 397 units permitted in Berrien County in 2024 (40 in 5+ unit buildings).
Forward outlook
- Local home prices are declining (-3.0%/yr); year-one equity from $657 of loan paydown is wiped out by about $3k of value loss. Plan a longer hold.
- Berrien County population projected at -16% by 2050 — secular population decline; favor cash flow + early exit over multi-decade hold.
- At projected returns (-3.0% appreciation + 0.0% rent growth), your $27k cash investment doubles in ~9 years — after that, you're playing with house money.
Negotiation context
- Only 14 days on market — expect competitive offers; lowballing is unlikely to land.
- 14 sale attempts since 18y ago with the ask held roughly flat each time — persistent listings suggest the price (not the market) is what's stuck; bring a comps-based counter.
Risks & watch-outs
- Watch-outs: property tax is 4.4% of price; built in 1939 — expect roof / HVAC / electrical / plumbing capex.
Questions for the listing agent
- Built in 1939 — when were the roof, HVAC, electrical panel, plumbing, and water heater last replaced?
- Property tax is high relative to price — has the assessment been appealed recently, and will the sale trigger a re-assessment?
- Is there a deadline driving the sale (1031 exchange, divorce, estate, relocation)? That informs how much negotiation room exists.
- What's the average days-on-market for RENTAL listings here right now (not sales)? A rising rental-DOM trend means longer vacancies and softer asking-rent achievability than the comps imply.
- What's the recent tenant-quality profile in this submarket — average credit score on applications, eviction rate, late-payment / NSF rate, and stable-employment percentage? A property-management company in the area should have these aggregated.
- How much new for-sale + rental construction is in the pipeline within 1–3 miles? Heavy new supply typically softens prices + rents 12–24 months out; constrained supply supports both.
Investment metrics
- 1% rule
- 1.75% ✓
- Cap rate
- 11.69%
- Cash-on-cash
- 19.29%
- DSCR
- 1.86
- GRM
- 4.8
CMA / ARV
- ARV (median comp)
- $249,754
- List price
- $95,000
- Delta
- -61.96%
- Verdict
- UNDERPRICED
- Comps
- 20 within 1.0 mi
Show comp detail 12 sales within ~0.75 mi
| Address | Dist | Beds/Ba | Sqft | Sold | Price | $/sf | Match |
|---|---|---|---|---|---|---|---|
| 705 Columbia Ave | 0.00mi | 2/1.0 | 1,260 (0%) | 0mo | $98,000 | $78 | 100 |
| 2520 S State St | 0.22mi | 2/1.0 | 1,236 (-2%) | 13mo | $229,000 | $185 | 76 |
| 2516 S State St | 0.24mi | 3/1.0 (+1) | 1,202 (-5%) | 1mo | $315,000 | $262 | 76 |
| 2524 Morton Ave | 0.37mi | 3/1.5 (+1) | 1,200 (-5%) | 3mo | $275,000 | $229 | 65 |
| 2272 Washington Ave | 0.65mi | 2/2.0 | 1,280 (+2%) | 6mo | $260,000 | $203 | 58 |
| 2610 Willa Dr | 0.26mi | 2/1.0 | 1,085 (-14%) | 12mo | $275,000 | $253 | 55 |
| 312 S Veronica Ct | 0.46mi | 3/1.5 (+1) | 1,180 (-6%) | 10mo | $225,000 | $191 | 52 |
| 2301 Willa Dr | 0.50mi | 2/1.0 | 1,436 (+14%) | 2mo | $269,900 | $188 | 52 |
| 911 Botham Ave | 0.32mi | 3/1.0 (+1) | 1,091 (-13%) | 10mo | $250,000 | $229 | 50 |
| 1127 Orchard Ave | 0.70mi | 3/1.5 (+1) | 1,359 (+8%) | 2mo | $299,900 | $221 | 46 |
| 2215 S Cleveland Ave | 0.72mi | 3/1.0 (+1) | 1,360 (+8%) | 13mo | $245,000 | $180 | 38 |
| 536 La Salle Ave | 0.68mi | 3/2.0 (+1) | 1,402 (+11%) | 11mo | $299,000 | $213 | 31 |
Match score weights: distance 35% · size 25% · config 20% · recency 20%. Top-matched comps best support the ARV.
Projected returns pro-forma
-3.0% appreciation · 0.0% rent growth · sell at horizon
- IRR
- 7.2%
- Equity multiple
- 1.27×
- Total profit
- $7,144
- Equity at exit
- $14,165
- IRR
- 13.1%
- Equity multiple
- 1.87×
- Total profit
- $23,169
- Equity at exit
- $8,214
Cash invested: $26,600 (down + closing). Projections, not guarantees.
Landlord ↔ Tenant lean methodology
- Overall (STATE)
- 62 Landlord-Friendly
- State Michigan
- 62 Landlord-Friendly · EVEN
- County
- — inherits STATE
- City
- — inherits STATE
ZIP-level market 49085
- Rents YoY
- -0.2%
- Active inventory
- 221
- Price-to-rent
- 4.8×
Monthly cashflow live
- Estimated rent
- $1,659 medium interval (Pro) →
- Mortgage (P&I)
- −$498
- Tax from tax record
- −$345 /mo · $4,142/yr
- Insurance
- −$40
- HOA
- −$0
- Vacancy / Maint / Mgmt
- −$348
- Net cashflow
- $428
Break-even live
UW: 25.0% down · 7.5% · 30yr · 1.5% tax · 5.0% vac · 8.0% maint · 8.0% mgmt
Financing live
Cash to close
- Down payment
- $23,750
- Closing costs
- $2,850
- Reserves months
- —
- Total cash needed
- —
Loan-product check · same deal, 3 products live
Conventional
25% down · 7.5% · 30yr
- Down + closing
- —
- Monthly P&I
- —
- Monthly cashflow
- —
- DSCR
- —
- Eligible?
- —
Personal DTI + credit; lowest rate.
DSCR
20% down · 8.5% · 30yr
- Down + closing
- —
- Monthly P&I
- —
- Monthly cashflow
- —
- DSCR
- —
- Eligible?
- —
No personal income docs; deal must DSCR.
Hard money
10% down · 12.0% · 12mo
- Down + closing
- —
- Monthly P&I
- —
- Monthly cashflow
- —
- DSCR
- —
- Eligible?
- —
Short-term bridge; refi at stabilization.
Rent comps 1 comps
| Address | Beds | Baths | Sqft | Rent | $/sqft | DOM | Units | Dist |
|---|---|---|---|---|---|---|---|---|
| 535 Archer Ave Fl 2 St Joseph, MI | 1.0 | 1.0 | 908 | $1,450 | $1.60 | 44d | 1 | 0.78mi |
Listing history 37 events
-
2026-05-07$95,000 Active 673-char remark
Show marketing remark (673 chars)
This fully gutted 2-bedroom, 1-bath home is located just minutes from downtown, Silver Beach, local restaurants, shopping, and Lake Michigan. With the interior already opened up, investors and rehabbers can move directly into planning and reconstruction. St. Joseph continues to attract strong demand from both local buyers and second-home purchasers thanks to its walkable downtown, waterfront lifestyle, and easy I-94 access. Nearby renovated homes support strong resale potential for buyers with the right vision and rehab plan. Two detached garages add additional flexibility for storage, workshop space, or additional value-add potential. Property is being sold as-is.
-
2026-05-07$95,000 Active
Show marketing remark (673 chars)
This fully gutted 2-bedroom, 1-bath home is located just minutes from downtown, Silver Beach, local restaurants, shopping, and Lake Michigan. With the interior already opened up, investors and rehabbers can move directly into planning and reconstruction. St. Joseph continues to attract strong demand from both local buyers and second-home purchasers thanks to its walkable downtown, waterfront lifestyle, and easy I-94 access. Nearby renovated homes support strong resale potential for buyers with the right vision and rehab plan. Two detached garages add additional flexibility for storage, workshop space, or additional value-add potential. Property is being sold as-is.
-
2026-04-03historical
-
2026-04-03historical
-
2026-03-20$110,999 Active
-
2026-03-20$110,999 Active
-
2025-12-10historical
-
2025-12-10historical
-
2025-11-19price $97,999
-
2025-11-19price $97,999
-
2025-10-17price $105,999
-
2025-10-17price $105,999
-
2025-10-02$110,999 Active
-
2025-10-02$110,999 Active
-
2024-06-13soldstatus $75,000
-
2021-08-10soldstatus $93,000
-
2021-07-23soldstatus $93,000 Sold
-
2021-07-23soldstatus $93,000 Sold
-
2021-07-23soldstatus $93,000
-
2021-06-10historical Contingent - Continue To Show
-
2021-06-10historical Active Backup
-
2021-06-09price $100,000
-
2021-06-08price $100,000
-
2021-05-21price $108,790
-
2021-05-21price $108,790
-
2021-05-21status Active
-
2021-05-21status Active
-
2021-03-17historical
-
2021-03-17historical
-
2021-03-05$109,900 Active
-
2021-03-05$109,900 Active
-
2021-03-05$100,000
-
2015-03-02historical
-
2009-05-31historical
-
2008-12-24$100,000
-
2008-12-24$100,000
ⓘ Source: listings_history table (triggers on properties + properties_extension) + one-shot
backfill from property_details.listing_events for pre-trigger history.
Tax reassessment forecast MI · Partial reset (capped growth)
- Current annual tax
- $4,142 · $345/mo
- Projected year-2 tax
- $4,142 · $345/mo
- Expected delta
- $0/yr ($0/mo · 0.0%)
ⓘ Screening estimate from a state-policy table — verify with the county assessor before closing.
Climate risk First Street
- Flood 1/10 Low FEMA zone X (unshaded) · 0% chance over 30 yrs
- Wildfire 1/10 Low
- Heat 2/10 Low 7 d/yr ≥100°F today · 14 d/yr by 30 yrs out
- Wind 2/10 Low
- Air quality 5/10 Major 8 unhealthy d/yr today · 8 by 30 yrs out
Nearby sold comps map
Loading sold comps map…
Walkable amenities ~0.75 mi
Loading nearby amenities…
Taxation est. · year 1
- Rental income
- $19,908
- − Mortgage interest
- −$5,321
- − Property taxes
- −$4,142
- − Insurance
- −$475
- − Repairs & maintenance
- −$1,593
- − Management
- −$1,593
- − Depreciation
- −$2,764
- Taxable income
- $4,020
- Est. tax owed @ 24.0%
- −$965
- After-tax cash flow
- $4,167/yr
For passive investors: Depreciation is non-cash, so a rental often shows a tax loss while cash-flowing — sheltering income. Rental losses are passive: they offset passive income freely, and up to $25,000/yr can offset ordinary (W-2) income if you actively participate and your MAGI is under $100k (phasing out to $0 by $150k); unused losses carry forward. On sale, claimed depreciation is recaptured at up to 25%, and gains may owe capital-gains tax (a 1031 exchange can defer both). Figures are a year-1 estimate at your 24.0% rate — not tax advice; consult a CPA.
Schools (NCES district)
- District
- St. Joseph Public Schools
- NCES district ID
- 2632850
- Math proficiency
- 53% ▼ -12.00%
- Reading proficiency
- 64% ▼ -8.00%
- Median HH income
- $61,232
- Composite
- 50.87/100
- National rank
- #1795
- State rank
- #47 of 540 in MI
Livability — St. Joseph
No livability data for this city. (Only ~50 U.S. cities are tracked.)
Census & demographics
- Census place
- St. Joseph, MI
- County
- Berrien County · 71,477 people
- Metro
- Niles, MI
- Population (ZIP)
- 23,827
- Household income
- $104,969
- Rent vs Own
- Severe rent burden
- 277.0
Population outlook (Berrien County) Hauer SSP2
- Today (2025)
- 149,273 people
- By 2030
- 145,211 · -2.7%
- By 2040
- 135,435 · -9.3%
- By 2050
- 125,543 · -15.9%
- By 2075
- 103,986 · -30.3%
- By 2100
- 82,256 · -44.9%
Race, ethnicity, and origin ACS 2023
- Neighborhood character
- Predominantly White (85%)
- Race & ethnicity
- White 85% Two or more races 6% Asian 4% Hispanic / Latino 3% Black 3%
- Common ancestry
- Romanian 6% Iranian 4% Italian 4%
- Foreign-born
- 8% · Canada, China
- Languages at home
- 91% English-only · Other Indo-European 5% Spanish 1% Chinese 1%
Political lean MEDSL · Berrien
- 2024 margin
- Lean R (+7.9) · D 45.4% · R 53.2% · Other 1.4%
- 2008→2024 swing
- -13.3pp toward R · 2008: 5.5pp · 2024: -7.9pp
- All cycles
- 2024: R+7.9 2020: R+7.4 2016: R+12.7 2012: R+6.6 2008: D+5.5
Not yet ingested
- Civics
- —
Market trends
- HPI YoY
- ▼ -332.72%
- Current HPI
- 207.2281
- Rent YoY
- ▼ -0.24%
- Metro
- Niles, MI
- State GDP YoY
- ▲ 1.37%
- F500 in state
- 28
Industry mix (Fortune 500 HQ in MI)
| Industry | F500 HQs | Revenue |
|---|---|---|
| Automotive Parts | 3 | $48B |
|
||
| Automotive | 2 | $372B |
|
||
| Chemicals | 1 | $45B |
|
||
| Automotive Retail | 1 | $29B |
|
||
| Healthcare / Medical Devices | 1 | $23B |
|
||
| Automotive Technology | 1 | $20B |
|
||
Price history
-2.0% since first listed44 events — show timeline
- 2026-06-08 Sold (MLS) $98,000 REALCOMP
- 2026-06-08 Sold (MLS) $98,000 SW Michigan MLS
- 2026-06-08 Sold (MLS) $98,000 MiRealSource-MiMLS
- 2026-05-30 Listing Removed — MiRealSource-MiMLS
- 2026-05-23 Pending — REALCOMP
- 2026-05-22 Pending — MiRealSource-MiMLS
- 2026-05-22 Pending — SW Michigan MLS
- 2026-05-07 Listed $95,000 REALCOMP
- 2026-05-07 Listed $95,000 SW Michigan MLS
- 2026-05-07 Listed $95,000 MiRealSource-MiMLS
- 2026-04-03 Listing Removed — REALCOMP
- 2026-04-03 Listing Removed — MiRealSource-MiMLS
- 2026-03-20 Listed $110,999 REALCOMP
- 2026-03-20 Listed $110,999 MiRealSource-MiMLS
- 2025-12-10 Listing Removed — MiRealSource-MiMLS
- 2025-12-10 Listing Removed — REALCOMP
- 2025-11-19 Price Changed $97,999 MiRealSource-MiMLS
- 2025-11-19 Price Changed $97,999 REALCOMP
- 2025-10-17 Price Changed $105,999 MiRealSource-MiMLS
- 2025-10-17 Price Changed $105,999 REALCOMP
- 2025-10-02 Listed $110,999 MiRealSource-MiMLS
- 2025-10-02 Listed $110,999 REALCOMP
- 2024-06-13 Sold (Public Records) $75,000 Public Records
- 2021-08-10 Sold (Public Records) $93,000 Public Records
- 2021-07-23 Sold (MLS) $93,000 MiRealSource-MiMLS
- 2021-07-23 Sold (MLS) $93,000 SW Michigan MLS
- 2021-07-23 Sold (MLS) $93,000 REALCOMP
- 2021-06-10 Contingent — REALCOMP
- 2021-06-10 Contingent — SW Michigan MLS
- 2021-06-09 Price Changed $100,000 REALCOMP
- 2021-06-08 Price Changed $100,000 SW Michigan MLS
- 2021-05-21 Price Changed $108,790 REALCOMP
- 2021-05-21 Price Changed $108,790 SW Michigan MLS
- 2021-05-21 Relisted — REALCOMP
- 2021-05-21 Relisted — SW Michigan MLS
- 2021-03-17 Listing Removed — REALCOMP
- 2021-03-17 Listing Removed — SW Michigan MLS
- 2021-03-05 Listed $100,000 MiRealSource-MiMLS
- 2021-03-05 Listed $109,900 SW Michigan MLS
- 2021-03-05 Listed $109,900 REALCOMP
- 2015-03-02 Listing Removed — SW Michigan MLS
- 2009-05-31 Listing Removed — REALCOMP
- 2008-12-24 Listed $100,000 REALCOMP
- 2008-12-24 Listed $100,000 SW Michigan MLS
Property tax history
+17.4%/yrLatest (2024): $4,142 · +4.4% YoY. Source: county tax records.
Cash-flow waterfall
monthlySold comps — $/sqft
last 12 mo · ≤1 miLoading sold comps…