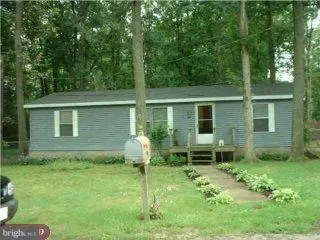
7501 Magnolia Dr · Commercial, NJ
Flood risk 3/10 · Minor
- FEMA flood zone
- X (unshaded)
- Chance of flooding over 30 yrs
- 0.2%
- Est. flood insurance / yr
- $507 – $1,088
Fire risk 3/10 · Minor
- Est. fire insurance / yr
- $526 – $976
Heat risk 7/10 · Major
- Hot days now (above 102°F)
- 7 days/yr
- Hot days in 30 yrs
- 15 days/yr
Wind risk 8/10 · Major
- Chance of severe wind over 30 yrs
- 80.0%
Air-quality risk 3/10 · Minor
- Unhealthy air days now
- 3 days/yr
- Unhealthy air days in 30 yrs
- 5 days/yr
Risk factors via First Street. Map © Google.
Why this score? — see what drove the D grade
The composite is a weighted blend of 9 inputs, each scored 0–100. Each bar is that input's sub-score; the figure is the points it added to the 100-point composite (weight × sub-score).
- Cash flow +14.8/30.0
- ARV discount +9.0/15.0
- DSCR +4.5/10.0
- 1% rule +4.3/10.0
- Rent growth +3.0/5.0
- Livability +2.5/5.0
- Condition / age +2.5/5.0
- Schools +1.5/10.0
- Appreciation +0.0/10.0
$200,000
🖨 Deal sheet (PDF) 📄 Offer letter ✓ Due diligence
Listing remarks MLS
Will have more information soon
Key facts
- 0.23 acre lot
- Built 1995
- Listed 158 days
Neighborhood map
What this means for you Summary
Snapshot
- This is a 3-bed/2.0-bath single-family listed at $200k.
Deal economics
- At list price, monthly cash flow is $54 ($651/yr) — positive.
- The deal already cash-flows at list — no discount required.
- To meet the 1% rule (rent ≥ 1% of price), the offer needs to be $187k (6.7% below list).
- Recommended offer: $176k (12.0% below list) — sets the bar for market timing.
Location & tenants
- Location reads: area grade D — affects rentability + tenant quality, not the cash-flow math above.
- Commercial Township School District (rural): math 5% / reading 29% proficiency, ranked #449 of 472 in NJ (top 95%) — low school quality limits family demand, transient renter base, plan for 1-2y turnover; 65% free/reduced lunch — lower-income household profile, screen leases tightly.
- Zoned schools: Commercial Township School (math 5% / reading 29%, grade F, #1,081 of 1,303 statewide, top 84%, 470 students, 67% FRL) — zoned schools at 67% FRL track the district average.
- Market conditions: Rents rising (+1.9%/yr); 297 active listings in the ZIP; 1 comparable units currently listed for rent nearby; 216 units permitted in Cumberland County in 2024 (73 in 5+ unit buildings).
- This rent runs 33% of the median local income ($67k/yr) — at the standard rent-burdened threshold; future hikes will face affordability resistance.
Forward outlook
- Local home prices are declining (-3.0%/yr); year-one equity from $1k of loan paydown is wiped out by about $6k of value loss. Plan a longer hold.
- Cumberland County population projected to shrink 7% by 2050 — rents likely to lag national; underwrite the cash flow, not the appreciation.
Negotiation context
- It's been on market 158 days — a 12% lower offer ($176k) is reasonable based on typical stale-listing flexibility.
- 3 sale attempts since 23y ago with the ask held roughly flat each time — persistent listings suggest the price (not the market) is what's stuck; bring a comps-based counter.
- Current owner paid $68k; list at $200k implies a 194% gain — meaningful room to come down on a strong offer.
Risks & watch-outs
- Climate carrying-cost: severe wind risk, 80% chance of damaging wind over 30y; extreme-heat days projected 7→15/yr by 2055 (HVAC capex compounding) — expect insurance premiums to compound above CPI over the hold.
Questions for the listing agent
- It's been on market 158 days. Have you received any prior offers? Is the seller open to a 12% concession, seller financing, or rate buy-down credit?
- Why hasn't it sold? Are there any deal-killer items the seller is aware of (foundation, flood, title, zoning, code violations)?
- Is there a deadline driving the sale (1031 exchange, divorce, estate, relocation)? That informs how much negotiation room exists.
- The area grade is low — what's the realistic commute time and amenity access for the typical tenant pool here? Any planned neighborhood developments (good or bad) we should know about?
- What's the average days-on-market for RENTAL listings here right now (not sales)? A rising rental-DOM trend means longer vacancies and softer asking-rent achievability than the comps imply.
- What's the recent tenant-quality profile in this submarket — average credit score on applications, eviction rate, late-payment / NSF rate, and stable-employment percentage? A property-management company in the area should have these aggregated.
- How much new for-sale + rental construction is in the pipeline within 1–3 miles? Heavy new supply typically softens prices + rents 12–24 months out; constrained supply supports both.
Investment metrics
- 1% rule
- 0.93% ✗
- Cap rate
- 6.62%
- Cash-on-cash
- 1.16%
- DSCR
- 1.05
- GRM
- 8.9
CMA / ARV
- ARV (median comp)
- $206,782
- List price
- $200,000
- Delta
- -3.28%
- Verdict
- FAIR
- Comps
- 20 within 1.0 mi
Show comp detail 12 sales within ~0.75 mi
| Address | Dist | Beds/Ba | Sqft | Sold | Price | $/sf | Match |
|---|---|---|---|---|---|---|---|
| 7210 Dove Pl | 0.37mi | 3/1.0 | 988 (+2%) | 1mo | $123,000 | $124 | 74 |
| 115 Robin Rd | 0.36mi | 3/2.0 | 960 (-1%) | 11mo | $177,000 | $184 | 73 |
| 7500 Whittier Dr | 0.11mi | 3/1.0 | 924 (-4%) | 17mo | $46,000 | $50 | 69 |
| 405 Gooseberry Rd | 0.17mi | 3/2.0 | 1,040 (+7%) | 16mo | $280,000 | $269 | 66 |
| 12 Pleasantview Dr | 0.38mi | 3/1.0 | 907 (-6%) | 2mo | $236,000 | $260 | 66 |
| 420 Doe Pl | 0.21mi | 3/1.0 | 1,056 (+9%) | 7mo | $225,000 | $213 | 65 |
| 7178 Keron Dr | 0.51mi | 2/1.0 (-1) | 980 (+1%) | 3mo | $170,000 | $173 | 63 |
| 232 Jute Rd | 0.52mi | 3/2.0 | 952 (-2%) | 13mo | $187,500 | $197 | 62 |
| 428 Quail Rd | 0.34mi | 2/1.5 (-1) | 942 (-3%) | 14mo | $215,000 | $228 | 61 |
| 421 Evergreen Rd | 0.20mi | 2/1.0 (-1) | 1,040 (+7%) | 13mo | $200,000 | $192 | 58 |
| 510 Mistle Rd | 0.32mi | 3/2.0 | 1,064 (+10%) | 14mo | $66,000 | $62 | 57 |
| 7737 Raymond Dr | 0.71mi | 3/1.0 | 896 (-7%) | 7mo | $191,999 | $214 | 44 |
Match score weights: distance 35% · size 25% · config 20% · recency 20%. Top-matched comps best support the ARV.
Projected returns pro-forma
-3.0% appreciation · 1.94% rent growth · sell at horizon
- IRR
- -15.6%
- Equity multiple
- 0.45×
- Total profit
- $-30,871
- Equity at exit
- $29,821
- IRR
- -9.1%
- Equity multiple
- 0.46×
- Total profit
- $-30,134
- Equity at exit
- $17,292
Cash invested: $56,000 (down + closing). Projections, not guarantees.
Landlord ↔ Tenant lean methodology
- Overall (STATE)
- 21 Tenant-Leaning
- State New Jersey
- 21 Tenant-Leaning · D+6
- County
- — inherits STATE
- City
- — inherits STATE
ZIP-level market 08332
- Home prices YoY
- -28.9%
- Rents YoY
- 1.9%
- Active inventory
- 297
- Price-to-rent
- 8.9×
Monthly cashflow live
- Estimated rent
- $1,866 medium interval (Pro) →
- Mortgage (P&I)
- −$1,049
- Tax from tax record
- −$288 /mo · $3,454/yr
- Insurance
- −$83
- HOA
- −$0
- Vacancy / Maint / Mgmt
- −$392
- Net cashflow
- $54
Break-even live
Sensitivity live
| Price | -10% $167 | -5% $111 | +0% $54 | +5% $-2 | +10% $-59 |
|---|---|---|---|---|---|
| Rent | -10% $-93 | -5% $-19 | +0% $54 | +5% $128 | +10% $202 |
| Rate | -1.0pp $155 | -0.5pp $105 | base $54 | +0.5pp $2 | +1.0pp $-50 |
UW: 25.0% down · 7.5% · 30yr · 1.5% tax · 5.0% vac · 8.0% maint · 8.0% mgmt
Financing live
Cash to close
- Down payment
- $50,000
- Closing costs
- $6,000
- Reserves months
- —
- Total cash needed
- —
Loan-product check · same deal, 3 products live
Conventional
25% down · 7.5% · 30yr
- Down + closing
- —
- Monthly P&I
- —
- Monthly cashflow
- —
- DSCR
- —
- Eligible?
- —
Personal DTI + credit; lowest rate.
DSCR
20% down · 8.5% · 30yr
- Down + closing
- —
- Monthly P&I
- —
- Monthly cashflow
- —
- DSCR
- —
- Eligible?
- —
No personal income docs; deal must DSCR.
Hard money
10% down · 12.0% · 12mo
- Down + closing
- —
- Monthly P&I
- —
- Monthly cashflow
- —
- DSCR
- —
- Eligible?
- —
Short-term bridge; refi at stabilization.
Rent comps 1 comps
| Address | Beds | Baths | Sqft | Rent | $/sqft | DOM | Units | Dist |
|---|---|---|---|---|---|---|---|---|
| 7357 William Ave Millville, NJ | 2.0 | 1.0 | 938 | $1,550 | $1.65 | 45d | 1 | 0.64mi |
Listing history 24 events
-
2026-06-22days on market $200,000 Active 158 DOM
-
2026-06-19days on market $200,000 Active 156 DOM
-
2026-06-18days on market $200,000 Active 155 DOM
-
2026-06-17days on market $200,000 Active 154 DOM
-
2026-06-16days on market $200,000 Active 153 DOM
-
2026-06-15days on market $200,000 Active 152 DOM
-
2026-06-14days on market $200,000 Active 150 DOM
-
2026-06-13days on market $200,000 Active 149 DOM
-
2026-06-10days on market $200,000 Active 147 DOM
-
2026-06-09days on market $200,000 Active 146 DOM
-
2026-06-08days on market $200,000 Active 145 DOM
-
2026-06-07days on market $200,000 Active 144 DOM
-
2026-06-02days on market $200,000 Active 139 DOM
-
2026-06-01days on market $200,000 Active 138 DOM
-
2026-05-31days on market $200,000 Active 137 DOM
-
2026-05-30days on market $200,000 Active 136 DOM
-
2026-01-14$200,000 Active 31-char remark
Show marketing remark (31 chars)
Will have more information soon
-
2003-11-19soldstatus $68,000
-
2003-11-18soldstatus $68,000 183-char remark
Show marketing remark (183 chars)
This home is ready for a family to call their own. Home has fenced in yard, ceiling fans, washer and a dryer. Call today to see the home and start the process of owning your own home.
-
2003-11-18soldstatus $68,000
Show marketing remark (183 chars)
This home is ready for a family to call their own. Home has fenced in yard, ceiling fans, washer and a dryer. Call today to see the home and start the process of owning your own home.
-
2003-10-15historical 183-char remark
Show marketing remark (183 chars)
This home is ready for a family to call their own. Home has fenced in yard, ceiling fans, washer and a dryer. Call today to see the home and start the process of owning your own home.
-
2003-10-15historical
Show marketing remark (183 chars)
This home is ready for a family to call their own. Home has fenced in yard, ceiling fans, washer and a dryer. Call today to see the home and start the process of owning your own home.
-
2003-09-03$68,000 183-char remark
Show marketing remark (183 chars)
This home is ready for a family to call their own. Home has fenced in yard, ceiling fans, washer and a dryer. Call today to see the home and start the process of owning your own home.
-
2003-09-03$69,900
Show marketing remark (183 chars)
This home is ready for a family to call their own. Home has fenced in yard, ceiling fans, washer and a dryer. Call today to see the home and start the process of owning your own home.
ⓘ Source: listings_history table (triggers on properties + properties_extension) + one-shot
backfill from property_details.listing_events for pre-trigger history.
Tax reassessment forecast NJ · Partial reset (capped growth)
- Current annual tax
- $3,454 · $288/mo
- Projected year-2 tax
- $4,217 · $351/mo
- Expected delta
- +$763/yr (+$64/mo · 22.1%)
ⓘ Screening estimate from a state-policy table — verify with the county assessor before closing.
Climate risk First Street
- Flood 3/10 Moderate FEMA zone X (unshaded) · 20% chance over 30 yrs
- Wildfire 3/10 Moderate
- Heat 7/10 Severe 7 d/yr ≥102°F today · 15 d/yr by 30 yrs out
- Wind 8/10 Severe 80% chance of damaging wind over 30 yrs
- Air quality 3/10 Moderate 3 unhealthy d/yr today · 5 by 30 yrs out
Nearby sold comps map
Loading sold comps map…
Walkable amenities ~0.75 mi
Loading nearby amenities…
Taxation est. · year 1
- Rental income
- $22,394
- − Mortgage interest
- −$11,203
- − Property taxes
- −$3,454
- − Insurance
- −$1,000
- − Repairs & maintenance
- −$1,792
- − Management
- −$1,792
- − Depreciation
- −$5,818
- Taxable loss
- −$2,665
- Est. tax savings @ 24.0%
- +$639
- After-tax cash flow
- $1,291/yr
For passive investors: Depreciation is non-cash, so a rental often shows a tax loss while cash-flowing — sheltering income. Rental losses are passive: they offset passive income freely, and up to $25,000/yr can offset ordinary (W-2) income if you actively participate and your MAGI is under $100k (phasing out to $0 by $150k); unused losses carry forward. On sale, claimed depreciation is recaptured at up to 25%, and gains may owe capital-gains tax (a 1031 exchange can defer both). Figures are a year-1 estimate at your 24.0% rate — not tax advice; consult a CPA.
Schools (NCES district)
- District
- Commercial Township School District
- NCES district ID
- 3403480
- Math proficiency
- 5% ▼ -7.00%
- Reading proficiency
- 29% ▲ 10.00%
- Median HH income
- $45,143
- Composite
- 14.86/100
- National rank
- #9378
- State rank
- #449 of 472 in NJ
Livability — Commercial
No livability data for this city. (Only ~50 U.S. cities are tracked.)
Census & demographics
- Census place
- Laurel Lake, NJ
- County
- Cumberland County · 80,266 people
- Metro
- Vineland-Bridgeton, NJ
- Population (ZIP)
- 35,228
- Household income
- $67,496
- Rent vs Own
- Severe rent burden
- 1761.0
Population outlook (Cumberland County) Hauer SSP2
- Today (2025)
- 152,743 people
- By 2030
- 150,373 · -1.6%
- By 2040
- 146,881 · -3.8%
- By 2050
- 142,653 · -6.6%
- By 2075
- 129,468 · -15.2%
- By 2100
- 107,456 · -29.6%
Race, ethnicity, and origin ACS 2023
- Neighborhood character
- Diverse neighborhood (Simpson 0.60)
- Race & ethnicity
- White 59% Hispanic / Latino 17% Black 15% Two or more races 11% Asian 2%
- Hispanic origin (detail)
- Mexican 4% Puerto Rican 10%
- Common ancestry
- Romanian 4% Lithuanian 2% Slovak 1%
- Foreign-born
- 7% · Canada
- Languages at home
- 85% English-only · Spanish 11% Other Indo-European 1% Other Asian/Pacific 1%
Political lean MEDSL · Cumberland
- 2024 margin
- Toss-up / Even · D 47.6% · R 51.3% · Other 1.1%
- 2008→2024 swing
- -25.4pp toward R · 2008: 21.6pp · 2024: -3.8pp
- All cycles
- 2024: R+3.8 2020: D+6.0 2016: D+5.3 2012: D+23.1 2008: D+21.6
Not yet ingested
- Civics
- —
Market trends
- HPI YoY
- ▼ -111.45%
- Current HPI
- 274.8011
- Rent YoY
- ▲ 1.94%
- Metro
- Vineland-Bridgeton, NJ
- State GDP YoY
- ▲ 2.05%
- F500 in state
- 34
Industry mix (Fortune 500 HQ in NJ)
| Industry | F500 HQs | Revenue |
|---|---|---|
| Consumer Goods | 3 | $31B |
|
||
| Pharmaceuticals | 2 | $153B |
|
||
| Technology | 2 | $21B |
|
||
| Insurance | 2 | $20B |
|
||
| Healthcare | 2 | $19B |
|
||
| Financial Services | 1 | $70B |
|
||
Price history
+194.1% since first listed8 events — show timeline
- 2026-01-14 Listed $200,000 ForSaleByOwner.com
- 2003-11-19 Sold (Public Records) $68,000 Public Records
- 2003-11-18 Sold (MLS) $68,000 SJSRMLS
- 2003-11-18 Sold (MLS) $68,000 BRIGHT MLS
- 2003-10-15 Listing Removed — SJSRMLS
- 2003-10-15 Listing Removed — BRIGHT MLS
- 2003-09-03 Listed $69,900 SJSRMLS
- 2003-09-03 Listed $68,000 BRIGHT MLS
Property tax history
+3.8%/yrLatest (2025): $3,454 · +4.9% YoY. Source: county tax records.
Cash-flow waterfall
monthlySold comps — $/sqft
last 12 mo · ≤1 miLoading sold comps…