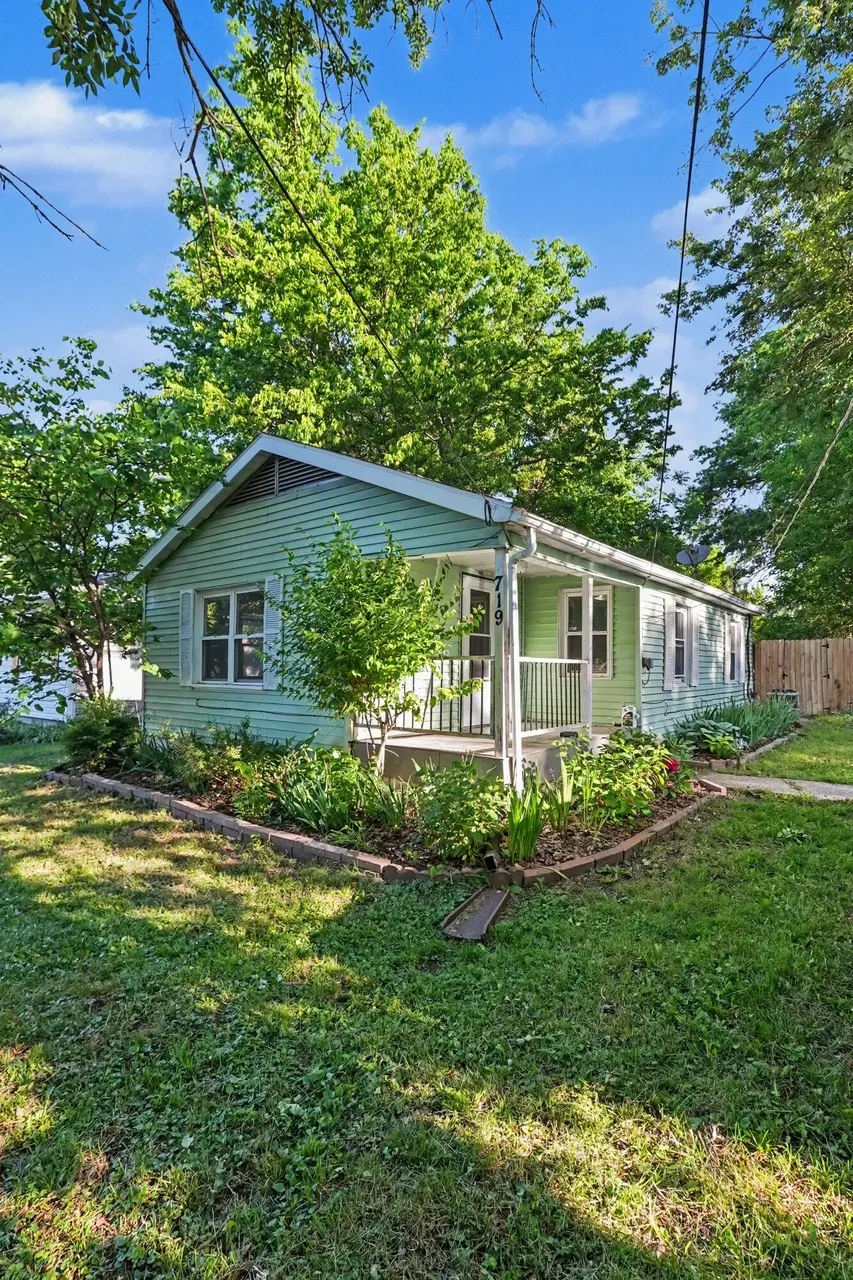
719 Mikel St · Columbia, MO
Flood risk 1/10 · Minimal
- FEMA flood zone
- X (unshaded)
- Chance of flooding over 30 yrs
- 0.0%
- Est. flood insurance / yr
- $473 – $860
Fire risk 1/10 · Minimal
- Est. fire insurance / yr
- $1,054 – $1,958
Heat risk 4/10 · Minor
- Hot days now (above 108°F)
- 7 days/yr
- Hot days in 30 yrs
- 19 days/yr
Wind risk 2/10 · Minimal
- Chance of severe wind over 30 yrs
- —
Air-quality risk 1/10 · Minimal
- Unhealthy air days now
- 0 days/yr
- Unhealthy air days in 30 yrs
- 0 days/yr
Risk factors via First Street. Map © Google.
Why this score? — see what drove the D+ grade
The composite is a weighted blend of 9 inputs, each scored 0–100. Each bar is that input's sub-score; the figure is the points it added to the 100-point composite (weight × sub-score).
- Cash flow +14.7/30.0
- ARV discount +11.9/15.0
- DSCR +4.5/10.0
- Livability +4.2/5.0
- Rent growth +4.0/5.0
- Schools +3.1/10.0
- 1% rule +3.0/10.0
- Condition / age +2.5/5.0
- Appreciation +0.0/10.0
$155,000
🖨 Deal sheet (PDF) 📄 Offer letter ✓ Due diligence
Listing remarks MLS
Cute house in a central location. Easy access to downtown and campus. Plenty of updates, including ceramic tile, newer appliances. An oversized back yard with a privacy fence offers endless possibilities.
Key facts
- Large garden
- Large back yard
- Newer hvac system
Tags
Property features AI
Exterior
- Parking: No garage
- Utilities: Public water; Cable available
- Home design: Residential single-family home; Faces south
- Construction: Block foundation
- Exterior features: Covered patio/deck; Deck; Front porch; Chain link and wood fencing; Partially wooded lot; Paved road access
Interior
- Kitchen: Refrigerator; Microwave; Gas range
- Flooring: Wood flooring; Tile flooring; Vinyl flooring
- Bathrooms: 1 full bathroom
- Heating & cooling: Natural gas forced air heating; Central air conditioning
- Interior features: Eat-in kitchen; Crawl space basement
Neighborhood map
What this means for you Summary
Snapshot
- This is a 2-bed/1.0-bath single-family listed at $155k.
Deal economics
- At list price, monthly cash flow is $40 ($482/yr) — positive.
- The deal already cash-flows at list — no discount required.
- To meet the 1% rule (rent ≥ 1% of price), the offer needs to be $124k (19.8% below list).
- Recommended offer: $124k (19.8% below list) — sets the bar for 1% rule.
- Cap rate 6.6% vs local median 2.9% in Columbia — top-decile yield for the area; either an underpriced asset or a hidden risk that comps aren't pricing in. Stress-test before assuming the spread holds.
Location & tenants
- Location reads 83/100 on livability (#9 in MO, #862 nationally) — a professional / high-income tenant draw. Strengths: amenities A+, commute A+, cost of living A+; Watch: crime D+.
- Columbia 93 (urban): math 30% / reading 43% proficiency, ranked #194 of 324 in MO (top 60%) — families likely to look elsewhere, expect single-tenant / working-renter base with shorter leases.
- Zoned schools: West Blvd. Elem. (math 17% / reading 32%, grade F, #879 of 1,115 statewide, top 81%, 337 students, 99% FRL); West Middle School (math 22% / reading 36%, grade F, #300 of 391 statewide, top 77%, 504 students, 58% FRL); David H. Hickman High (math 27% / reading 55%, grade F, #236 of 521 statewide, top 45%, 2,044 students, 33% FRL) — zoned schools average 63% FRL vs 35% district-wide (28 pts higher); higher-poverty schools than district average — tighter screening recommended.
- Market conditions: Rents rising fast (+6.1%/yr); 459 active listings in the ZIP; 22 comparable units currently listed for rent nearby; rentals at typical pace (median 23d on market — plan ~3-4 weeks tenant-placement turnaround); 41% of comp listings sitting > 30 days — soft ceiling on asking rent; solid renter incomes; 1,303 units permitted in Boone County in 2024 (549 in 5+ unit buildings).
Forward outlook
- Local home prices are declining (-3.0%/yr); year-one equity from $1k of loan paydown is wiped out by about $5k of value loss. Plan a longer hold.
- Boone County population projected at +36% by 2050 — long-run rental-demand tailwind backs the buy-and-hold thesis.
Negotiation context
- Only 10 days on market — expect competitive offers; lowballing is unlikely to land.
- 3 sale attempts since 8y ago with the ask held roughly flat each time — persistent listings suggest the price (not the market) is what's stuck; bring a comps-based counter.
Risks & watch-outs
- Watch-outs: built in 1945 — expect roof / HVAC / electrical / plumbing capex.
Questions for the listing agent
- Built in 1945 — when were the roof, HVAC, electrical panel, plumbing, and water heater last replaced?
- Is there a deadline driving the sale (1031 exchange, divorce, estate, relocation)? That informs how much negotiation room exists.
- Schools are B-rated — typically a magnet for longer-tenancy family renters. What's the average tenant stay here, and is there a school-zone premium baked into asking?
- Crime grade is D in this area — have there been break-ins, vandalism, or insurance claims at this property in the last 3 years? What carrier currently insures it and at what premium?
- The area grade is low — what's the realistic commute time and amenity access for the typical tenant pool here? Any planned neighborhood developments (good or bad) we should know about?
- What's the average days-on-market for RENTAL listings here right now (not sales)? A rising rental-DOM trend means longer vacancies and softer asking-rent achievability than the comps imply.
- What's the recent tenant-quality profile in this submarket — average credit score on applications, eviction rate, late-payment / NSF rate, and stable-employment percentage? A property-management company in the area should have these aggregated.
- How much new for-sale + rental construction is in the pipeline within 1–3 miles? Heavy new supply typically softens prices + rents 12–24 months out; constrained supply supports both.
Investment metrics
- 1% rule
- 0.80% ✗
- Cap rate
- 6.60%
- Cash-on-cash
- 1.11%
- DSCR
- 1.05
- GRM
- 10.4
CMA / ARV
- ARV (on-the-fly)
- $171,900
- Comps found
- 12
Show comp detail 12 sales within ~0.75 mi
| Address | Dist | Beds/Ba | Sqft | Sold | Price | $/sf | Match |
|---|---|---|---|---|---|---|---|
| 719 Mikel St | 0.00mi | 2/1.0 | 764 (0%) | 0mo | $155,000 | $203 | 100 |
| 800 Ridgeway Ave | 0.09mi | 2/1.0 | 813 (+6%) | 1mo | $178,000 | $219 | 84 |
| 607 Ridgeway Ave | 0.16mi | 2/1.0 | 728 (-5%) | 7mo | $175,000 | $240 | 79 |
| 708 Donnelly Ave | 0.15mi | 2/1.0 | 840 (+10%) | 1mo | $232,000 | $276 | 75 |
| 605 Donnelly Ave | 0.16mi | 2/1.0 | 840 (+10%) | 1mo | $215,000 | $256 | 75 |
| 605 Jackson St | 0.18mi | 3/1.0 (+1) | 800 (+5%) | 6mo | $180,000 | $225 | 74 |
| 704 Hardin St | 0.17mi | 2/1.0 | 840 (+10%) | 7mo | $239,000 | $285 | 70 |
| 407 Auburn Ln | 0.57mi | 2/1.0 | 754 (-1%) | 8mo | $137,000 | $182 | 64 |
| 1304 W Worley St | 0.57mi | 2/1.0 | 728 (-5%) | 5mo | $160,000 | $220 | 61 |
| 402 N West Blvd | 0.36mi | 2/1.0 | 850 (+11%) | 6mo | $200,000 | $235 | 59 |
| 807 Hope Pl | 0.44mi | 2/1.0 | 868 (+14%) | 2mo | $189,000 | $218 | 55 |
| 603 Pennant St | 0.60mi | 2/1.0 | 844 (+10%) | 8mo | $159,000 | $188 | 48 |
Match score weights: distance 35% · size 25% · config 20% · recency 20%. Top-matched comps best support the ARV.
Projected returns pro-forma
-3.0% appreciation · 6.09% rent growth · sell at horizon
- IRR
- -11.5%
- Equity multiple
- 0.57×
- Total profit
- $-18,634
- Equity at exit
- $23,111
- IRR
- 1.2%
- Equity multiple
- 1.10×
- Total profit
- $4,247
- Equity at exit
- $13,402
Cash invested: $43,400 (down + closing). Projections, not guarantees.
Landlord ↔ Tenant lean methodology
- Overall (STATE)
- 81 Strongly Landlord-Friendly
- State Missouri
- 81 Strongly Landlord-Friendly · R+10
- County
- — inherits STATE
- City
- — inherits STATE
ZIP-level market 65203
- Rents YoY
- 6.1%
- Active inventory
- 459
- Price-to-rent
- 10.4×
Monthly cashflow live
- Estimated rent
- $1,243 high interval (Pro) →
- Mortgage (P&I)
- −$813
- Tax from tax record
- −$65 /mo · $775/yr
- Insurance
- −$65
- HOA
- −$0
- Vacancy / Maint / Mgmt
- −$261
- Net cashflow
- $40
Break-even live
Sensitivity live
| Price | -10% $128 | -5% $84 | +0% $40 | +5% $-4 | +10% $-48 |
|---|---|---|---|---|---|
| Rent | -10% $-58 | -5% $-9 | +0% $40 | +5% $89 | +10% $138 |
| Rate | -1.0pp $118 | -0.5pp $80 | base $40 | +0.5pp $0 | +1.0pp $-41 |
UW: 25.0% down · 7.5% · 30yr · 1.5% tax · 5.0% vac · 8.0% maint · 8.0% mgmt
Financing live
Cash to close
- Down payment
- $38,750
- Closing costs
- $4,650
- Reserves months
- —
- Total cash needed
- —
Loan-product check · same deal, 3 products live
Conventional
25% down · 7.5% · 30yr
- Down + closing
- —
- Monthly P&I
- —
- Monthly cashflow
- —
- DSCR
- —
- Eligible?
- —
Personal DTI + credit; lowest rate.
DSCR
20% down · 8.5% · 30yr
- Down + closing
- —
- Monthly P&I
- —
- Monthly cashflow
- —
- DSCR
- —
- Eligible?
- —
No personal income docs; deal must DSCR.
Hard money
10% down · 12.0% · 12mo
- Down + closing
- —
- Monthly P&I
- —
- Monthly cashflow
- —
- DSCR
- —
- Eligible?
- —
Short-term bridge; refi at stabilization.
Rent comps 22 comps
| Address | Beds | Baths | Sqft | Rent | $/sqft | DOM | Units | Dist |
|---|---|---|---|---|---|---|---|---|
| 607 Ridgeway Ave Columbia, MO | 2.0 | 1.0 | 728 | $1,300 | $1.79 | 45d | 1 | 0.17mi |
| 1003 Hardin St Columbia, MO | 2.0 | 1.0 | 950 | $1,100 | $1.16 | 45d | 1 | 0.19mi |
| 812 Again St Columbia, MO | 2.0 | 1.0 | 780 | $1,300 | $1.67 | 46d | 1 | 0.36mi |
| 1502 Parkade Blvd Unit 2 Columbia, MO | 2.0 | 1.0 | 700 | $950 | $1.36 | 45d | 1 | 0.45mi |
| 924 W Texas Ave Unit B Columbia, MO | 2.0 | 1.0 | 662 | $750 | $1.13 | 15d | 1 | 0.48mi |
| 309 Alexander Ave Columbia, MO | 2.0 | 1.0 | 728 | $1,200 | $1.65 | 15d | 1 | 0.51mi |
| 1600 Parkside Dr Columbia, MO | 2.0 | 1.0 | 885 | $950 | $1.07 | 45d | 1 | 0.55mi |
| 1311 W Worley St Columbia, MO | 3.0 | 1.0 | 944 | $1,500 | $1.59 | 23d | 1 | 0.61mi |
| 105 Clinton Dr Columbia, MO | 2.0 | 1.0 | 830 | $1,300 | $1.57 | 23d | 1 | 0.69mi |
| 1002 W Broadway Columbia, MO | 2.0 | 1.0 | 788 | $1,425 | $1.81 | 45d | 1 | 0.81mi |
| 5 S Greenwood Ave Columbia, MO | 2.0 | 1.0 | 1104 | $1,600 | $1.45 | 23d | 1 | 0.82mi |
| 113 Crestmere Ave Unit 201 Columbia, MO | 2.0 | 1.0 | 1022 | $1,750 | $1.71 | 45d | 1 | 0.95mi |
| 305 Tiger Ln Columbia, MO | 1.0–2.0 | 1.0 | 615 | $1,120 | $1.82 | 15d | 13 | 1.26mi |
| 2012 W Ash St Columbia, MO | 1.0–2.0 | 1.0 | 680 | $1,115 | $1.64 | 15d | 15 | 1.28mi |
| 100 E Stewart Rd Unit 3 Columbia, MO | 1.0 | 1.0 | 750 | $835 | $1.11 | 15d | 1 | 1.32mi |
| 109 E Stewart Rd Columbia, MO | 2.0–3.0 | 1.0 | 750 | $950 | $1.27 | 45d | 3 | 1.32mi |
| 109 E Stewart Rd Apt A Columbia, MO | 2.0 | 1.0 | 1000 | $1,500 | $1.50 | 23d | 1 | 1.32mi |
| 109 E Stewart Rd Unit C Columbia, MO | 2.0 | 1.0 | 750 | $1,200 | $1.60 | 23d | 1 | 1.32mi |
| 1007 E Broadway Columbia, MO | 1.0 | 1.0 | 600 | $1,639 | $2.73 | 23d | 1 | 1.40mi |
| 111 N Stadium Blvd Columbia, MO | 1.0–2.0 | 1.0 | 628 | $875 | $1.39 | 15d | 11 | 1.48mi |
| 20 Blue Ridge Rd Unit 202 Columbia, MO | 2.0 | 2.0 | 1100 | $1,500 | $1.36 | 23d | 1 | 1.49mi |
| 1110 E Broadway Unit B Columbia, MO | 1.0 | 1.0 | 1015 | $1,350 | $1.33 | 45d | 1 | 1.49mi |
Listing history 6 events
-
2026-05-16$155,000 Active
-
2021-03-16soldstatus
-
2021-03-15soldstatus 204-char remark
Show marketing remark (204 chars)
Cute house in a central location. Easy access to downtown and campus. Plenty of updates, including ceramic tile, newer appliances. An oversized back yard with a privacy fence offers endless possibilities.
-
2021-01-28$94,900 204-char remark
Show marketing remark (204 chars)
Cute house in a central location. Easy access to downtown and campus. Plenty of updates, including ceramic tile, newer appliances. An oversized back yard with a privacy fence offers endless possibilities.
-
2018-04-26soldstatus 212-char remark
Show marketing remark (212 chars)
SOLD AS IS. Buyer's agent is required to pay $150 offer management fee at closing of any accepted offer. Seller requires 10 days in MLS before responding to any offers. Need prequel letter or POF with any offers.
-
2018-03-07$54,900 212-char remark
Show marketing remark (212 chars)
SOLD AS IS. Buyer's agent is required to pay $150 offer management fee at closing of any accepted offer. Seller requires 10 days in MLS before responding to any offers. Need prequel letter or POF with any offers.
ⓘ Source: listings_history table (triggers on properties + properties_extension) + one-shot
backfill from property_details.listing_events for pre-trigger history.
Tax reassessment forecast MO · Resets to sale price
- Current annual tax
- $775 · $65/mo
- Projected year-2 tax
- $1,504 · $125/mo
- Expected delta
- +$728/yr (+$61/mo · 94.0%)
ⓘ Screening estimate from a state-policy table — verify with the county assessor before closing.
Climate risk First Street
- Flood 1/10 Low FEMA zone X (unshaded) · 0% chance over 30 yrs
- Wildfire 1/10 Low
- Heat 4/10 Moderate 7 d/yr ≥108°F today · 19 d/yr by 30 yrs out
- Wind 2/10 Low
- Air quality 1/10 Low 0 unhealthy d/yr today · 0 by 30 yrs out
Nearby sold comps map
Loading sold comps map…
Walkable amenities ~0.75 mi
Loading nearby amenities…
Taxation est. · year 1
- Rental income
- $14,919
- − Mortgage interest
- −$8,682
- − Property taxes
- −$775
- − Insurance
- −$775
- − Repairs & maintenance
- −$1,194
- − Management
- −$1,194
- − Depreciation
- −$4,509
- Taxable loss
- −$2,209
- Est. tax savings @ 24.0%
- +$530
- After-tax cash flow
- $1,012/yr
For passive investors: Depreciation is non-cash, so a rental often shows a tax loss while cash-flowing — sheltering income. Rental losses are passive: they offset passive income freely, and up to $25,000/yr can offset ordinary (W-2) income if you actively participate and your MAGI is under $100k (phasing out to $0 by $150k); unused losses carry forward. On sale, claimed depreciation is recaptured at up to 25%, and gains may owe capital-gains tax (a 1031 exchange can defer both). Figures are a year-1 estimate at your 24.0% rate — not tax advice; consult a CPA.
Schools (NCES district)
- District
- Columbia 93
- NCES district ID
- 2901000
- Math proficiency
- 30% ▼ -12.00%
- Reading proficiency
- 43% ▼ -4.00%
- Median HH income
- $46,547
- Composite
- 31.21/100
- National rank
- #6036
- State rank
- #194 of 324 in MO
Livability — Columbia
- Score
- 83/100
- State rank
- #9
- US rank
- #862
Category grades
Schools grade is shown separately in the Schools card above.
Census & demographics
- Census place
- Columbia, MO
- County
- Boone County · 158,877 people
- City population
- 158,877
- Metro
- Columbia, MO
- Population (ZIP)
- 61,539
- Household income
- $79,960
- Rent vs Own
- Severe rent burden
- 1991.0
Population outlook (Boone County) Hauer SSP2
- Today (2025)
- 202,891 people
- By 2030
- 217,799 · +7.3%
- By 2040
- 246,789 · +21.6%
- By 2050
- 276,116 · +36.1%
- By 2075
- 348,426 · +71.7%
- By 2100
- 400,856 · +97.6%
Race, ethnicity, and origin ACS 2023
- Neighborhood character
- Predominantly White (77%)
- Race & ethnicity
- White 77% Black 9% Asian 6% Two or more races 5% Hispanic / Latino 3%
- Common ancestry
- Italian 3% Slovak 2% Romanian 2%
- Foreign-born
- 7% · China, South Korea, Canada
- Languages at home
- 91% English-only · Chinese 2% Spanish 2% Korean 1%
Political lean MEDSL · Boone
- 2024 margin
- Lean D (+9.8) · D 53.9% · R 44.1% · Other 2.1%
- 2008→2024 swing
- -2.2pp toward R · 2008: 12.0pp · 2024: 9.8pp
- All cycles
- 2024: D+9.8 2020: D+12.5 2016: D+5.9 2012: D+3.1 2008: D+12.0
Not yet ingested
- Civics
- —
Market trends
- HPI YoY
- ▼ -274.18%
- Current HPI
- 194.3615
- Rent YoY
- ▲ 6.09%
- Metro
- Columbia, MO
- State GDP YoY
- ▲ 1.84%
- F500 in state
- 20
Industry mix (Fortune 500 HQ in MO)
| Industry | F500 HQs | Revenue |
|---|---|---|
| Healthcare | 1 | $163B |
|
||
| Insurance | 1 | $21B |
|
||
| Industrial Technology | 1 | $17B |
|
||
| Retail | 1 | $16B |
|
||
| Industrial Distribution | 1 | $10B |
|
||
| Utilities | 1 | $9B |
|
||
Price history
+182.3% since first listed6 events — show timeline
- 2026-05-16 Listed $155,000 CBORMLS
- 2021-03-16 Sold (Public Records) — Public Records
- 2021-03-15 Sold (MLS) — CBORMLS
- 2021-01-28 Listed $94,900 CBORMLS
- 2018-04-26 Sold (MLS) — CBORMLS
- 2018-03-07 Listed $54,900 CBORMLS
Property tax history
+3.1%/yrLatest (2025): $775 · +11.2% YoY. Source: county tax records.
Cash-flow waterfall
monthlySold comps — $/sqft
last 12 mo · ≤1 miLoading sold comps…