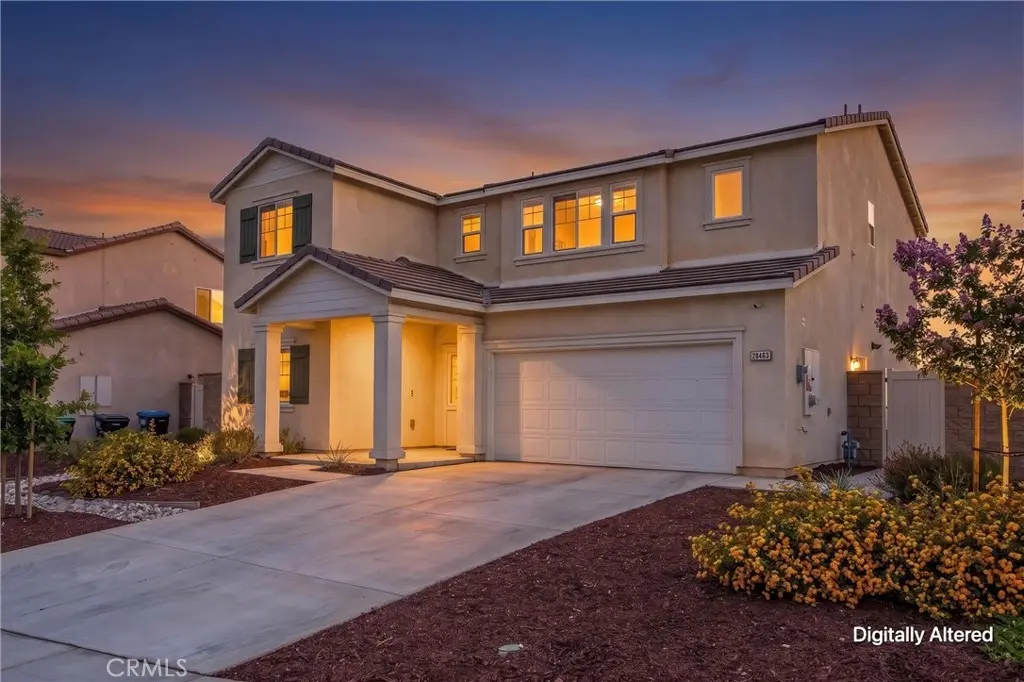
28463 Memory Ln · Winchester, CA
Flood risk 1/10 · Minimal
- FEMA flood zone
- X (unshaded)
- Chance of flooding over 30 yrs
- 0.0%
- Est. flood insurance / yr
- $507 – $1,088
Fire risk 8/10 · Major
- Est. fire insurance / yr
- $659 – $1,223
Heat risk 8/10 · Major
- Hot days now (above 105°F)
- 7 days/yr
- Hot days in 30 yrs
- 21 days/yr
Wind risk 1/10 · Minimal
- Chance of severe wind over 30 yrs
- —
Air-quality risk 6/10 · Moderate
- Unhealthy air days now
- 10 days/yr
- Unhealthy air days in 30 yrs
- 14 days/yr
Risk factors via First Street. Map © Google.
Why this score? — see what drove the D grade
The composite is a weighted blend of 9 inputs, each scored 0–100. Each bar is that input's sub-score; the figure is the points it added to the 100-point composite (weight × sub-score).
- Appreciation +10.0/10.0
- ARV discount +7.9/15.0
- Cash flow +7.8/30.0
- 1% rule +2.6/10.0
- Livability +2.6/5.0
- Schools +2.5/10.0
- Condition / age +2.5/5.0
- Rent growth +2.3/5.0
- DSCR +1.9/10.0
$615,999
🖨 Deal sheet (PDF) 📄 Offer letter ✓ Due diligence
Listing remarks MLS
Welcome to NEW CONSTRUCTION at Pleasant Valley Ranch in Winchester! This beautiful Plan 2239 two-story home features a Hacienda façade with a DOWNSTAIRS bedroom and full bathroom. Upstairs, 3 bedrooms, 2 full bathrooms, a LARGE loft area and laundry room with EXTRA STORAGE room. The Island Kitchen includes Whirlpool stainless steel gas cooktop and oven, microwave, dishwasher, QUARTZ counter tops with White shaker-styled cabinetry and Rexford DESIGNER luxury vinyl plank and carpet flooring throughout. Also, a direct access 2-car garage PRE-PLUMBED for an electric car! This truly modern home has all the SmartHome features you would expect and, is FULLY LANDSCAPED AND IRRIGATED in the front yard. Pleasant Valley Ranch is situated close to neighborhood parks, shopping and freeway access. We anticipate a December 2022 move-in. .. Welcome Home!
Key facts
- 8,712 sq ft lot
- 2 garage spots
- Built 2022
Property features AI
Finance
- Other: Parcel number 462190009; Living area and lot size per assessor data; Lot roughly 6,500–9,999 sq ft (lot size from assessor)
- Financial info: Subject to special assessments
Exterior
- Parking: Attached garage; 2 garage spaces; 2 total parking spaces
- Utilities: Public sewer; District/Public water
- Home design: House; Two-story; No attached accessory dwelling unit
- Construction: Year built per assessor
- Exterior features: No pool; Sidewalks
Interior
- Kitchen: Refrigerator; Gas range; Gas oven; Dishwasher
- Bedrooms: One main-level bedroom
- Bathrooms: Three full bathrooms; One main-level bathroom
- Heating & cooling: Central furnace heating; Central cooling
- Interior features: Two levels; Front entry; Entry at main level; Bonus room; Loft; Has view
- Laundry & utility: Washer included; Has laundry
Neighborhood map
What this means for you Summary
Snapshot
- This is a 4-bed/3.0-bath single-family listed at $616k.
Deal economics
- At list price, monthly cash flow is $-686 ($-8k/yr) — negative.
- To cash-flow at today's rent, offer at most $495k (19.7% below list).
- To meet the 1% rule (rent ≥ 1% of price), the offer needs to be $467k (24.1% below list).
- Recommended offer: $467k (24.1% below list) — sets the bar for 1% rule.
- Cap rate 5.0% vs local median 3.7% in Winchester — top-decile yield for the area; either an underpriced asset or a hidden risk that comps aren't pricing in. Stress-test before assuming the spread holds.
Location & tenants
- Location reads 52/100 on livability (#992 in CA) — a working-class tenant base; expect higher turnover. Strengths: crime B; Watch: amenities F, commute F, cost of living F.
- Hemet Unified (suburban): math 19% / reading 41% proficiency, ranked #360 of 517 in CA (top 70%) — families likely to look elsewhere, expect single-tenant / working-renter base with shorter leases; 66% free/reduced lunch — lower-income household profile, screen leases tightly.
- Zoned schools: Winchester Elementary (683 students, 79% FRL); Rancho Viejo Middle (math 24% / reading 24%, grade F, #277 of 498 statewide, top 73%, 975 students, 88% FRL); Tahquitz High (math 14% / reading 42%, grade F, #777 of 1,170 statewide, top 67%, 1,727 students, 88% FRL) — zoned schools average 85% FRL vs 66% district-wide (19 pts higher); higher-poverty schools than district average — tighter screening recommended.
- Market conditions: Rents soft (-0.8%/yr); 353 active listings in the ZIP; 21 comparable units currently listed for rent nearby; rentals at typical pace (median 17d on market — plan ~3-4 weeks tenant-placement turnaround); high-income renter base; 9,195 units permitted in Riverside County in 2024 (1,512 in 5+ unit buildings).
- This rent runs 42% of the median local income ($133k/yr) — at the standard rent-burdened threshold; future hikes will face affordability resistance.
Forward outlook
- In year one you build about $66k of equity ($4k loan paydown + $62k appreciation (10.0% local appreciation)).
- Riverside County population projected at +22% by 2050 — long-run rental-demand tailwind backs the buy-and-hold thesis.
- By year 2, paydown + projected appreciation supports a ~$106k cash-out refi (75% LTV) — recoverable capital for the next deal without selling this one.
Negotiation context
- Only 13 days on market — expect competitive offers; lowballing is unlikely to land.
Risks & watch-outs
- Climate carrying-cost: severe wildfire risk; extreme-heat days projected 7→21/yr by 2055 (HVAC capex compounding) — expect insurance premiums to compound above CPI over the hold.
Questions for the listing agent
- What do current leases actually rent for vs. the listed asking? Can we see a recent rent roll and the last 12 months of T-12 income?
- Is there a deadline driving the sale (1031 exchange, divorce, estate, relocation)? That informs how much negotiation room exists.
- Schools are D-rated, which usually means shorter tenancies and higher turnover. Who's the typical renter profile here, and what's been the actual vacancy rate?
- The area grade is low — what's the realistic commute time and amenity access for the typical tenant pool here? Any planned neighborhood developments (good or bad) we should know about?
- What's the average days-on-market for RENTAL listings here right now (not sales)? A rising rental-DOM trend means longer vacancies and softer asking-rent achievability than the comps imply.
- What's the recent tenant-quality profile in this submarket — average credit score on applications, eviction rate, late-payment / NSF rate, and stable-employment percentage? A property-management company in the area should have these aggregated.
- How much new for-sale + rental construction is in the pipeline within 1–3 miles? Heavy new supply typically softens prices + rents 12–24 months out; constrained supply supports both.
Investment metrics
- 1% rule
- 0.76% ✗
- Cap rate
- 4.96%
- Cash-on-cash
- -4.77%
- DSCR
- 0.79
- GRM
- 11.0
CMA / ARV
- ARV (on-the-fly)
- $621,333
- Comps found
- 12
Show comp detail 12 sales within ~0.75 mi
| Address | Dist | Beds/Ba | Sqft | Sold | Price | $/sf | Match |
|---|---|---|---|---|---|---|---|
| 28410 Pinon Ct | 0.09mi | 4/3.0 | 2,227 (0%) | 0mo | $634,000 | $285 | 95 |
| 28480 Cosmos Dr | 0.10mi | 4/3.0 | 2,227 (0%) | 2mo | $615,999 | $277 | 94 |
| 30641 Via Del Cielo | 0.64mi | 4/3.0 | 2,259 (+1%) | 0mo | $652,990 | $289 | 67 |
| 30612 Corte Hermoso | 0.68mi | 4/3.0 | 2,259 (+1%) | 1mo | $632,260 | $280 | 65 |
| 30538 Via Del Cielo | 0.69mi | 4/3.0 | 2,259 (+1%) | 1mo | $622,990 | $276 | 65 |
| 30563 Via Del Cielo | 0.70mi | 4/3.0 | 2,259 (+1%) | 1mo | $627,590 | $278 | 64 |
| 30577 Corte Hermoso | 0.72mi | 4/3.0 | 2,259 (+1%) | 2mo | $629,990 | $279 | 62 |
| 30605 Via Del Cielo | 0.66mi | 5/3.0 (+1) | 2,311 (+4%) | 0mo | $639,990 | $277 | 58 |
| 30613 Corte Hermoso | 0.70mi | 5/3.0 (+1) | 2,311 (+4%) | 1mo | $649,990 | $281 | 55 |
| 30645 Camino Del Sur | 0.72mi | 5/3.0 (+1) | 2,311 (+4%) | 2mo | $645,000 | $279 | 54 |
| 30574 Via Del Cielo | 0.67mi | 5/3.0 (+1) | 2,537 (+14%) | 1mo | $689,990 | $272 | 40 |
| 30588 Corte Hermoso | 0.69mi | 5/3.0 (+1) | 2,537 (+14%) | 2mo | $674,990 | $266 | 38 |
Match score weights: distance 35% · size 25% · config 20% · recency 20%. Top-matched comps best support the ARV.
Projected returns pro-forma
10.0% appreciation · 0.0% rent growth · sell at horizon
- IRR
- 20.0%
- Equity multiple
- 2.61×
- Total profit
- $278,263
- Equity at exit
- $554,941
- IRR
- 17.7%
- Equity multiple
- 5.81×
- Total profit
- $829,550
- Equity at exit
- $1,196,751
Cash invested: $172,480 (down + closing). Projections, not guarantees.
Landlord ↔ Tenant lean methodology
- Overall (STATE)
- 18 Strongly Tenant-Friendly
- State California
- 18 Strongly Tenant-Friendly · D+13
- County
- — inherits STATE
- City
- — inherits STATE
ZIP-level market 92596
- Home prices YoY
- 3.9%
- Rents YoY
- -0.8%
- Active inventory
- 353
- Price-to-rent
- 11.0×
Monthly cashflow live
- Estimated rent
- $4,673 high interval (Pro) →
- Mortgage (P&I)
- −$3,230
- Tax from tax record
- −$891 /mo · $10,688/yr
- Insurance
- −$257
- HOA
- −$0
- Vacancy / Maint / Mgmt
- −$981
- Net cashflow
- $-686
Break-even live
Sensitivity live
| Price | -10% $-337 | -5% $-511 | +0% $-686 | +5% $-860 | +10% $-1,034 |
|---|---|---|---|---|---|
| Rent | -10% $-1,055 | -5% $-870 | +0% $-686 | +5% $-501 | +10% $-317 |
| Rate | -1.0pp $-376 | -0.5pp $-529 | base $-686 | +0.5pp $-845 | +1.0pp $-1,008 |
UW: 25.0% down · 7.5% · 30yr · 1.5% tax · 5.0% vac · 8.0% maint · 8.0% mgmt
Financing live
Cash to close
- Down payment
- $154,000
- Closing costs
- $18,480
- Reserves months
- —
- Total cash needed
- —
Loan-product check · same deal, 3 products live
Conventional
25% down · 7.5% · 30yr
- Down + closing
- —
- Monthly P&I
- —
- Monthly cashflow
- —
- DSCR
- —
- Eligible?
- —
Personal DTI + credit; lowest rate.
DSCR
20% down · 8.5% · 30yr
- Down + closing
- —
- Monthly P&I
- —
- Monthly cashflow
- —
- DSCR
- —
- Eligible?
- —
No personal income docs; deal must DSCR.
Hard money
10% down · 12.0% · 12mo
- Down + closing
- —
- Monthly P&I
- —
- Monthly cashflow
- —
- DSCR
- —
- Eligible?
- —
Short-term bridge; refi at stabilization.
Rent comps 21 comps
| Address | Beds | Baths | Sqft | Rent | $/sqft | DOM | Units | Dist |
|---|---|---|---|---|---|---|---|---|
| 31097 Linden Flower Rd Winchester, CA | 4.0 | 3.5 | 2617 | $7,500 | $2.87 | 0d | 1 | 0.05mi |
| 30540 Altima Ct Winchester, CA | 5.0 | 3.0 | 1873 | $3,300 | $1.76 | 16d | 1 | 0.30mi |
| 30547 Operetta St Winchester, CA | 3.0 | 2.5 | 1567 | $3,100 | $1.98 | 20d | 1 | 0.37mi |
| 30816 Viper Ct Winchester, CA | 3.0 | 2.5 | 1583 | $3,249 | $2.05 | 6d | 1 | 0.38mi |
| 28635 Matador Rd Winchester, CA | 4.0 | 2.5 | 1775 | $3,395 | $1.91 | 0d | 1 | 0.43mi |
| 28872 Camino Santiago Unit MAIN HOME Winchester, CA | 4.0 | 3.0 | 2446 | $3,595 | $1.47 | 12d | 1 | 0.74mi |
| 29449 White Ash Ct Winchester, CA | 3.0 | 2.5 | 1532 | $3,379 | $2.21 | 16d | 1 | 1.12mi |
| 29429 Cumaru Ct Winchester, CA | 4.0 | 2.5 | 1699 | $3,349 | $1.97 | 0d | 1 | 1.16mi |
| 29424 Cumaru Ct Winchester, CA | 4.0 | 2.5 | 1771 | $3,459 | $1.95 | 22d | 1 | 1.16mi |
| 29430 Cumaru Ct Winchester, CA | 4.0 | 2.5 | 1699 | $3,379 | $1.99 | 0d | 1 | 1.17mi |
| 29471 Granadillo Ct Winchester, CA | 4.0 | 2.5 | 1699 | $3,349 | $1.97 | 22d | 1 | 1.18mi |
| 29502 Marx Way Menifee, CA | 3.0 | 2.5 | 1469 | $3,150 | $2.14 | 0d | 1 | 1.18mi |
| 29472 Granadillo Ct Winchester, CA | 4.0 | 2.5 | 1699 | $3,349 | $1.97 | 22d | 1 | 1.18mi |
| 29467 Monterey Pine Ct Winchester, CA | 4.0 | 2.5 | 1771 | $3,429 | $1.94 | 22d | 1 | 1.18mi |
| 29474 Monterey Pine Ct Winchester, CA | 4.0 | 2.5 | 1699 | $3,349 | $1.97 | 9d | 1 | 1.20mi |
| 29475 Jack Pine Ct Winchester, CA | 4.0 | 2.5 | 1699 | $3,269 | $1.92 | 45d | 1 | 1.20mi |
| 29505 Bovenzi Way Winchester, CA | 4.0 | 2.0 | 1754 | $3,100 | $1.77 | 16d | 1 | 1.22mi |
| 29587 Winterstorm Ct Winchester, CA | 3.0 | 2.5 | 2054 | $3,195 | $1.56 | 13d | 1 | 1.26mi |
| 32333 Wild West Ct Winchester, CA | 3.0 | 2.0 | 1751 | $2,950 | $1.68 | 45d | 1 | 1.44mi |
| 29335 Adams St Winchester, CA | 4.0 | 3.0 | 2419 | $3,500 | $1.45 | 45d | 1 | 1.44mi |
| 29555 Copper Hill Ct Winchester, CA | 4.0 | 2.5 | 1823 | $3,195 | $1.75 | 3d | 1 | 1.50mi |
Listing history 9 events
-
2026-06-21days on market $615,999 Active 13 DOM
-
2026-06-18days on market $615,999 Active 10 DOM
-
2026-06-17days on market $615,999 Active 9 DOM
-
2026-06-16days on market $615,999 Active 8 DOM
-
2026-06-15days on market $615,999 Active 7 DOM
-
2026-06-13days on market $615,999 Active 5 DOM
-
2026-06-08statusdays on market $615,999 Active 1 DOM
-
2026-06-07remarks 699-char remark
-
2026-06-07$615,999 Coming Soon 3 DOM
ⓘ Source: listings_history table (triggers on properties + properties_extension) + one-shot
backfill from property_details.listing_events for pre-trigger history.
Tax reassessment forecast CA · Resets to sale price
- Current annual tax
- $10,688 · $891/mo
- Projected year-2 tax
- $10,688 · $891/mo
- Expected delta
- $0/yr ($0/mo · 0.0%)
ⓘ Screening estimate from a state-policy table — verify with the county assessor before closing.
Climate risk First Street
- Flood 1/10 Low FEMA zone X (unshaded) · 0% chance over 30 yrs
- Wildfire 8/10 Severe
- Heat 8/10 Severe 7 d/yr ≥105°F today · 21 d/yr by 30 yrs out
- Wind 1/10 Low
- Air quality 6/10 Major 10 unhealthy d/yr today · 14 by 30 yrs out
Nearby sold comps map
Loading sold comps map…
Walkable amenities ~0.75 mi
Loading nearby amenities…
Taxation est. · year 1
- Rental income
- $56,080
- − Mortgage interest
- −$34,506
- − Property taxes
- −$10,688
- − Insurance
- −$3,080
- − Repairs & maintenance
- −$4,486
- − Management
- −$4,486
- − Depreciation
- −$17,920
- Taxable loss
- −$19,086
- Est. tax savings @ 24.0%
- +$4,581
- After-tax cash flow
- $-3,648/yr
For passive investors: Depreciation is non-cash, so a rental often shows a tax loss while cash-flowing — sheltering income. Rental losses are passive: they offset passive income freely, and up to $25,000/yr can offset ordinary (W-2) income if you actively participate and your MAGI is under $100k (phasing out to $0 by $150k); unused losses carry forward. On sale, claimed depreciation is recaptured at up to 25%, and gains may owe capital-gains tax (a 1031 exchange can defer both). Figures are a year-1 estimate at your 24.0% rate — not tax advice; consult a CPA.
Schools (NCES district)
- District
- Hemet Unified
- NCES district ID
- 0616920
- Math proficiency
- 19% ▼ -3.00%
- Reading proficiency
- 41% ▲ 4.00%
- Median HH income
- $39,962
- Composite
- 25.16/100
- National rank
- #7517
- State rank
- #360 of 517 in CA
Livability — Winchester
- Score
- 52/100
- State rank
- #992
- US rank
- #24750
Category grades
Schools grade is shown separately in the Schools card above.
Census & demographics
- Census place
- Winchester, CA
- County
- Riverside County · 2,287,001 people
- City population
- 111,667
- Metro
- Riverside-San Bernardino-Ontario, CA
- Population (ZIP)
- 38,981
- Household income
- $132,538
- Rent vs Own
- Severe rent burden
- 591.0
Population outlook (Riverside County) Hauer SSP2
- Today (2025)
- 2,664,475 people
- By 2030
- 2,802,692 · +5.2%
- By 2040
- 3,050,904 · +14.5%
- By 2050
- 3,256,783 · +22.2%
- By 2075
- 3,655,058 · +37.2%
- By 2100
- 3,766,594 · +41.4%
Race, ethnicity, and origin ACS 2023
- Neighborhood character
- Highly diverse neighborhood (Simpson 0.72)
- Race & ethnicity
- White 38% Hispanic / Latino 34% Two or more races 16% Asian 12% Black 6% Pacific Islander 2%
- Hispanic origin (detail)
- Mexican 29%
- Common ancestry
- Slovak 3% Italian 2% Portuguese 1%
- Foreign-born
- 14% · Canada, Vietnam
- Languages at home
- 76% English-only · Spanish 16% Tagalog/Filipino 4% Vietnamese 1%
Political lean MEDSL · Riverside
- 2024 margin
- Toss-up / Even · D 48.0% · R 49.3% · Other 2.6%
- 2008→2024 swing
- -3.6pp toward R · 2008: 2.3pp · 2024: -1.3pp
- All cycles
- 2024: R+1.3 2020: D+8.0 2016: D+4.3 2012: R+0.4 2008: D+2.3
Not yet ingested
- Civics
- —
Market trends
- HPI YoY
- ▲ 12.43%
- Current HPI
- 332.169
- Rent YoY
- ▼ -0.79%
- Metro
- Riverside-San Bernardino-Ontario, CA
- State GDP YoY
- ▲ 3.21%
- F500 in state
- 116
Industry mix (Fortune 500 HQ in CA)
| Industry | F500 HQs | Revenue |
|---|---|---|
| Technology | 27 | $1,492B |
|
||
| Financial Services | 3 | $174B |
|
||
| Retail | 3 | $44B |
|
||
| Insurance | 3 | $26B |
|
||
| Media / Entertainment | 2 | $115B |
|
||
| Pharmaceuticals / Biotech | 2 | $62B |
|
||
Price history
-8.7% since first listed8 events — show timeline
- 2026-06-04 Coming Soon $615,999 CRMLS
- 2022-12-21 Sold (MLS) $564,315 CRMLS
- 2022-11-07 Pending — CRMLS
- 2022-10-31 Listed $548,490 CRMLS
- 2021-08-31 Sold (Public Records) $6,637,091 Public Records
- 2013-06-20 Sold (Public Records) $2,628,000 Public Records
- 2009-12-31 Sold (Public Records) $2,400,000 Public Records
- 2008-10-15 Sold (Public Records) $675,000 Public Records
Property tax history
+13.1%/yrLatest (2025): $10,688 · +1.7% YoY. Source: county tax records.
Cash-flow waterfall
monthlySold comps — $/sqft
last 12 mo · ≤1 miLoading sold comps…