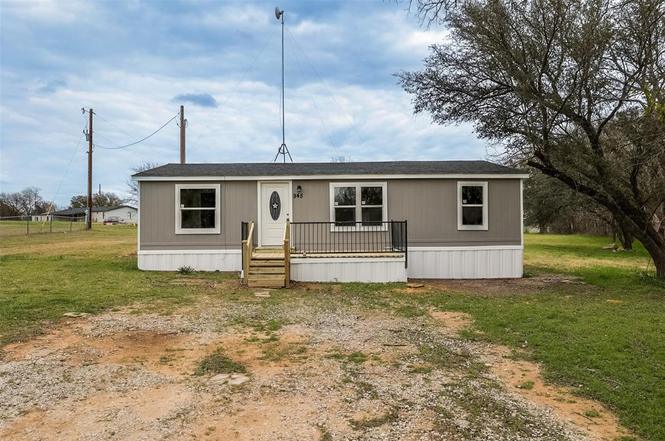
945 Walnut St · Reno, TX
Flood risk 1/10 · Minimal
- FEMA flood zone
- X (unshaded)
- Chance of flooding over 30 yrs
- 0.0%
- Est. flood insurance / yr
- $507 – $1,088
Fire risk 6/10 · Moderate
- Est. fire insurance / yr
- $1,222 – $2,270
Heat risk 7/10 · Major
- Hot days now (above 109°F)
- 7 days/yr
- Hot days in 30 yrs
- 22 days/yr
Wind risk 5/10 · Moderate
- Chance of severe wind over 30 yrs
- 26.0%
Air-quality risk 2/10 · Minimal
- Unhealthy air days now
- 1 days/yr
- Unhealthy air days in 30 yrs
- 1 days/yr
Risk factors via First Street. Map © Google.
Why this score? — see what drove the D grade
The composite is a weighted blend of 9 inputs, each scored 0–100. Each bar is that input's sub-score; the figure is the points it added to the 100-point composite (weight × sub-score).
- Cash flow +18.0/30.0
- DSCR +5.6/10.0
- 1% rule +4.8/10.0
- Schools +3.6/10.0
- Rent growth +3.1/5.0
- Livability +3.0/5.0
- Condition / age +2.5/5.0
- ARV discount +1.0/15.0
- Appreciation +0.0/10.0
$189,900
🖨 Deal sheet 📄 Offer letter ✓ Due diligence
Listing remarks MLS
NICE MOBILE HOME LAND WITH MATURE TREES AND CAR PORT.
Key facts
- Open floor plan
- Quartz countertops
- Walk-in closet
Tags
Property features AI
Finance
- Financial info: Listing accepts Cash, Conventional, and VA financing; Special taxing entities: No
- HOA & community: No association
Exterior
- Parking: Driveway with gravel surface; No garage or covered/carport spaces
- Security: Smoke detector(s)
- Utilities: City water; Septic; Overhead utilities
- Home design: Mobile home (residential); Single-story
- Construction: Built in 1996; Board & batten siding; Composition roof; Pillar/post/pier foundation
- Exterior features: Deck; Chain link fencing with gate and wire; Acreage lot with few trees, landscaped and large grassy backyard; Interior lot
Interior
- Kitchen: Natural stone/granite countertops; Built-in cabinets; Eat-in kitchen; Electric range
- Bedrooms: Primary bedroom on main level with ensuite bath and walk-in closet; Two additional bedrooms on main level
- Flooring: Carpet; Luxury vinyl plank
- Bathrooms: Two full bathrooms
- Heating & cooling: Central heating (electric); Central air conditioning (electric)
- Interior features: Open floorplan; Eat-in kitchen; Walk-in closet(s); One living area; Room count: 7
- Laundry & utility: Washer hookup; Full-size washer/dryer area; Laundry located in hall; Electric water heater
Neighborhood map
What this means for you Summary
Snapshot
- This is a 3-bed/2.0-bath manufactured listed at $190k.
Deal economics
- At list price, monthly cash flow is $163 ($2k/yr) — positive.
- The deal already cash-flows at list — no discount required.
- To meet the 1% rule (rent ≥ 1% of price), the offer needs to be $187k (1.6% below list).
- Recommended offer: $184k (3.0% below list) — sets the bar for market timing.
- Cap rate 7.3% vs local median 2.0% in Reno — top-decile yield for the area; either an underpriced asset or a hidden risk that comps aren't pricing in. Stress-test before assuming the spread holds.
Location & tenants
- Location reads 59/100 on livability (#1,131 in TX) — a working-class tenant base; expect higher turnover. Strengths: cost of living A+, housing A+, crime A; Watch: employment D+, schools D-, amenities F.
- Azle ISD (suburban): math 37% / reading 43% proficiency, ranked #351 of 826 in TX (top 42%) — families likely to look elsewhere, expect single-tenant / working-renter base with shorter leases.
- Market conditions: Rents rising (+2.3%/yr); 591 active listings in the ZIP; 8 comparable units currently listed for rent nearby; rentals leasing fast (median 8d on market — plan ~1-2 weeks tenant-placement turnaround); solid renter incomes; 437 units permitted in Parker County in 2024 (0 in 5+ unit buildings).
Forward outlook
- Local home prices are declining (-3.0%/yr); year-one equity from $1k of loan paydown is wiped out by about $6k of value loss. Plan a longer hold.
- Parker County population projected at +32% by 2050 — long-run rental-demand tailwind backs the buy-and-hold thesis.
Negotiation context
- It's been on market 59 days — a 3% lower offer ($184k) is reasonable based on typical stale-listing flexibility.
- 2 sale attempts since 19y ago; this cycle's ask has dropped $10k (5%) from the opening price — seller is motivated, your offer sets the floor, not the list.
Risks & watch-outs
- Climate carrying-cost: moderate wind risk, 26% chance of damaging wind over 30y; major wildfire risk; extreme-heat days projected 7→22/yr by 2055 (HVAC capex compounding) — expect insurance premiums to compound above CPI over the hold.
Questions for the listing agent
- It's been on market 59 days. Have you received any prior offers? Is the seller open to a 3% concession, seller financing, or rate buy-down credit?
- Is there a deadline driving the sale (1031 exchange, divorce, estate, relocation)? That informs how much negotiation room exists.
- Schools are D-rated, which usually means shorter tenancies and higher turnover. Who's the typical renter profile here, and what's been the actual vacancy rate?
- The area grade is low — what's the realistic commute time and amenity access for the typical tenant pool here? Any planned neighborhood developments (good or bad) we should know about?
- What's the average days-on-market for RENTAL listings here right now (not sales)? A rising rental-DOM trend means longer vacancies and softer asking-rent achievability than the comps imply.
- What's the recent tenant-quality profile in this submarket — average credit score on applications, eviction rate, late-payment / NSF rate, and stable-employment percentage? A property-management company in the area should have these aggregated.
- How much new for-sale + rental construction is in the pipeline within 1–3 miles? Heavy new supply typically softens prices + rents 12–24 months out; constrained supply supports both.
Investment metrics
- 1% rule
- 0.98% ✗
- Cap rate
- 7.32%
- Cash-on-cash
- 3.67%
- DSCR
- 1.16
- GRM
- 8.5
CMA / ARV
- ARV (on-the-fly)
- $165,888
- Comps found
- 1
Show comp detail 1 sale within ~0.75 mi
| Address | Dist | Beds/Ba | Sqft | Sold | Price | $/sf | Match |
|---|---|---|---|---|---|---|---|
| 960 Cottonwood St | 0.15mi | 2/1.0 (-1) | 1,380 (-10%) | 8mo | $149,000 | $108 | 60 |
Match score weights: distance 35% · size 25% · config 20% · recency 20%. Top-matched comps best support the ARV.
Projected returns pro-forma
-3.0% appreciation · 2.31% rent growth · sell at horizon
- IRR
- -11.3%
- Equity multiple
- 0.59×
- Total profit
- $-21,667
- Equity at exit
- $28,315
- IRR
- -3.1%
- Equity multiple
- 0.80×
- Total profit
- $-10,619
- Equity at exit
- $16,419
Cash invested: $53,172 (down + closing). Projections, not guarantees.
Landlord ↔ Tenant lean methodology
- Overall (STATE)
- 87 Strongly Landlord-Friendly
- State Texas
- 87 Strongly Landlord-Friendly · R+5
- County
- — inherits STATE
- City
- — inherits STATE
ZIP-level market 76020
- Home prices YoY
- -20.6%
- Rents YoY
- 2.3%
- Active inventory
- 591
- Price-to-rent
- 8.5×
Monthly cashflow live
- Estimated rent
- $1,869 high interval (Pro) →
- Mortgage (P&I)
- −$996
- Tax from tax record
- −$239 /mo · $2,869/yr
- Insurance
- −$79
- HOA
- −$0
- Vacancy / Maint / Mgmt
- −$393
- Net cashflow
- $163
Break-even live
UW: 25.0% down · 7.5% · 30yr · 1.5% tax · 5.0% vac · 8.0% maint · 8.0% mgmt
Financing live
Cash to close
- Down payment
- $47,475
- Closing costs
- $5,697
- Reserves months
- —
- Total cash needed
- —
Loan-product check · same deal, 3 products live
Conventional
25% down · 7.5% · 30yr
- Down + closing
- —
- Monthly P&I
- —
- Monthly cashflow
- —
- DSCR
- —
- Eligible?
- —
Personal DTI + credit; lowest rate.
DSCR
20% down · 8.5% · 30yr
- Down + closing
- —
- Monthly P&I
- —
- Monthly cashflow
- —
- DSCR
- —
- Eligible?
- —
No personal income docs; deal must DSCR.
Hard money
10% down · 12.0% · 12mo
- Down + closing
- —
- Monthly P&I
- —
- Monthly cashflow
- —
- DSCR
- —
- Eligible?
- —
Short-term bridge; refi at stabilization.
Rent comps 8 comps
| Address | Beds | Baths | Sqft | Rent | $/sqft | DOM | Units | Dist |
|---|---|---|---|---|---|---|---|---|
| 1408 Arvel Cir Apt B Azle, TX | 3.0 | 1.5 | 1200 | $1,415 | $1.18 | 3d | 1 | 0.32mi |
| 1401 Arvel Cir Azle, TX | 3.0 | 1.0 | 1140 | $1,550 | $1.36 | 44d | 1 | 0.35mi |
| 1058 E Reno Rd Azle, TX | 3.0 | 2.0 | 1350 | $1,825 | $1.35 | 44d | 1 | 0.76mi |
| 312 Blanco Dr Azle, TX | 4.0 | 2.0 | 2082 | $2,495 | $1.20 | 1d | 1 | 0.78mi |
| 448 Kaufman Dr Azle, TX | 4.0 | 3.0 | 2091 | $2,500 | $1.20 | 1d | 1 | 0.97mi |
| 912 Red Bud Dr Azle, TX | 3.0 | 1.0 | 1378 | $1,750 | $1.27 | 1d | 1 | 1.45mi |
| 12235 FM 730 N Azle, TX | 2.0 | 2.0 | 1500 | $1,425 | $0.95 | 44d | 1 | 1.46mi |
| 12235 FM 730 N Azle, TX | 2.0 | 2.0 | 1700 | $1,425 | $0.84 | 7d | 1 | 1.46mi |
Listing history 11 events
-
2026-05-07status Pending
-
2026-04-15historical Active Option Contract
-
2026-04-01price $189,900
-
2026-03-09$199,900 Active
-
2025-10-22soldstatus
-
2008-12-08soldstatus
-
2007-08-16soldstatus
-
2007-08-15soldstatus 53-char remark
Show marketing remark (53 chars)
NICE MOBILE HOME LAND WITH MATURE TREES AND CAR PORT.
-
2007-08-03soldstatus
-
2007-07-31historical 53-char remark
Show marketing remark (53 chars)
NICE MOBILE HOME LAND WITH MATURE TREES AND CAR PORT.
-
2007-07-14$25,000 53-char remark
Show marketing remark (53 chars)
NICE MOBILE HOME LAND WITH MATURE TREES AND CAR PORT.
ⓘ Source: listings_history table (triggers on properties + properties_extension) + one-shot
backfill from property_details.listing_events for pre-trigger history.
Tax reassessment forecast TX · Resets to sale price
- Current annual tax
- $2,869 · $239/mo
- Projected year-2 tax
- $3,475 · $290/mo
- Expected delta
- +$606/yr (+$51/mo · 21.1%)
ⓘ Screening estimate from a state-policy table — verify with the county assessor before closing.
Climate risk First Street
- Flood 1/10 Low FEMA zone X (unshaded) · 0% chance over 30 yrs
- Wildfire 6/10 Major
- Heat 7/10 Severe 7 d/yr ≥109°F today · 22 d/yr by 30 yrs out
- Wind 5/10 Major 26% chance of damaging wind over 30 yrs
- Air quality 2/10 Low 1 unhealthy d/yr today · 1 by 30 yrs out
Nearby sold comps map
Loading sold comps map…
Walkable amenities ~0.75 mi
Loading nearby amenities…
Taxation est. · year 1
- Rental income
- $22,433
- − Mortgage interest
- −$10,637
- − Property taxes
- −$2,869
- − Insurance
- −$950
- − Repairs & maintenance
- −$1,795
- − Management
- −$1,795
- − Depreciation
- −$5,524
- Taxable loss
- −$1,137
- Est. tax savings @ 24.0%
- +$273
- After-tax cash flow
- $2,226/yr
For passive investors: Depreciation is non-cash, so a rental often shows a tax loss while cash-flowing — sheltering income. Rental losses are passive: they offset passive income freely, and up to $25,000/yr can offset ordinary (W-2) income if you actively participate and your MAGI is under $100k (phasing out to $0 by $150k); unused losses carry forward. On sale, claimed depreciation is recaptured at up to 25%, and gains may owe capital-gains tax (a 1031 exchange can defer both). Figures are a year-1 estimate at your 24.0% rate — not tax advice; consult a CPA.
Schools (NCES district)
- District
- Azle ISD
- NCES district ID
- 4809200
- Math proficiency
- 37% ▼ -11.00%
- Reading proficiency
- 43% ▼ -5.00%
- Median HH income
- $61,473
- Composite
- 35.57/100
- National rank
- #4900
- State rank
- #351 of 826 in TX
Livability — Reno
- Score
- 59/100
- State rank
- #1131
- US rank
- #20008
Category grades
Schools grade is shown separately in the Schools card above.
Census & demographics
- Census place
- Reno, TX
- County
- Parker County · 144,797 people
- Metro
- Dallas-Fort Worth-Arlington, TX
- Population (ZIP)
- 34,602
- Household income
- $87,298
- Rent vs Own
- Severe rent burden
- 433.0
Population outlook (Parker County) Hauer SSP2
- Today (2025)
- 147,426 people
- By 2030
- 157,863 · +7.1%
- By 2040
- 177,519 · +20.4%
- By 2050
- 194,786 · +32.1%
- By 2075
- 238,799 · +62.0%
- By 2100
- 264,126 · +79.2%
Race, ethnicity, and origin ACS 2023
- Neighborhood character
- Predominantly White (78%)
- Race & ethnicity
- White 78% Hispanic / Latino 18% Two or more races 9% Black 1%
- Hispanic origin (detail)
- Mexican 15%
- Common ancestry
- Slovak 2% Italian 1% Portuguese 1%
- Foreign-born
- 5% · Canada
- Languages at home
- 89% English-only · Spanish 11%
Political lean MEDSL · Parker
- 2024 margin
- Solid R (+66.4) · D 16.4% · R 82.8%
- 2008→2024 swing
- -11.2pp toward R · 2008: -55.2pp · 2024: -66.4pp
- All cycles
- 2024: R+66.4 2020: R+64.4 2016: R+67.5 2012: R+65.8 2008: R+55.2
Not yet ingested
- Civics
- —
Market trends
- HPI YoY
- ▼ -74.72%
- Current HPI
- 287.155
- Rent YoY
- ▲ 2.31%
- Metro
- Dallas-Fort Worth-Arlington, TX
- State GDP YoY
- ▲ 3.95%
- F500 in state
- 110
Industry mix (Fortune 500 HQ in TX)
| Industry | F500 HQs | Revenue |
|---|---|---|
| Energy | 16 | $1,198B |
|
||
| Technology | 5 | $198B |
|
||
| Engineering / Construction | 4 | $72B |
|
||
| Energy Services | 3 | $60B |
|
||
| Utilities | 3 | $41B |
|
||
| Healthcare | 2 | $330B |
|
||
Price history
+659.6% since first listed11 events — show timeline
- 2026-05-07 Pending — NTREIS
- 2026-04-15 Contingent — NTREIS
- 2026-04-01 Price Changed $189,900 NTREIS
- 2026-03-09 Listed $199,900 NTREIS
- 2025-10-22 Sold (Public Records) — Public Records
- 2008-12-08 Sold (Public Records) — Public Records
- 2007-08-16 Sold (Public Records) — Public Records
- 2007-08-15 Sold (MLS) — NTREIS
- 2007-08-03 Sold (Public Records) — Public Records
- 2007-07-31 Listing Removed — NTREIS
- 2007-07-14 Listed $25,000 NTREIS
Property tax history
+12.1%/yrLatest (2025): $2,869 · -19.2% YoY. Source: county tax records.
Cash-flow waterfall
monthlySold comps — $/sqft
last 12 mo · ≤1 miLoading sold comps…