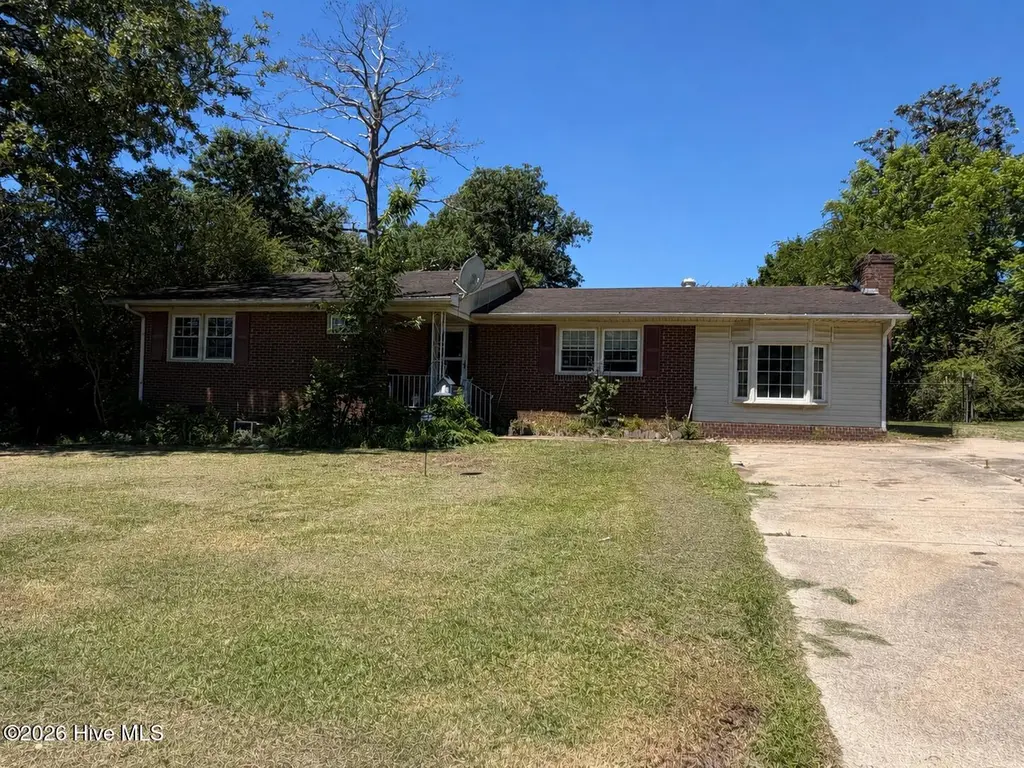
1116 Riverside Cir · Spring Lake, NC
Flood risk 1/10 · Minimal
- FEMA flood zone
- X (unshaded)
- Chance of flooding over 30 yrs
- 0.0%
- Est. flood insurance / yr
- $473 – $860
Fire risk 6/10 · Moderate
- Est. fire insurance / yr
- $906 – $1,684
Heat risk 7/10 · Major
- Hot days now (above 107°F)
- 7 days/yr
- Hot days in 30 yrs
- 17 days/yr
Wind risk 6/10 · Moderate
- Chance of severe wind over 30 yrs
- 69.0%
Air-quality risk 1/10 · Minimal
- Unhealthy air days now
- 0 days/yr
- Unhealthy air days in 30 yrs
- 0 days/yr
Risk factors via First Street. Map © Google.
Why this score? — see what drove the C grade
The composite is a weighted blend of 9 inputs, each scored 0–100. Each bar is that input's sub-score; the figure is the points it added to the 100-point composite (weight × sub-score).
- Cash flow +24.9/30.0
- DSCR +8.1/10.0
- ARV discount +7.5/15.0
- 1% rule +5.8/10.0
- Rent growth +3.6/5.0
- Schools +3.1/10.0
- Livability +3.0/5.0
- Condition / age +2.5/5.0
- Appreciation +0.0/10.0
$130,000
🖨 Deal sheet 📄 Offer letter ✓ Due diligence
Listing remarks
Three-Bedroom Brick Ranch located in Bragg Estates. Large, fenced backyard with outdoor storage, covered back deck with built in seating. Home has hardwood floors in the hallway, two bedrooms, and dining room that could be refinished, there is an active Roof boot leak near the primary bathroom and is need of repair. Home has tons of potential. Investors welcome. Home is subject to noise from Fort Bragg. Home sold AS-IS. Septic pumped May 2026.
Key facts
- Outdoor storage
- Built in seating
- Covered back deck
Tags
Neighborhood map
What this means for you Summary
Snapshot
- This is a 3-bed/2.0-bath single-family listed at $130k.
Deal economics
- At list price, monthly cash flow is $277 ($3k/yr) — positive.
- The deal already cash-flows at list — no discount required.
- Meets the 1% rule at list price ($1k rent vs $130k).
- Recommended offer: $128k (1.5% below list) — sets the bar for market timing.
- Cap rate 8.9% vs local median 4.5% in Spring Lake — top-decile yield for the area; either an underpriced asset or a hidden risk that comps aren't pricing in. Stress-test before assuming the spread holds.
Location & tenants
- Location reads 59/100 on livability (#543 in NC) — a working-class tenant base; expect higher turnover. Strengths: cost of living A+, housing A+; Watch: crime F, amenities F, commute F.
- Cumberland County Schools (urban): math 32% / reading 41% proficiency, ranked #126 of 178 in NC (top 71%) — families likely to look elsewhere, expect single-tenant / working-renter base with shorter leases.
- Zoned schools: Spring Lake Middle (math 15% / reading 31%, grade F, #406 of 475 statewide, top 86%, 512 students, 99% FRL); Pine Forest High (math 73% / reading 51%, grade B-, #184 of 535 statewide, top 37%, 1,572 students, 62% FRL) — zoned schools average 81% FRL vs 55% district-wide (26 pts higher); higher-poverty schools than district average — tighter screening recommended.
- Market conditions: Rents rising fast (+4.5%/yr); 348 active listings in the ZIP; 4 comparable units currently listed for rent nearby; rentals at typical pace (median 23d on market — plan ~3-4 weeks tenant-placement turnaround); 1,125 units permitted in Cumberland County in 2024 (104 in 5+ unit buildings).
Forward outlook
- Local home prices are declining (-3.0%/yr); year-one equity from $899 of loan paydown is wiped out by about $4k of value loss. Plan a longer hold.
- At projected returns (-3.0% appreciation + 4.5% rent growth), your $36k cash investment doubles in ~10 years — after that, you're playing with house money.
Negotiation context
- It's been on market 16 days — a 2% lower offer ($128k) is reasonable based on typical stale-listing flexibility.
- Current owner paid $80k; list at $130k implies a 62% gain — meaningful room to come down on a strong offer.
Risks & watch-outs
- Climate carrying-cost: major wind risk, 69% chance of damaging wind over 30y; major wildfire risk; extreme-heat days projected 7→17/yr by 2055 (HVAC capex compounding) — expect insurance premiums to compound above CPI over the hold.
Questions for the listing agent
- Built in 1969 — when were the roof, HVAC, electrical panel, plumbing, and water heater last replaced?
- Is there a deadline driving the sale (1031 exchange, divorce, estate, relocation)? That informs how much negotiation room exists.
- Schools are D-rated, which usually means shorter tenancies and higher turnover. Who's the typical renter profile here, and what's been the actual vacancy rate?
- Crime grade is F in this area — have there been break-ins, vandalism, or insurance claims at this property in the last 3 years? What carrier currently insures it and at what premium?
- What's the average days-on-market for RENTAL listings here right now (not sales)? A rising rental-DOM trend means longer vacancies and softer asking-rent achievability than the comps imply.
- What's the recent tenant-quality profile in this submarket — average credit score on applications, eviction rate, late-payment / NSF rate, and stable-employment percentage? A property-management company in the area should have these aggregated.
- How much new for-sale + rental construction is in the pipeline within 1–3 miles? Heavy new supply typically softens prices + rents 12–24 months out; constrained supply supports both.
Investment metrics
- 1% rule
- 1.08% ✓
- Cap rate
- 8.85%
- Cash-on-cash
- 9.15%
- DSCR
- 1.41
- GRM
- 7.7
CMA / ARV
- ARV (on-the-fly)
- $78,800
- Comps found
- 1
Show comp detail 1 sale within ~0.75 mi
| Address | Dist | Beds/Ba | Sqft | Sold | Price | $/sf | Match |
|---|---|---|---|---|---|---|---|
| 1142 Riverside Cir | 0.17mi | 3/1.5 | 1,058 (+7%) | 20mo | $85,000 | $80 | 61 |
Match score weights: distance 35% · size 25% · config 20% · recency 20%. Top-matched comps best support the ARV.
Projected returns pro-forma
-3.0% appreciation · 4.49% rent growth · sell at horizon
- IRR
- -0.9%
- Equity multiple
- 0.96×
- Total profit
- $-1,275
- Equity at exit
- $19,383
- IRR
- 10.2%
- Equity multiple
- 1.84×
- Total profit
- $30,611
- Equity at exit
- $11,240
Cash invested: $36,400 (down + closing). Projections, not guarantees.
Landlord ↔ Tenant lean methodology
- Overall (STATE)
- 85 Strongly Landlord-Friendly
- State North Carolina
- 85 Strongly Landlord-Friendly · R+3
- County
- — inherits STATE
- City
- — inherits STATE
ZIP-level market 28390
- Home prices YoY
- -15.2%
- Rents YoY
- 4.5%
- Active inventory
- 348
- Price-to-rent
- 7.7×
Monthly cashflow live
- Estimated rent
- $1,405 medium interval (Pro) →
- Mortgage (P&I)
- −$682
- Tax from tax record
- −$97 /mo · $1,163/yr
- Insurance
- −$54
- HOA
- −$0
- Vacancy / Maint / Mgmt
- −$295
- Net cashflow
- $277
Break-even live
UW: 25.0% down · 7.5% · 30yr · 1.5% tax · 5.0% vac · 8.0% maint · 8.0% mgmt
Financing live
Cash to close
- Down payment
- $32,500
- Closing costs
- $3,900
- Reserves months
- —
- Total cash needed
- —
Loan-product check · same deal, 3 products live
Conventional
25% down · 7.5% · 30yr
- Down + closing
- —
- Monthly P&I
- —
- Monthly cashflow
- —
- DSCR
- —
- Eligible?
- —
Personal DTI + credit; lowest rate.
DSCR
20% down · 8.5% · 30yr
- Down + closing
- —
- Monthly P&I
- —
- Monthly cashflow
- —
- DSCR
- —
- Eligible?
- —
No personal income docs; deal must DSCR.
Hard money
10% down · 12.0% · 12mo
- Down + closing
- —
- Monthly P&I
- —
- Monthly cashflow
- —
- DSCR
- —
- Eligible?
- —
Short-term bridge; refi at stabilization.
Rent comps 4 comps
| Address | Beds | Baths | Sqft | Rent | $/sqft | DOM | Units | Dist |
|---|---|---|---|---|---|---|---|---|
| 415 Vass Rd Spring Lake, NC | 3.0 | 2.0 | 1050 | $1,300 | $1.24 | 23d | 1 | 0.93mi |
| 222-232 W Manchester Rd Unit Manchester Arms Apartments Spring Lake, NC | 2.0 | 1.0 | 1000 | $1,200 | $1.20 | 23d | 1 | 1.28mi |
| 222 W Manchester Rd Unit 222 Spring Lake, NC | 2.0 | 1.0 | 1000 | $1,200 | $1.20 | 23d | 1 | 1.28mi |
| 222 W Manchester Rd Unit 222 Spring Lake, NC | 2.0 | 1.0 | 1000 | $1,200 | $1.20 | 21d | 1 | 1.28mi |
Listing history 12 events
-
2026-06-18days on market $130,000 Active 16 DOM
-
2026-06-17days on market $130,000 Active 15 DOM
-
2026-06-16days on market $130,000 Active 14 DOM
-
2026-06-15days on market $130,000 Active 13 DOM
-
2026-06-14days on market $130,000 Active 11 DOM
-
2026-06-13days on market $130,000 Active 10 DOM
-
2026-06-10days on market $130,000 Active 8 DOM
-
2026-06-09days on market $130,000 Active 7 DOM
-
2026-06-08days on market $130,000 Active 6 DOM
-
2026-06-07days on market $130,000 Active 5 DOM
-
2026-06-03remarks 447-char remark
-
2026-06-03$130,000 Active 1 DOM
ⓘ Source: listings_history table (triggers on properties + properties_extension) + one-shot
backfill from property_details.listing_events for pre-trigger history.
Tax reassessment forecast NC · Resets to sale price
- Current annual tax
- $1,163 · $97/mo
- Projected year-2 tax
- $1,163 · $97/mo
- Expected delta
- $0/yr ($0/mo · 0.0%)
ⓘ Screening estimate from a state-policy table — verify with the county assessor before closing.
Climate risk First Street
- Flood 1/10 Low FEMA zone X (unshaded) · 0% chance over 30 yrs
- Wildfire 6/10 Major
- Heat 7/10 Severe 7 d/yr ≥107°F today · 17 d/yr by 30 yrs out
- Wind 6/10 Major 69% chance of damaging wind over 30 yrs
- Air quality 1/10 Low 0 unhealthy d/yr today · 0 by 30 yrs out
Nearby sold comps map
Loading sold comps map…
Walkable amenities ~0.75 mi
Loading nearby amenities…
Taxation est. · year 1
- Rental income
- $16,865
- − Mortgage interest
- −$7,282
- − Property taxes
- −$1,163
- − Insurance
- −$650
- − Repairs & maintenance
- −$1,349
- − Management
- −$1,349
- − Depreciation
- −$3,782
- Taxable income
- $1,290
- Est. tax owed @ 24.0%
- −$310
- After-tax cash flow
- $3,020/yr
For passive investors: Depreciation is non-cash, so a rental often shows a tax loss while cash-flowing — sheltering income. Rental losses are passive: they offset passive income freely, and up to $25,000/yr can offset ordinary (W-2) income if you actively participate and your MAGI is under $100k (phasing out to $0 by $150k); unused losses carry forward. On sale, claimed depreciation is recaptured at up to 25%, and gains may owe capital-gains tax (a 1031 exchange can defer both). Figures are a year-1 estimate at your 24.0% rate — not tax advice; consult a CPA.
Schools (NCES district)
- District
- Cumberland County Schools
- NCES district ID
- 3700011
- Math proficiency
- 32% ▼ -2.00%
- Reading proficiency
- 41% ▼ -1.00%
- Median HH income
- $44,168
- Composite
- 31.0/100
- National rank
- #6096
- State rank
- #126 of 178 in NC
Livability — Spring Lake
- Score
- 59/100
- State rank
- #543
- US rank
- #19811
Category grades
Schools grade is shown separately in the Schools card above.
Census & demographics
- County
- Harnett County · 125,715 people
- City population
- 24,000
- Metro
- Fayetteville, NC
- Population (ZIP)
- 24,000
- Household income
- $62,972
- Rent vs Own
- Severe rent burden
- 811.0
Population outlook (Cumberland County) Hauer SSP2
- Today (2025)
- 330,855 people
- By 2030
- 333,523 · +0.8%
- By 2040
- 335,583 · +1.4%
- By 2050
- 335,325 · +1.4%
- By 2075
- 342,853 · +3.6%
- By 2100
- 340,698 · +3.0%
Race, ethnicity, and origin ACS 2023
- Neighborhood character
- Diverse neighborhood (Simpson 0.70)
- Race & ethnicity
- White 41% Black 33% Hispanic / Latino 14% Two or more races 12% Asian 2% Native American 1%
- Hispanic origin (detail)
- Mexican 6% Puerto Rican 4%
- Common ancestry
- Italian 1% Slovak 1% Romanian 1%
- Foreign-born
- 7% · Canada, South Korea, Jamaica
- Languages at home
- 88% English-only · Spanish 8% German/W. Germanic 1% Korean 1%
Political lean MEDSL · Cumberland
- 2024 margin
- D (+13.4) · D 56.1% · R 42.7% · Other 1.2%
- 2008→2024 swing
- -4.3pp toward R · 2008: 17.7pp · 2024: 13.4pp
- All cycles
- 2024: D+13.4 2020: D+16.6 2016: D+16.0 2012: D+19.7 2008: D+17.7
Not yet ingested
- Civics
- —
Market trends
- HPI YoY
- ▼ -37.43%
- Current HPI
- 207.9349
- Rent YoY
- ▲ 4.49%
- Metro
- Fayetteville, NC
- State GDP YoY
- ▲ 3.28%
- F500 in state
- 26
Industry mix (Fortune 500 HQ in NC)
| Industry | F500 HQs | Revenue |
|---|---|---|
| Financial Services | 2 | $213B |
|
||
| Retail | 2 | $95B |
|
||
| Industrial Conglomerate | 1 | $38B |
|
||
| Metals / Steel | 1 | $35B |
|
||
| Utilities | 1 | $30B |
|
||
| Industrial Machinery | 1 | $19B |
|
||
Price history
+62.5% since first listed2 events — show timeline
- 2026-06-02 Listed $130,000 Hive MLS
- 2023-08-21 Sold (Public Records) $80,000 Public Records
Property tax history
+3.4%/yrLatest (2025): $1,163 · +45.5% YoY. Source: county tax records.
Cash-flow waterfall
monthlySold comps — $/sqft
last 12 mo · ≤1 miLoading sold comps…