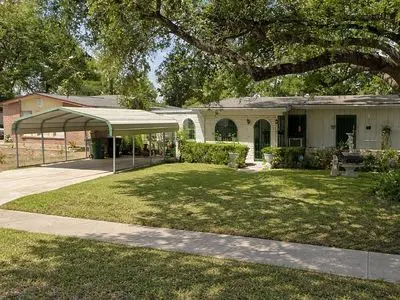
75 Wayside Dr · San Antonio, TX
Flood risk 1/10 · Minimal
- FEMA flood zone
- X (unshaded)
- Chance of flooding over 30 yrs
- 0.0%
- Est. flood insurance / yr
- $507 – $1,088
Fire risk 1/10 · Minimal
- Est. fire insurance / yr
- $1,222 – $2,270
Heat risk 8/10 · Major
- Hot days now (above 108°F)
- 7 days/yr
- Hot days in 30 yrs
- 22 days/yr
Wind risk 6/10 · Moderate
- Chance of severe wind over 30 yrs
- 71.0%
Air-quality risk 2/10 · Minimal
- Unhealthy air days now
- 1 days/yr
- Unhealthy air days in 30 yrs
- 1 days/yr
Risk factors via First Street. Map © Google.
Why this score? — see what drove the C grade
The composite is a weighted blend of 9 inputs, each scored 0–100. Each bar is that input's sub-score; the figure is the points it added to the 100-point composite (weight × sub-score).
- Cash flow +18.6/30.0
- ARV discount +15.0/15.0
- 1% rule +6.7/10.0
- DSCR +5.8/10.0
- Livability +4.0/5.0
- Schools +3.8/10.0
- Condition / age +2.5/5.0
- Rent growth +0.7/5.0
- Appreciation +0.0/10.0
$135,800
🖨 Deal sheet 📄 Offer letter ✓ Due diligence
Listing remarks
Great Value ALL BILLS PAID! This apartment home includes its own private porch and entrance. Mature trees and landscaping in neighborhood. Large bedrooms, spacious living space. This is a great deal! Close to IH-410, shopping, and entertainment.
Key facts
- Private porch
- Landscaping
- Own entrance
Tags
Property features AI
Exterior
- Home design: Built in 1956
- Construction: Original construction from 1956
- Exterior features: Located in the Greater Dellview subdivision
Neighborhood map
What this means for you Summary
Snapshot
- This is a 3-bed/2.0-bath single-family listed at $136k.
Deal economics
- At list price, monthly cash flow is $132 ($2k/yr) — positive.
- The deal already cash-flows at list — no discount required.
- Meets the 1% rule at list price ($2k rent vs $136k).
- Recommended offer: $134k (1.5% below list) — sets the bar for market timing.
- Cap rate 7.5% vs local median 3.8% in San Antonio — top-decile yield for the area; either an underpriced asset or a hidden risk that comps aren't pricing in. Stress-test before assuming the spread holds.
Location & tenants
- Location reads 80/100 on livability (#31 in TX, #1,616 nationally) — a professional / high-income tenant draw. Strengths: amenities A+, commute A+, cost of living A+; Watch: schools C-, crime F.
- North East ISD (urban): math 38% / reading 49% proficiency, ranked #276 of 826 in TX (top 33%) — families likely to look elsewhere, expect single-tenant / working-renter base with shorter leases.
- Market conditions: Rents falling (-7.3%/yr); 104 active listings in the ZIP; 40 comparable units currently listed for rent nearby; rentals at typical pace (median 24d on market — plan ~3-4 weeks tenant-placement turnaround); 8,308 units permitted in Bexar County in 2024 (2,506 in 5+ unit buildings).
- This rent runs 34% of the median local income ($56k/yr) — at the standard rent-burdened threshold; future hikes will face affordability resistance.
Forward outlook
- Local home prices are declining (-3.0%/yr); year-one equity from $939 of loan paydown is wiped out by about $4k of value loss. Plan a longer hold.
- Bexar County population projected at +50% by 2050 — long-run rental-demand tailwind backs the buy-and-hold thesis.
Negotiation context
- It's been on market 23 days — a 2% lower offer ($134k) is reasonable based on typical stale-listing flexibility.
Risks & watch-outs
- Watch-outs: property tax is 3.1% of price; built in 1956 — expect roof / HVAC / electrical / plumbing capex.
- Climate carrying-cost: major wind risk, 71% chance of damaging wind over 30y; extreme-heat days projected 7→22/yr by 2055 (HVAC capex compounding) — expect insurance premiums to compound above CPI over the hold.
Questions for the listing agent
- Built in 1956 — when were the roof, HVAC, electrical panel, plumbing, and water heater last replaced?
- Property tax is high relative to price — has the assessment been appealed recently, and will the sale trigger a re-assessment?
- Is there a deadline driving the sale (1031 exchange, divorce, estate, relocation)? That informs how much negotiation room exists.
- Crime grade is F in this area — have there been break-ins, vandalism, or insurance claims at this property in the last 3 years? What carrier currently insures it and at what premium?
- What's the average days-on-market for RENTAL listings here right now (not sales)? A rising rental-DOM trend means longer vacancies and softer asking-rent achievability than the comps imply.
- What's the recent tenant-quality profile in this submarket — average credit score on applications, eviction rate, late-payment / NSF rate, and stable-employment percentage? A property-management company in the area should have these aggregated.
- How much new for-sale + rental construction is in the pipeline within 1–3 miles? Heavy new supply typically softens prices + rents 12–24 months out; constrained supply supports both.
Investment metrics
- 1% rule
- 1.17% ✓
- Cap rate
- 7.46%
- Cash-on-cash
- 4.16%
- DSCR
- 1.18
- GRM
- 7.2
CMA / ARV
- ARV (on-the-fly)
- $219,678
- Comps found
- 12
Show comp detail 12 sales within ~0.75 mi
| Address | Dist | Beds/Ba | Sqft | Sold | Price | $/sf | Match |
|---|---|---|---|---|---|---|---|
| 122 Adrian Dr | 0.36mi | 4/2.0 (+1) | 1,540 (-1%) | 4mo | $215,000 | $140 | 73 |
| 1815 Montview | 0.32mi | 3/2.0 | 1,430 (-8%) | 2mo | $247,000 | $173 | 70 |
| 602 Craigmont | 0.19mi | 3/1.0 | 1,385 (-11%) | 1mo | $225,000 | $162 | 68 |
| 255 Trudell Dr | 0.52mi | 4/2.0 (+1) | 1,569 (+1%) | 2mo | $209,000 | $133 | 68 |
| 1919 Arroya Vis | 0.32mi | 3/2.0 | 1,394 (-10%) | 9mo | $230,000 | $165 | 60 |
| 635 Edgebrook Ln | 0.65mi | 3/2.0 | 1,446 (-7%) | 1mo | $195,000 | $135 | 57 |
| 1503 Arroya Vis | 0.45mi | 4/2.0 (+1) | 1,637 (+5%) | 10mo | $285,000 | $174 | 57 |
| 119 Oxford Dr | 0.53mi | 3/1.5 | 1,433 (-8%) | 4mo | $189,000 | $132 | 57 |
| 538 Gilbert Ln | 0.34mi | 3/2.0 | 1,775 (+14%) | 6mo | $145,360 | $82 | 56 |
| 431 Pilgrim | 0.73mi | 3/2.0 | 1,457 (-6%) | 1mo | $205,000 | $141 | 55 |
| 235 Saratoga Dr | 0.53mi | 3/1.0 | 1,365 (-12%) | 3mo | $199,000 | $146 | 48 |
| 307 Cherry Rdg | 0.58mi | 4/2.0 (+1) | 1,332 (-14%) | 8mo | $115,000 | $86 | 37 |
Match score weights: distance 35% · size 25% · config 20% · recency 20%. Top-matched comps best support the ARV.
Projected returns pro-forma
-3.0% appreciation · 0.0% rent growth · sell at horizon
- IRR
- -13.7%
- Equity multiple
- 0.52×
- Total profit
- $-18,120
- Equity at exit
- $20,248
- IRR
- -11.7%
- Equity multiple
- 0.41×
- Total profit
- $-22,351
- Equity at exit
- $11,742
Cash invested: $38,024 (down + closing). Projections, not guarantees.
Landlord ↔ Tenant lean methodology
- Overall (STATE)
- 87 Strongly Landlord-Friendly
- State Texas
- 87 Strongly Landlord-Friendly · R+5
- County
- — inherits STATE
- City
- — inherits STATE
ZIP-level market 78213
- Rents YoY
- -7.3%
- Active inventory
- 104
- Price-to-rent
- 7.2×
Monthly cashflow live
- Estimated rent
- $1,582 high interval (Pro) →
- Mortgage (P&I)
- −$712
- Tax from tax record
- −$350 /mo · $4,195/yr
- Insurance
- −$57
- HOA
- −$0
- Vacancy / Maint / Mgmt
- −$332
- Net cashflow
- $132
Break-even live
UW: 25.0% down · 7.5% · 30yr · 1.5% tax · 5.0% vac · 8.0% maint · 8.0% mgmt
Financing live
Cash to close
- Down payment
- $33,950
- Closing costs
- $4,074
- Reserves months
- —
- Total cash needed
- —
Loan-product check · same deal, 3 products live
Conventional
25% down · 7.5% · 30yr
- Down + closing
- —
- Monthly P&I
- —
- Monthly cashflow
- —
- DSCR
- —
- Eligible?
- —
Personal DTI + credit; lowest rate.
DSCR
20% down · 8.5% · 30yr
- Down + closing
- —
- Monthly P&I
- —
- Monthly cashflow
- —
- DSCR
- —
- Eligible?
- —
No personal income docs; deal must DSCR.
Hard money
10% down · 12.0% · 12mo
- Down + closing
- —
- Monthly P&I
- —
- Monthly cashflow
- —
- DSCR
- —
- Eligible?
- —
Short-term bridge; refi at stabilization.
Rent comps 40 comps
| Address | Beds | Baths | Sqft | Rent | $/sqft | DOM | Units | Dist |
|---|---|---|---|---|---|---|---|---|
| 106 Pilgrim Dr San Antonio, TX | 4.0 | 2.0 | 1318 | $1,800 | $1.37 | 43d | 1 | 0.19mi |
| 518 Dresden Dr San Antonio, TX | 3.0 | 2.0 | 1305 | $1,395 | $1.07 | 14d | 1 | 0.23mi |
| 139 Trudell Dr San Antonio, TX | 4.0 | 1.0 | 1252 | $1,350 | $1.08 | 43d | 1 | 0.37mi |
| 434 Schmeltzer Ln San Antonio, TX | 3.0 | 1.0 | 1248 | $1,495 | $1.20 | 14d | 1 | 0.38mi |
| 210 Dryden San Antonio, TX | 3.0 | 1.0 | 1177 | $1,600 | $1.36 | 43d | 1 | 0.42mi |
| 138 Shady Rill San Antonio, TX | 3.0 | 2.0 | 1585 | $1,600 | $1.01 | 23d | 1 | 0.52mi |
| 1550 Jackson Keller Rd San Antonio, TX | 1.0–2.0 | 1.0–2.0 | 1100 | $1,757 | $1.60 | 3d | 13 | 0.59mi |
| 1550 Jackson Keller Rd Unit 710 San Antonio, TX | 2.0 | 2.0 | 1221 | $1,263 | $1.03 | 10d | 1 | 0.59mi |
| 1602 Jackson Keller Rd San Antonio, TX | 1.0–3.0 | 1.0–2.0 | 975 | $1,416 | $1.45 | 20d | 1 | 0.59mi |
| 318 Avalon St San Antonio, TX | 3.0 | 2.0 | 1058 | $1,600 | $1.51 | 23d | 1 | 0.62mi |
| 97 Denton Dr San Antonio, TX | 3.0 | 2.0 | 1672 | $1,750 | $1.05 | 23d | 1 | 0.68mi |
| 2323 Spicewood San Antonio, TX | 3.0 | 1.0 | 1165 | $1,550 | $1.33 | 43d | 1 | 0.69mi |
| 943 Weizmann St San Antonio, TX | 3.0 | 2.0 | 1692 | $2,100 | $1.24 | 43d | 1 | 0.69mi |
| 943 Weizmann St San Antonio, TX | 3.0 | 2.0 | 1692 | $2,100 | $1.24 | 23d | 1 | 0.69mi |
| 275 Greenhill Pass San Antonio, TX | 3.0 | 2.0 | 1450 | $1,650 | $1.14 | 23d | 1 | 0.70mi |
| 230 Craigmont Ln San Antonio, TX | 3.0 | 2.0 | 1351 | $2,100 | $1.55 | 23d | 1 | 0.74mi |
| 206 Avalon St San Antonio, TX | 3.0 | 1.0 | 1200 | $1,450 | $1.21 | 43d | 1 | 0.76mi |
| 146 Redrock Dr San Antonio, TX | 3.0 | 1.0 | 1050 | $1,800 | $1.71 | 16d | 1 | 0.77mi |
| 430 Beryl Dr San Antonio, TX | 3.0 | 1.0 | 1302 | $1,590 | $1.22 | 3d | 1 | 0.78mi |
| 462 Trudell Dr Unit A San Antonio, TX | 2.0 | 1.0 | 1520 | $1,250 | $0.82 | 21d | 1 | 0.85mi |
| 100 Bluet Ln San Antonio, TX | 4.0 | 2.0 | 2238 | $2,150 | $0.96 | 7d | 1 | 0.86mi |
| 527 Lively Dr San Antonio, TX | 3.0 | 1.0 | 1270 | $1,500 | $1.18 | 23d | 1 | 0.94mi |
| 2326 Basse Rd San Antonio, TX | 3.0 | 2.0 | 1168 | $1,250 | $1.07 | 23d | 1 | 0.95mi |
| 121 Riviera Dr San Antonio, TX | 3.0 | 2.0 | 1950 | $2,400 | $1.23 | 23d | 1 | 0.99mi |
| 558 Adrian Dr San Antonio, TX | 3.0 | 1.5 | 1515 | $1,500 | $0.99 | 43d | 1 | 1.03mi |
| 319 Mink San Antonio, TX | 3.0 | 1.0 | 1276 | $1,495 | $1.17 | 4d | 1 | 1.19mi |
| 811 Jackson Keller Rd #3 San Antonio, TX | 2.0 | 1.5 | 1350 | $1,295 | $0.96 | 10d | 1 | 1.22mi |
| 338 Addax Dr San Antonio, TX | 3.0 | 1.5 | 1320 | $1,465 | $1.11 | 23d | 1 | 1.24mi |
| 2500 Jackson Keller Rd San Antonio, TX | 2.0 | 2.5 | 1180 | $1,049 | $0.89 | 23d | 1 | 1.24mi |
| 2500 Jackson Keller Rd Apt 505 San Antonio, TX | 2.0 | 2.5 | 1180 | $1,199 | $1.02 | 43d | 1 | 1.27mi |
| 2500 Jackson Keller Rd Unit 203 San Antonio, TX | 3.0 | 2.0 | 1410 | $1,499 | $1.06 | 43d | 1 | 1.27mi |
| 158 Weizmann St San Antonio, TX | 3.0 | 2.0 | 1288 | $1,750 | $1.36 | 14d | 1 | 1.28mi |
| 359 Langton Dr San Antonio, TX | 3.0 | 2.0 | 1698 | $1,950 | $1.15 | 23d | 1 | 1.34mi |
| 3115 Bluefield St San Antonio, TX | 4.0 | 2.0 | 1650 | $2,200 | $1.33 | 17d | 1 | 1.39mi |
| 118 Gaskin Dr San Antonio, TX | 3.0 | 2.0 | 1340 | $2,050 | $1.53 | 43d | 1 | 1.39mi |
| 823 La Manda Blvd San Antonio, TX | 3.0 | 2.0 | 1166 | $1,550 | $1.33 | 4d | 1 | 1.41mi |
| 143 Kinder Dr San Antonio, TX | 4.0 | 2.0 | 1438 | $2,250 | $1.56 | 23d | 1 | 1.43mi |
| 166 Tabard Dr San Antonio, TX | 3.0 | 2.0 | 1491 | $1,800 | $1.21 | 3d | 1 | 1.43mi |
| 1627 W Mariposa Dr San Antonio, TX | 3.0 | 2.0 | 1400 | $1,850 | $1.32 | 12d | 1 | 1.45mi |
| 6701 Blanco Rd San Antonio, TX | 2.0 | 1.0–2.0 | 803 | $1,875 | $2.33 | 23d | 1 | 1.49mi |
Listing history 14 events
-
2026-06-18days on market $135,800 Active 23 DOM
-
2026-06-17days on market $135,800 Active 22 DOM
-
2026-06-16days on market $135,800 Active 21 DOM
-
2026-06-13days on market $135,800 Active 18 DOM
-
2026-06-13days on market $135,800 Active 17 DOM
-
2026-06-09days on market $135,800 Active 14 DOM
-
2026-06-08days on market $135,800 Active 13 DOM
-
2026-06-07days on market $135,800 Active 12 DOM
-
2026-06-04days on market $135,800 Active 9 DOM
-
2026-06-03days on market $135,800 Active 8 DOM
-
2026-06-02days on market $135,800 Active 7 DOM
-
2026-06-01days on market $135,800 Active 6 DOM
-
2026-05-31days on market $135,800 Active 5 DOM
-
2026-05-26$135,800 Active
ⓘ Source: listings_history table (triggers on properties + properties_extension) + one-shot
backfill from property_details.listing_events for pre-trigger history.
Tax reassessment forecast TX · Resets to sale price
- Current annual tax
- $4,195 · $350/mo
- Projected year-2 tax
- $4,195 · $350/mo
- Expected delta
- $0/yr ($0/mo · 0.0%)
ⓘ Screening estimate from a state-policy table — verify with the county assessor before closing.
Climate risk First Street
- Flood 1/10 Low FEMA zone X (unshaded) · 0% chance over 30 yrs
- Wildfire 1/10 Low
- Heat 8/10 Severe 7 d/yr ≥108°F today · 22 d/yr by 30 yrs out
- Wind 6/10 Major 71% chance of damaging wind over 30 yrs
- Air quality 2/10 Low 1 unhealthy d/yr today · 1 by 30 yrs out
Nearby sold comps map
Loading sold comps map…
Walkable amenities ~0.75 mi
Loading nearby amenities…
Taxation est. · year 1
- Rental income
- $18,987
- − Mortgage interest
- −$7,607
- − Property taxes
- −$4,195
- − Insurance
- −$679
- − Repairs & maintenance
- −$1,519
- − Management
- −$1,519
- − Depreciation
- −$3,951
- Taxable loss
- −$482
- Est. tax savings @ 24.0%
- +$116
- After-tax cash flow
- $1,696/yr
For passive investors: Depreciation is non-cash, so a rental often shows a tax loss while cash-flowing — sheltering income. Rental losses are passive: they offset passive income freely, and up to $25,000/yr can offset ordinary (W-2) income if you actively participate and your MAGI is under $100k (phasing out to $0 by $150k); unused losses carry forward. On sale, claimed depreciation is recaptured at up to 25%, and gains may owe capital-gains tax (a 1031 exchange can defer both). Figures are a year-1 estimate at your 24.0% rate — not tax advice; consult a CPA.
Schools (NCES district)
- District
- North East ISD
- NCES district ID
- 4832940
- Math proficiency
- 38% ▼ -14.00%
- Reading proficiency
- 49% ▼ -4.00%
- Median HH income
- $57,715
- Composite
- 38.1/100
- National rank
- #4276
- State rank
- #276 of 826 in TX
Livability — San Antonio
- Score
- 80/100
- State rank
- #31
- US rank
- #1616
Category grades
Schools grade is shown separately in the Schools card above.
Census & demographics
- Census place
- San Antonio, TX
- County
- Bexar County · 1,990,555 people
- City population
- 1,806,925
- Metro
- San Antonio-New Braunfels, TX
- Population (ZIP)
- 40,526
- Household income
- $55,884
- Rent vs Own
- Severe rent burden
- 2375.0
Population outlook (Bexar County) Hauer SSP2
- Today (2025)
- 2,336,851 people
- By 2030
- 2,560,728 · +9.6%
- By 2040
- 3,020,569 · +29.3%
- By 2050
- 3,493,522 · +49.5%
- By 2075
- 4,668,459 · +99.8%
- By 2100
- 5,533,242 · +136.8%
Race, ethnicity, and origin ACS 2023
- Neighborhood character
- Predominantly Hispanic (73%)
- Race & ethnicity
- Hispanic / Latino 73% Two or more races 45% White 19% Black 4% Asian 1%
- Hispanic origin (detail)
- Mexican 63%
- Common ancestry
- Slovak 1% Lithuanian 1% Romanian 1%
- Foreign-born
- 18% · Canada
- Languages at home
- 54% English-only · Spanish 44%
Political lean MEDSL · Bexar
- 2024 margin
- Lean D (+9.8) · D 54.3% · R 44.6% · Other 1.1%
- 2008→2024 swing
- +4.2pp toward D · 2008: 5.6pp · 2024: 9.8pp
- All cycles
- 2024: D+9.8 2020: D+18.2 2016: D+13.5 2012: D+4.6 2008: D+5.6
Not yet ingested
- Civics
- —
Market trends
- HPI YoY
- ▼ -155.64%
- Current HPI
- 238.7889
- Rent YoY
- ▼ -7.31%
- Metro
- San Antonio-New Braunfels, TX
- State GDP YoY
- ▲ 3.95%
- F500 in state
- 110
Industry mix (Fortune 500 HQ in TX)
| Industry | F500 HQs | Revenue |
|---|---|---|
| Energy | 16 | $1,198B |
|
||
| Technology | 5 | $198B |
|
||
| Engineering / Construction | 4 | $72B |
|
||
| Energy Services | 3 | $60B |
|
||
| Utilities | 3 | $41B |
|
||
| Healthcare | 2 | $330B |
|
||
Price history
1 event — show timeline
- 2026-05-26 Listed $135,800 FSBO.com
Property tax history
+4.1%/yrLatest (2025): $4,195 · -3.4% YoY. Source: county tax records.
Cash-flow waterfall
monthlySold comps — $/sqft
last 12 mo · ≤1 miLoading sold comps…