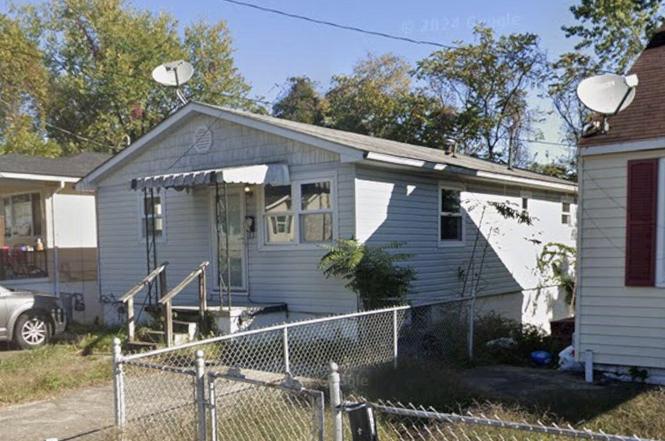
236 Clem St · Huntington, WV
Flood risk 1/10 · Minimal
- FEMA flood zone
- X (unshaded)
- Chance of flooding over 30 yrs
- 0.0%
- Est. flood insurance / yr
- $473 – $860
Fire risk 3/10 · Minor
- Est. fire insurance / yr
- $787 – $1,461
Heat risk 4/10 · Minor
- Hot days now (above 102°F)
- 7 days/yr
- Hot days in 30 yrs
- 18 days/yr
Wind risk 2/10 · Minimal
- Chance of severe wind over 30 yrs
- 1.0%
Air-quality risk 2/10 · Minimal
- Unhealthy air days now
- 0 days/yr
- Unhealthy air days in 30 yrs
- 1 days/yr
Risk factors via First Street. Map © Google.
Why this score? — see what drove the B- grade
The composite is a weighted blend of 9 inputs, each scored 0–100. Each bar is that input's sub-score; the figure is the points it added to the 100-point composite (weight × sub-score).
- Cash flow +30.0/30.0
- 1% rule +10.0/10.0
- DSCR +10.0/10.0
- ARV discount +7.5/15.0
- Livability +4.0/5.0
- Schools +3.0/10.0
- Rent growth +2.5/5.0
- Condition / age +2.5/5.0
- Appreciation +0.0/10.0
$45,900
🖨 Deal sheet 📄 Offer letter ✓ Due diligence
Listing remarks
Huntingon, WV 3 bedroom 1 bath home with full basement, new carpet and paint.
Key facts
- Built 1973
- Listed 226 days
Property features AI
Exterior
- Home design: Residential property
- Construction: Concrete perimeter foundation
- Exterior features: Shingle roof
Interior
- Flooring: Carpet; Vinyl; Laminate
- Bathrooms: 1 full bathroom
- Heating & cooling: Central air conditioning; Forced air heating
- Interior features: Laminate countertops; 6 total rooms
Neighborhood map
What this means for you Summary
Snapshot
- This is a 3-bed/1.0-bath single-family listed at $46k.
Deal economics
- At list price, monthly cash flow is $687 ($8k/yr) — positive.
- The deal already cash-flows at list — no discount required.
- Meets the 1% rule at list price ($1k rent vs $46k).
- Recommended offer: $40k (12.0% below list) — sets the bar for market timing.
- Cap rate 24.3% vs local median 6.5% in Huntington — top-decile yield for the area; either an underpriced asset or a hidden risk that comps aren't pricing in. Stress-test before assuming the spread holds.
Location & tenants
- Location reads 79/100 on livability (#16 in WV, #2,045 nationally) — a middle-class / working-renter tenant base. Strengths: amenities A+, commute A+, cost of living A+; Watch: schools C-, crime F, employment F.
- Cabell County Schools (urban): math 31% / reading 42% proficiency, ranked #13 of 55 in WV (top 24%) — families likely to look elsewhere, expect single-tenant / working-renter base with shorter leases.
- Market conditions: 163 active listings in the ZIP; 61 units permitted in Cabell County in 2024 (5 in 5+ unit buildings).
Forward outlook
- Local home prices are declining (-3.0%/yr); year-one equity from $317 of loan paydown is wiped out by about $1k of value loss. Plan a longer hold.
- At projected returns (-3.0% appreciation + 3.0% rent growth), your $13k cash investment doubles in ~2 years — after that, you're playing with house money.
Negotiation context
- It's been on market 227 days — a 12% lower offer ($40k) is reasonable based on typical stale-listing flexibility.
Questions for the listing agent
- It's been on market 227 days. Have you received any prior offers? Is the seller open to a 12% concession, seller financing, or rate buy-down credit?
- Built in 1973 — when were the roof, HVAC, electrical panel, plumbing, and water heater last replaced?
- Why hasn't it sold? Are there any deal-killer items the seller is aware of (foundation, flood, title, zoning, code violations)?
- Is there a deadline driving the sale (1031 exchange, divorce, estate, relocation)? That informs how much negotiation room exists.
- Crime grade is F in this area — have there been break-ins, vandalism, or insurance claims at this property in the last 3 years? What carrier currently insures it and at what premium?
- What's the average days-on-market for RENTAL listings here right now (not sales)? A rising rental-DOM trend means longer vacancies and softer asking-rent achievability than the comps imply.
- What's the recent tenant-quality profile in this submarket — average credit score on applications, eviction rate, late-payment / NSF rate, and stable-employment percentage? A property-management company in the area should have these aggregated.
- How much new for-sale + rental construction is in the pipeline within 1–3 miles? Heavy new supply typically softens prices + rents 12–24 months out; constrained supply supports both.
Investment metrics
- 1% rule
- 2.86% ✓
- Cap rate
- 24.27%
- Cash-on-cash
- 64.19%
- DSCR
- 3.86
- GRM
- 2.9
CMA / ARV
- ARV (on-the-fly)
- $95,040
- Comps found
- 12
Show comp detail 12 sales within ~0.75 mi
| Address | Dist | Beds/Ba | Sqft | Sold | Price | $/sf | Match |
|---|---|---|---|---|---|---|---|
| 117 Morris St | 0.21mi | 2/1.0 (-1) | 1,008 (+5%) | 6mo | $50,000 | $50 | 72 |
| 2923 Moreland Ave | 0.15mi | 4/2.0 (+1) | 1,040 (+8%) | 0mo | $119,000 | $114 | 70 |
| 103 Rotary Rd | 0.24mi | 3/1.0 | 864 (-10%) | 10mo | $45,000 | $52 | 64 |
| 417 Rotary Rd | 0.18mi | 3/1.0 | 1,077 (+12%) | 12mo | $85,000 | $79 | 61 |
| 3054 Wallace Cir | 0.36mi | 3/2.0 | 912 (-5%) | 13mo | $170,000 | $186 | 60 |
| 2953 Jarrell St | 0.13mi | 4/1.5 (+1) | 1,074 (+12%) | 11mo | $140,000 | $130 | 58 |
| 453 Linden Circle Cir | 0.37mi | 2/1.0 (-1) | 864 (-10%) | 5mo | $32,000 | $37 | 57 |
| 1209 26th St | 0.68mi | 2/1.0 (-1) | 940 (-2%) | 8mo | $100,000 | $106 | 53 |
| 402 Rotary Rd | 0.14mi | 2/1.0 (-1) | 1,101 (+15%) | 13mo | $108,500 | $99 | 53 |
| 505 Oney Ave | 0.40mi | 3/1.0 | 839 (-13%) | 10mo | $35,000 | $42 | 53 |
| 174 Oney Ave | 0.55mi | 2/1.0 (-1) | 1,030 (+7%) | 14mo | $29,000 | $28 | 45 |
| 118 South Walnut St | 0.70mi | 2/1.0 (-1) | 816 (-15%) | 1mo | $127,900 | $157 | 37 |
Match score weights: distance 35% · size 25% · config 20% · recency 20%. Top-matched comps best support the ARV.
Projected returns pro-forma
-3.0% appreciation · 3.0% rent growth · sell at horizon
- IRR
- 63.3%
- Equity multiple
- 3.83×
- Total profit
- $36,385
- Equity at exit
- $6,844
- IRR
- 67.8%
- Equity multiple
- 7.86×
- Total profit
- $88,220
- Equity at exit
- $3,969
Cash invested: $12,852 (down + closing). Projections, not guarantees.
Landlord ↔ Tenant lean methodology
- Overall (STATE)
- 83 Strongly Landlord-Friendly
- State West Virginia
- 83 Strongly Landlord-Friendly · R+22
- County
- — inherits STATE
- City
- — inherits STATE
ZIP-level market 25705
- Home prices YoY
- -24.9%
- Active inventory
- 163
- Price-to-rent
- 2.9×
Monthly cashflow live
- Estimated rent
- $1,311 medium interval (Pro) →
- Mortgage (P&I)
- −$241
- Tax from tax record
- −$88 /mo · $1,061/yr
- Insurance
- −$19
- HOA
- −$0
- Vacancy / Maint / Mgmt
- −$275
- Net cashflow
- $687
Break-even live
UW: 25.0% down · 7.5% · 30yr · 1.5% tax · 5.0% vac · 8.0% maint · 8.0% mgmt
Financing live
Cash to close
- Down payment
- $11,475
- Closing costs
- $1,377
- Reserves months
- —
- Total cash needed
- —
Loan-product check · same deal, 3 products live
Conventional
25% down · 7.5% · 30yr
- Down + closing
- —
- Monthly P&I
- —
- Monthly cashflow
- —
- DSCR
- —
- Eligible?
- —
Personal DTI + credit; lowest rate.
DSCR
20% down · 8.5% · 30yr
- Down + closing
- —
- Monthly P&I
- —
- Monthly cashflow
- —
- DSCR
- —
- Eligible?
- —
No personal income docs; deal must DSCR.
Hard money
10% down · 12.0% · 12mo
- Down + closing
- —
- Monthly P&I
- —
- Monthly cashflow
- —
- DSCR
- —
- Eligible?
- —
Short-term bridge; refi at stabilization.
Listing history 22 events
-
2026-06-19days on market $45,900 Active 227 DOM
-
2026-06-18days on market $45,900 Active 226 DOM
-
2026-06-17days on market $45,900 Active 225 DOM
-
2026-06-16days on market $45,900 Active 224 DOM
-
2026-06-15days on market $45,900 Active 223 DOM
-
2026-06-14days on market $45,900 Active 221 DOM
-
2026-06-12days on market $45,900 Active 220 DOM
-
2026-06-09days on market $45,900 Active 217 DOM
-
2026-06-08days on market $45,900 Active 216 DOM
-
2026-06-07days on market $45,900 Active 215 DOM
-
2026-06-05days on market $45,900 Active 212 DOM
-
2026-06-03days on market $45,900 Active 211 DOM
-
2026-06-02days on market $45,900 Active 210 DOM
-
2026-06-01days on market $45,900 Active 209 DOM
-
2026-05-31days on market $45,900 Active 208 DOM
-
2026-05-30days on market $45,900 Active 207 DOM
-
2026-04-30price $45,900
-
2026-03-21price $49,900
-
2026-02-13price $52,900
-
2026-01-01price $59,900
-
2025-12-09price $62,900
-
2025-11-05$65,900 Active
ⓘ Source: listings_history table (triggers on properties + properties_extension) + one-shot
backfill from property_details.listing_events for pre-trigger history.
Tax reassessment forecast WV · Resets to sale price
- Current annual tax
- $1,061 · $88/mo
- Projected year-2 tax
- $1,061 · $88/mo
- Expected delta
- $0/yr ($0/mo · 0.0%)
ⓘ Screening estimate from a state-policy table — verify with the county assessor before closing.
Climate risk First Street
- Flood 1/10 Low FEMA zone X (unshaded) · 0% chance over 30 yrs
- Wildfire 3/10 Moderate
- Heat 4/10 Moderate 7 d/yr ≥102°F today · 18 d/yr by 30 yrs out
- Wind 2/10 Low 100% chance of damaging wind over 30 yrs
- Air quality 2/10 Low 0 unhealthy d/yr today · 1 by 30 yrs out
Nearby sold comps map
Loading sold comps map…
Walkable amenities ~0.75 mi
Loading nearby amenities…
Taxation est. · year 1
- Rental income
- $15,733
- − Mortgage interest
- −$2,571
- − Property taxes
- −$1,061
- − Insurance
- −$230
- − Repairs & maintenance
- −$1,259
- − Management
- −$1,259
- − Depreciation
- −$1,335
- Taxable income
- $8,018
- Est. tax owed @ 24.0%
- −$1,924
- After-tax cash flow
- $6,325/yr
For passive investors: Depreciation is non-cash, so a rental often shows a tax loss while cash-flowing — sheltering income. Rental losses are passive: they offset passive income freely, and up to $25,000/yr can offset ordinary (W-2) income if you actively participate and your MAGI is under $100k (phasing out to $0 by $150k); unused losses carry forward. On sale, claimed depreciation is recaptured at up to 25%, and gains may owe capital-gains tax (a 1031 exchange can defer both). Figures are a year-1 estimate at your 24.0% rate — not tax advice; consult a CPA.
Schools (NCES district)
- District
- Cabell County Schools
- NCES district ID
- 5400180
- Math proficiency
- 31% ▼ -7.00%
- Reading proficiency
- 42% ▼ -6.00%
- Median HH income
- $36,426
- Composite
- 30.26/100
- National rank
- #6285
- State rank
- #13 of 55 in WV
Livability — Huntington
- Score
- 79/100
- State rank
- #16
- US rank
- #2045
Category grades
Schools grade is shown separately in the Schools card above.
Census & demographics
- Census place
- Huntington, WV
- City population
- 25,795
- Population (ZIP)
- 20,668
Population outlook (Cabell County) Hauer SSP2
- Today (2025)
- 97,574 people
- By 2030
- 98,060 · +0.5%
- By 2040
- 98,817 · +1.3%
- By 2050
- 100,185 · +2.7%
- By 2075
- 105,895 · +8.5%
- By 2100
- 105,948 · +8.6%
Race, ethnicity, and origin ACS 2023
- Neighborhood character
- Predominantly White (89%)
- Race & ethnicity
- White 89% Black 5% Two or more races 4% Hispanic / Latino 2% Asian 1%
- Common ancestry
- Slovak 3% Serbian 2% Lithuanian 2%
- Foreign-born
- 2%
- Languages at home
- 97% English-only · Spanish 1%
Political lean MEDSL · Cabell
- 2024 margin
- Strong R (+21.9) · D 38.0% · R 59.9% · Other 2.0%
- 2008→2024 swing
- -11.8pp toward R · 2008: -10.1pp · 2024: -21.9pp
- All cycles
- 2024: R+21.9 2020: R+18.0 2016: R+25.5 2012: R+13.9 2008: R+10.1
Not yet ingested
- Civics
- —
Market trends
- HPI YoY
- ▼ -57.08%
- Current HPI
- 171.7797
- Rent YoY
- —
- Metro
- —
- State GDP YoY
- —
- F500 in state
- 0
Price history
-30.3% since first listed6 events — show timeline
- 2026-04-30 Price Changed $45,900 GVBOR
- 2026-03-21 Price Changed $49,900 GVBOR
- 2026-02-13 Price Changed $52,900 GVBOR
- 2026-01-01 Price Changed $59,900 GVBOR
- 2025-12-09 Price Changed $62,900 GVBOR
- 2025-11-05 Listed $65,900 GVBOR
Property tax history
+15.6%/yrLatest (2025): $1,061 · +37.8% YoY. Source: county tax records.
Cash-flow waterfall
monthlySold comps — $/sqft
last 12 mo · ≤1 miLoading sold comps…