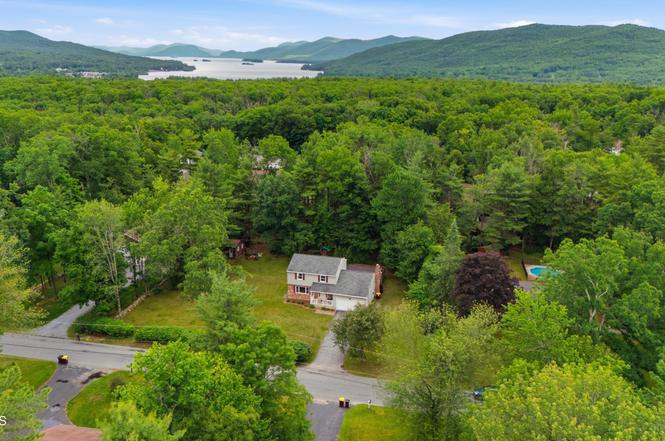
32 Kings Rd · Lake George, NY
Flood risk 1/10 · Minimal
- FEMA flood zone
- —
- Chance of flooding over 30 yrs
- 0.0%
- Est. flood insurance / yr
- —
Fire risk 4/10 · Minor
- Est. fire insurance / yr
- $691 – $1,283
Heat risk 2/10 · Minimal
- Hot days now (above 93°F)
- 8 days/yr
- Hot days in 30 yrs
- 18 days/yr
Wind risk 2/10 · Minimal
- Chance of severe wind over 30 yrs
- 2.0%
Air-quality risk 1/10 · Minimal
- Unhealthy air days now
- 0 days/yr
- Unhealthy air days in 30 yrs
- 0 days/yr
Risk factors via First Street. Map © Google.
Why this score? — see what drove the F grade
The composite is a weighted blend of 9 inputs, each scored 0–100. Each bar is that input's sub-score; the figure is the points it added to the 100-point composite (weight × sub-score).
- Appreciation +10.0/10.0
- Cash flow +7.0/30.0
- Schools +6.1/10.0
- Livability +3.2/5.0
- Rent growth +2.5/5.0
- Condition / age +2.5/5.0
- DSCR +1.2/10.0
- 1% rule +1.0/10.0
- ARV discount +0.6/15.0
$539,000
🖨 Deal sheet 📄 Offer letter ✓ Due diligence
Listing remarks MLS
You simply must look inside this beautifully updated and lovingly maintained 4bd/2ba home. Gorgeous shiplap accents, new appliances, newly renovated bathrooms, and tile flooring just begin the list of extensive upgrades. But it's the eye for calm hues and textured accents, such as the lighting fixtures and fireplace, that make this home so inviting. Set that upon almost an acre of privacy within a quiet neighborhood, add a huge 3 season porch, a gorgeous freshly stained deck, and mature landscaping, and you've got a perfect home! Don't keep it to yourself, though; the lovely, spacious guest suite makes this a perfect home to enjoy summers in Lake George and winters skiing the Adirondacks with all of your favorite people. Don't miss this one!
Key facts
- Three-season room
- Large lot
- Eat-in kitchen
Tags
Property features AI
Exterior
- Parking: Attached 2-car garage; Total parking for up to 6 vehicles; Off-street paved driveway
- Utilities: Septic tank
- Home design: Single-family residence; Living area with additional finished below-grade space
- Construction: Vinyl siding
- Exterior features: Screened porch; Deck; Front porch; Paved driveway; Paved drive; Garden; Shed(s); Level, landscaped lot (approximately 0.83 acre)
Interior
- Kitchen: Dishwasher; Oven; Range; Refrigerator
- Bedrooms: Primary bedroom on second level; Three additional bedrooms on second level
- Flooring: Tile; Carpet; Hardwood
- Bathrooms: Two full bathrooms (one on first level, one on second level)
- Heating & cooling: Hot water baseboard heating
- Interior features: High-speed internet; Radon mitigation system; Full finished basement with interior entry and heating; One fireplace (main level)
- Laundry & utility: Washer and dryer (located in basement)
Neighborhood map
What this means for you Summary
Snapshot
- This is a 4-bed/1.5-bath single-family listed at $539k.
Deal economics
- At list price, monthly cash flow is $-791 ($-9k/yr) — negative.
- To cash-flow at today's rent, offer at most $399k (25.9% below list).
- To meet the 1% rule (rent ≥ 1% of price), the offer needs to be $325k (39.7% below list).
- Recommended offer: $325k (39.7% below list) — sets the bar for 1% rule.
- Cap rate 4.5% vs local median 2.8% in Lake George — top-decile yield for the area; either an underpriced asset or a hidden risk that comps aren't pricing in. Stress-test before assuming the spread holds.
Location & tenants
- Location reads 63/100 on livability (#788 in NY) — a middle-class / working-renter tenant base. Watch: employment C-, cost of living D+, crime D.
- Lake George Central School District (rural): math 68% / reading 73% proficiency, ranked #131 of 590 in NY (top 22%) — strong family-tenant draw, lease renewals of 3-5y typical; only 17% free/reduced lunch — higher-income household profile.
- Zoned schools: Lake George Elementary School (math 62% / reading 82%, grade A-, #378 of 2,108 statewide, top 20%, 300 students, 24% FRL); Lake George Junior-Senior High School (math 72% / reading 62%, grade B, #746 of 1,100 statewide, top 69%, 330 students, 19% FRL) — zoned schools at 22% FRL track the district average.
- Market conditions: 110 active listings in the ZIP; 180 units permitted in Warren County in 2024 (40 in 5+ unit buildings).
Forward outlook
- In year one you build about $58k of equity ($4k loan paydown + $54k appreciation (10.0% local appreciation)).
- Warren County population projected at -19% by 2050 — secular population decline; favor cash flow + early exit over multi-decade hold.
- By year 2, paydown + projected appreciation supports a ~$93k cash-out refi (75% LTV) — recoverable capital for the next deal without selling this one.
Negotiation context
- Only 3 days on market — expect competitive offers; lowballing is unlikely to land.
- 3 sale attempts since 13y ago with the ask held roughly flat each time — persistent listings suggest the price (not the market) is what's stuck; bring a comps-based counter.
- Current owner paid $435k; 24% above their basis — modest negotiation headroom, anchor on the comps not their cost.
Questions for the listing agent
- What do current leases actually rent for vs. the listed asking? Can we see a recent rent roll and the last 12 months of T-12 income?
- Built in 1972 — when were the roof, HVAC, electrical panel, plumbing, and water heater last replaced?
- Is there a deadline driving the sale (1031 exchange, divorce, estate, relocation)? That informs how much negotiation room exists.
- Schools are B-rated — typically a magnet for longer-tenancy family renters. What's the average tenant stay here, and is there a school-zone premium baked into asking?
- Crime grade is D in this area — have there been break-ins, vandalism, or insurance claims at this property in the last 3 years? What carrier currently insures it and at what premium?
- The area grade is low — what's the realistic commute time and amenity access for the typical tenant pool here? Any planned neighborhood developments (good or bad) we should know about?
- What's the average days-on-market for RENTAL listings here right now (not sales)? A rising rental-DOM trend means longer vacancies and softer asking-rent achievability than the comps imply.
- What's the recent tenant-quality profile in this submarket — average credit score on applications, eviction rate, late-payment / NSF rate, and stable-employment percentage? A property-management company in the area should have these aggregated.
- How much new for-sale + rental construction is in the pipeline within 1–3 miles? Heavy new supply typically softens prices + rents 12–24 months out; constrained supply supports both.
Investment metrics
- 1% rule
- 0.60% ✗
- Cap rate
- 4.53%
- Cash-on-cash
- -6.29%
- DSCR
- 0.72
- GRM
- 13.8
CMA / ARV
- ARV (on-the-fly)
- $467,613
- Comps found
- 1
Show comp detail 1 sale within ~0.75 mi
| Address | Dist | Beds/Ba | Sqft | Sold | Price | $/sf | Match |
|---|---|---|---|---|---|---|---|
| 60 Morgan Ct | 0.11mi | 4/2.5 | 1,696 (-9%) | 9mo | $425,000 | $251 | 69 |
Match score weights: distance 35% · size 25% · config 20% · recency 20%. Top-matched comps best support the ARV.
Projected returns pro-forma
10.0% appreciation · 3.0% rent growth · sell at horizon
- IRR
- 19.8%
- Equity multiple
- 2.61×
- Total profit
- $242,969
- Equity at exit
- $485,574
- IRR
- 18.2%
- Equity multiple
- 6.00×
- Total profit
- $754,798
- Equity at exit
- $1,047,158
Cash invested: $150,920 (down + closing). Projections, not guarantees.
Landlord ↔ Tenant lean methodology
- Overall (STATE)
- 15 Strongly Tenant-Friendly
- State New York
- 15 Strongly Tenant-Friendly · D+10
- County
- — inherits STATE
- City
- — inherits STATE
ZIP-level market 12845
- Home prices YoY
- 3.5%
- Active inventory
- 110
- Price-to-rent
- 13.8×
Monthly cashflow live
- Estimated rent
- $3,252 medium interval (Pro) →
- Mortgage (P&I)
- −$2,827
- Tax from tax record
- −$310 /mo · $3,717/yr
- Insurance
- −$225
- HOA
- −$0
- Vacancy / Maint / Mgmt
- −$683
- Net cashflow
- $-791
Break-even live
UW: 25.0% down · 7.5% · 30yr · 1.5% tax · 5.0% vac · 8.0% maint · 8.0% mgmt
Financing live
Cash to close
- Down payment
- $134,750
- Closing costs
- $16,170
- Reserves months
- —
- Total cash needed
- —
Loan-product check · same deal, 3 products live
Conventional
25% down · 7.5% · 30yr
- Down + closing
- —
- Monthly P&I
- —
- Monthly cashflow
- —
- DSCR
- —
- Eligible?
- —
Personal DTI + credit; lowest rate.
DSCR
20% down · 8.5% · 30yr
- Down + closing
- —
- Monthly P&I
- —
- Monthly cashflow
- —
- DSCR
- —
- Eligible?
- —
No personal income docs; deal must DSCR.
Hard money
10% down · 12.0% · 12mo
- Down + closing
- —
- Monthly P&I
- —
- Monthly cashflow
- —
- DSCR
- —
- Eligible?
- —
Short-term bridge; refi at stabilization.
Listing history 4 events
-
2026-06-18days on market $539,000 Active 3 DOM
-
2026-06-17days on market $539,000 Active 2 DOM
-
2026-06-16remarks 699-char remark
-
2026-06-16$539,000 Active 1 DOM
ⓘ Source: listings_history table (triggers on properties + properties_extension) + one-shot
backfill from property_details.listing_events for pre-trigger history.
Tax reassessment forecast NY · Partial reset (capped growth)
- Current annual tax
- $3,717 · $310/mo
- Projected year-2 tax
- $6,413 · $534/mo
- Expected delta
- +$2,696/yr (+$225/mo · 72.5%)
ⓘ Screening estimate from a state-policy table — verify with the county assessor before closing.
Climate risk First Street
- Flood 1/10 Low 0% chance over 30 yrs
- Wildfire 4/10 Moderate
- Heat 2/10 Low 8 d/yr ≥93°F today · 18 d/yr by 30 yrs out
- Wind 2/10 Low 2% chance of damaging wind over 30 yrs
- Air quality 1/10 Low 0 unhealthy d/yr today · 0 by 30 yrs out
Nearby sold comps map
Loading sold comps map…
Walkable amenities ~0.75 mi
Loading nearby amenities…
Taxation est. · year 1
- Rental income
- $39,029
- − Mortgage interest
- −$30,192
- − Property taxes
- −$3,717
- − Insurance
- −$2,695
- − Repairs & maintenance
- −$3,122
- − Management
- −$3,122
- − Depreciation
- −$15,680
- Taxable loss
- −$19,500
- Est. tax savings @ 24.0%
- +$4,680
- After-tax cash flow
- $-4,818/yr
For passive investors: Depreciation is non-cash, so a rental often shows a tax loss while cash-flowing — sheltering income. Rental losses are passive: they offset passive income freely, and up to $25,000/yr can offset ordinary (W-2) income if you actively participate and your MAGI is under $100k (phasing out to $0 by $150k); unused losses carry forward. On sale, claimed depreciation is recaptured at up to 25%, and gains may owe capital-gains tax (a 1031 exchange can defer both). Figures are a year-1 estimate at your 24.0% rate — not tax advice; consult a CPA.
Schools (NCES district)
- District
- Lake George Central School District
- NCES district ID
- 3616470
- Math proficiency
- 68% ▼ -8.00%
- Reading proficiency
- 73% ▲ 9.00%
- Median HH income
- $65,873
- Composite
- 61.29/100
- National rank
- #777
- State rank
- #131 of 590 in NY
Livability — Lake George
- Score
- 63/100
- State rank
- #788
- US rank
- #15111
Category grades
Schools grade is shown separately in the Schools card above.
Census & demographics
- Population (ZIP)
- 4,389
Population outlook (Warren County) Hauer SSP2
- Today (2025)
- 62,372 people
- By 2030
- 60,491 · -3.0%
- By 2040
- 55,616 · -10.8%
- By 2050
- 50,437 · -19.1%
- By 2075
- 40,843 · -34.5%
- By 2100
- 31,159 · -50.0%
Race, ethnicity, and origin ACS 2023
- Neighborhood character
- Predominantly White (92%)
- Race & ethnicity
- White 92% Hispanic / Latino 5% Two or more races 3% Black 1%
- Common ancestry
- Lithuanian 7% Italian 4% Iranian 3%
- Foreign-born
- 2% · Canada
- Languages at home
- 96% English-only · Spanish 2% French/Haitian/Cajun 1% Other Indo-European 1%
Political lean MEDSL · Warren
- 2024 margin
- Toss-up / Even · D 47.9% · R 52.1%
- 2008→2024 swing
- -6.9pp toward R · 2008: 2.6pp · 2024: -4.2pp
- All cycles
- 2024: R+4.2 2020: R+0.2 2016: R+10.6 2012: D+2.1 2008: D+2.6
Not yet ingested
- Civics
- —
Market trends
- HPI YoY
- ▲ 12.18%
- Current HPI
- 364.9782
- Rent YoY
- —
- Metro
- —
- State GDP YoY
- ▲ 2.60%
- F500 in state
- 92
Industry mix (Fortune 500 HQ in NY)
| Industry | F500 HQs | Revenue |
|---|---|---|
| Financial Services | 10 | $950B |
|
||
| Consumer Goods | 9 | $162B |
|
||
| Insurance | 4 | $225B |
|
||
| Telecommunications | 2 | $144B |
|
||
| Pharmaceuticals | 2 | $112B |
|
||
| Media / Entertainment | 2 | $69B |
|
||
Price history
+236.9% since first listed10 events — show timeline
- 2026-06-15 Listed $539,000 Global MLS
- 2022-11-03 Sold (Public Records) $435,000 Public Records
- 2022-10-28 Sold (MLS) $435,000 Global MLS
- 2022-09-16 Pending — Global MLS
- 2022-09-12 Listed $425,000 Global MLS
- 2021-09-13 Sold (Public Records) $45,000 Public Records
- 2019-03-01 Listing Removed — Global MLS
- 2015-04-17 Sold (Public Records) $254,000 Public Records
- 2013-09-01 Listed $279,000 Global MLS
- 1996-06-27 Sold (Public Records) $160,000 Public Records
Property tax history
+3.6%/yrLatest (2025): $3,717 · +11.6% YoY. Source: county tax records.
Cash-flow waterfall
monthlySold comps — $/sqft
last 12 mo · ≤1 miLoading sold comps…