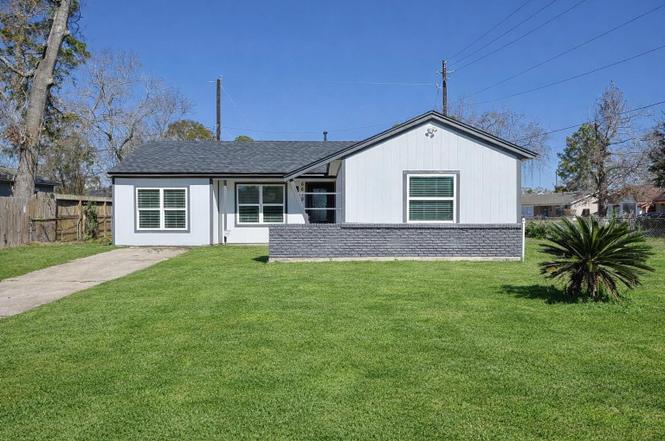
6619 Cobalt St · Houston, TX
Flood risk 5/10 · Moderate
- FEMA flood zone
- X (unshaded)
- Chance of flooding over 30 yrs
- 0.66%
- Est. flood insurance / yr
- $507 – $1,088
Fire risk 3/10 · Minor
- Est. fire insurance / yr
- $1,222 – $2,270
Heat risk 9/10 · Severe
- Hot days now (above 110°F)
- 7 days/yr
- Hot days in 30 yrs
- 24 days/yr
Wind risk 9/10 · Severe
- Chance of severe wind over 30 yrs
- 99.0%
Air-quality risk 3/10 · Minor
- Unhealthy air days now
- 3 days/yr
- Unhealthy air days in 30 yrs
- 3 days/yr
Risk factors via First Street. Map © Google.
Why this score? — see what drove the D grade
The composite is a weighted blend of 9 inputs, each scored 0–100. Each bar is that input's sub-score; the figure is the points it added to the 100-point composite (weight × sub-score).
- Cash flow +13.3/30.0
- Appreciation +9.3/10.0
- DSCR +4.0/10.0
- Livability +3.7/5.0
- 1% rule +3.4/10.0
- Schools +2.7/10.0
- Rent growth +2.6/5.0
- Condition / age +2.5/5.0
- ARV discount +0.2/15.0
$190,000
🖨 Deal sheet (PDF) 📄 Offer letter ✓ Due diligence
Listing remarks
Fully remodeled and move-in ready, this beautifully updated home offers modern finishes and peace of mind with all the major systems already done. Recent upgrades include a brand-new roof, new HVAC system, and a new electrical panel. Inside, you’ll love the open-concept layout featuring a spacious living area that flows seamlessly into the kitchen, complete with a full gas range, large island, stylish farmhouse sink, a Double Rainfall Shower and remodeled bathroom, and modern finishes-perfect for entertaining or everyday living.
Key facts
- Large island
- New electrical panel
- Full gas range
Tags
Neighborhood map
What this means for you Summary
Snapshot
- This is a 2-bed/1.0-bath single-family listed at $190k.
Deal economics
- At list price, monthly cash flow is $-2 ($-19/yr) — negative.
- To cash-flow at today's rent, offer at most $190k (0.1% below list).
- To meet the 1% rule (rent ≥ 1% of price), the offer needs to be $161k (15.5% below list).
- Recommended offer: $161k (15.5% below list) — sets the bar for 1% rule.
- Cap rate 6.3% vs local median 3.2% in Houston — top-decile yield for the area; either an underpriced asset or a hidden risk that comps aren't pricing in. Stress-test before assuming the spread holds.
Location & tenants
- Location reads 74/100 on livability (#184 in TX, #4,771 nationally) — a middle-class / working-renter tenant base. Strengths: amenities A+, cost of living A+, housing A+; Watch: crime F.
- Houston ISD (urban): math 27% / reading 35% proficiency, ranked #593 of 826 in TX (top 72%) — families likely to look elsewhere, expect single-tenant / working-renter base with shorter leases; 71% free/reduced lunch — lower-income household profile, screen leases tightly.
- Zoned schools: Forest Brook Middle (math 12% / reading 14%, grade F, #1,609 of 1,662 statewide, top 97%, 613 students, 98% FRL); North Forest H S (math 13% / reading 18%, grade F, #1,505 of 1,632 statewide, top 92%, 974 students, 97% FRL) — zoned schools average 98% FRL vs 71% district-wide (27 pts higher); higher-poverty schools than district average — tighter screening recommended.
- Zoned-school proficiency averages 14% at this address vs 31% district-wide (-17 pts) — the specific schools serving this property underperform the Houston ISD average; the district grade overstates school quality for this exact location.
- Market conditions: Rents flat; 376 active listings in the ZIP; 8 comparable units currently listed for rent nearby; rentals at typical pace (median 23d on market — plan ~3-4 weeks tenant-placement turnaround); 29,883 units permitted in Harris County in 2024 (8,621 in 5+ unit buildings).
Forward outlook
- In year one you build about $18k of equity ($1k loan paydown + $16k appreciation (8.7% local appreciation)).
- Harris County population projected at +47% by 2050 — long-run rental-demand tailwind backs the buy-and-hold thesis.
- At projected returns (8.7% appreciation + 0.4% rent growth), your $53k cash investment doubles in ~3 years — after that, you're playing with house money.
- By year 3, paydown + projected appreciation supports a ~$45k cash-out refi (75% LTV) — recoverable capital for the next deal without selling this one.
Negotiation context
- It's been on market 33 days — a 3% lower offer ($184k) is reasonable based on typical stale-listing flexibility.
- 4 sale attempts with the ask held roughly flat each time — persistent listings suggest the price (not the market) is what's stuck; bring a comps-based counter.
Risks & watch-outs
- Climate carrying-cost: moderate flood risk; severe wind risk, 99% chance of damaging wind over 30y; extreme-heat days projected 7→24/yr by 2055 (HVAC capex compounding) — expect insurance premiums to compound above CPI over the hold.
Questions for the listing agent
- What do current leases actually rent for vs. the listed asking? Can we see a recent rent roll and the last 12 months of T-12 income?
- It's been on market 33 days. Have you received any prior offers? Is the seller open to a 16% concession, seller financing, or rate buy-down credit?
- Built in 1960 — when were the roof, HVAC, electrical panel, plumbing, and water heater last replaced?
- Is there a deadline driving the sale (1031 exchange, divorce, estate, relocation)? That informs how much negotiation room exists.
- Schools are D-rated, which usually means shorter tenancies and higher turnover. Who's the typical renter profile here, and what's been the actual vacancy rate?
- Crime grade is F in this area — have there been break-ins, vandalism, or insurance claims at this property in the last 3 years? What carrier currently insures it and at what premium?
- The area grade is low — what's the realistic commute time and amenity access for the typical tenant pool here? Any planned neighborhood developments (good or bad) we should know about?
- What's the average days-on-market for RENTAL listings here right now (not sales)? A rising rental-DOM trend means longer vacancies and softer asking-rent achievability than the comps imply.
- What's the recent tenant-quality profile in this submarket — average credit score on applications, eviction rate, late-payment / NSF rate, and stable-employment percentage? A property-management company in the area should have these aggregated.
- How much new for-sale + rental construction is in the pipeline within 1–3 miles? Heavy new supply typically softens prices + rents 12–24 months out; constrained supply supports both.
Investment metrics
- 1% rule
- 0.84% ✗
- Cap rate
- 6.28%
- Cash-on-cash
- -0.04%
- DSCR
- 1.00
- GRM
- 9.9
CMA / ARV
- ARV (on-the-fly)
- $163,350
- Comps found
- 12
Show comp detail 12 sales within ~0.75 mi
| Address | Dist | Beds/Ba | Sqft | Sold | Price | $/sf | Match |
|---|---|---|---|---|---|---|---|
| 6330 Cobalt St | 0.26mi | 3/2.0 (+1) | 1,242 (+3%) | 1mo | $199,995 | $161 | 74 |
| 6411 Hartwick Rd | 0.16mi | 3/2.5 (+1) | 1,222 (+1%) | 8mo | $165,000 | $135 | 74 |
| 11151 Spottswood Dr | 0.29mi | 3/1.0 (+1) | 1,283 (+6%) | 1mo | $99,900 | $78 | 71 |
| 6622 Cobalt St | 0.03mi | 3/1.0 (+1) | 1,048 (-13%) | 1mo | $125,000 | $119 | 70 |
| 6319 Hopper Rd | 0.47mi | 3/2.5 (+1) | 1,188 (-2%) | 1mo | $110,000 | $93 | 63 |
| 11311 Raincove Dr | 0.53mi | 3/1.0 (+1) | 1,204 (-0%) | 9mo | $182,500 | $152 | 62 |
| 6130 Hartwick Rd | 0.42mi | 3/1.0 (+1) | 1,278 (+6%) | 5mo | $115,000 | $90 | 62 |
| 6611 Mohawk St | 0.47mi | 3/1.5 (+1) | 1,255 (+4%) | 6mo | $142,500 | $114 | 60 |
| 5930 Annunciation St | 0.68mi | 3/1.0 (+1) | 1,235 (+2%) | 0mo | $186,999 | $151 | 60 |
| 11011 Ledford Ln | 0.68mi | 3/1.5 (+1) | 1,203 (-1%) | 2mo | $170,000 | $141 | 59 |
| 6406 Guadalupe St | 0.25mi | 3/1.0 (+1) | 1,036 (-14%) | 6mo | $165,000 | $159 | 54 |
| 6110 Guadalupe St | 0.48mi | 3/1.5 (+1) | 1,336 (+10%) | 1mo | $120,000 | $90 | 52 |
Match score weights: distance 35% · size 25% · config 20% · recency 20%. Top-matched comps best support the ARV.
Projected returns pro-forma
8.65% appreciation · 0.44% rent growth · sell at horizon
- IRR
- 20.5%
- Equity multiple
- 2.54×
- Total profit
- $82,089
- Equity at exit
- $152,812
- IRR
- 18.2%
- Equity multiple
- 5.35×
- Total profit
- $231,361
- Equity at exit
- $311,780
Cash invested: $53,200 (down + closing). Projections, not guarantees.
Landlord ↔ Tenant lean methodology
- Overall (STATE)
- 87 Strongly Landlord-Friendly
- State Texas
- 87 Strongly Landlord-Friendly · R+5
- County
- — inherits STATE
- City
- — inherits STATE
ZIP-level market 77016
- Home prices YoY
- 2.8%
- Rents YoY
- 0.4%
- Active inventory
- 376
- Price-to-rent
- 9.9×
Monthly cashflow live
- Estimated rent
- $1,605 high interval (Pro) →
- Mortgage (P&I)
- −$996
- Tax from tax record
- −$194 /mo · $2,329/yr
- Insurance
- −$79
- HOA
- −$0
- Vacancy / Maint / Mgmt
- −$337
- Net cashflow
- $-2
Break-even live
Sensitivity live
| Price | -10% $106 | -5% $52 | +0% $-2 | +5% $-55 | +10% $-109 |
|---|---|---|---|---|---|
| Rent | -10% $-128 | -5% $-65 | +0% $-2 | +5% $62 | +10% $125 |
| Rate | -1.0pp $94 | -0.5pp $47 | base $-2 | +0.5pp $-51 | +1.0pp $-101 |
UW: 25.0% down · 7.5% · 30yr · 1.5% tax · 5.0% vac · 8.0% maint · 8.0% mgmt
Financing live
Cash to close
- Down payment
- $47,500
- Closing costs
- $5,700
- Reserves months
- —
- Total cash needed
- —
Loan-product check · same deal, 3 products live
Conventional
25% down · 7.5% · 30yr
- Down + closing
- —
- Monthly P&I
- —
- Monthly cashflow
- —
- DSCR
- —
- Eligible?
- —
Personal DTI + credit; lowest rate.
DSCR
20% down · 8.5% · 30yr
- Down + closing
- —
- Monthly P&I
- —
- Monthly cashflow
- —
- DSCR
- —
- Eligible?
- —
No personal income docs; deal must DSCR.
Hard money
10% down · 12.0% · 12mo
- Down + closing
- —
- Monthly P&I
- —
- Monthly cashflow
- —
- DSCR
- —
- Eligible?
- —
Short-term bridge; refi at stabilization.
Rent comps 8 comps
| Address | Beds | Baths | Sqft | Rent | $/sqft | DOM | Units | Dist |
|---|---|---|---|---|---|---|---|---|
| 11235 Lemond Dr Houston, TX | 3.0 | 1.0 | 1368 | $1,450 | $1.06 | 23d | 1 | 0.21mi |
| 11610 Danford Ln Unit B Houston, TX | 3.0 | 2.0 | 1150 | $1,750 | $1.52 | 44d | 1 | 0.50mi |
| 11435 Raincove Dr Unit A Houston, TX | 3.0 | 1.0 | 1000 | $1,345 | $1.34 | 5d | 1 | 0.55mi |
| 6823 Hanley Ln Houston, TX | 3.0 | 2.0 | 1303 | $1,610 | $1.24 | 6d | 1 | 0.57mi |
| 6822 Leedale St Houston, TX | 3.0 | 1.0 | 978 | $1,500 | $1.53 | 44d | 1 | 0.67mi |
| 10750 Nyla Spring St Houston, TX | 3.0 | 2.0 | 1500 | $1,975 | $1.32 | 19d | 1 | 1.00mi |
| 8003 Alpine Bearberry Dr Houston, TX | 3.0–4.0 | 2.0–2.5 | 1696 | $2,000 | $1.18 | 8d | 1 | 1.27mi |
| 10708 Lavender Cotton Ln Houston, TX | 3.0 | 2.0 | 1406 | $2,150 | $1.53 | 44d | 1 | 1.30mi |
Listing history 15 events
-
2026-05-04soldstatus
-
2026-04-16status Pending
-
2026-04-08status Pending
-
2026-03-30price $190,000
-
2026-03-23status Active
-
2026-03-08historical
-
2026-02-26$199,900 Active
-
2026-02-23historical
-
2026-02-22price $205,000
-
2026-02-19price $209,900
-
2026-02-05$215,000 Active
-
2025-10-28soldstatus
-
2025-10-08historical
-
2025-10-08$45,000 Active
-
1996-08-11soldstatus
ⓘ Source: listings_history table (triggers on properties + properties_extension) + one-shot
backfill from property_details.listing_events for pre-trigger history.
Tax reassessment forecast TX · Resets to sale price
- Current annual tax
- $2,329 · $194/mo
- Projected year-2 tax
- $3,477 · $290/mo
- Expected delta
- +$1,148/yr (+$96/mo · 49.3%)
ⓘ Screening estimate from a state-policy table — verify with the county assessor before closing.
Climate risk First Street
- Flood 5/10 Major FEMA zone X (unshaded) · 66% chance over 30 yrs
- Wildfire 3/10 Moderate
- Heat 9/10 Extreme 7 d/yr ≥110°F today · 24 d/yr by 30 yrs out
- Wind 9/10 Extreme 99% chance of damaging wind over 30 yrs
- Air quality 3/10 Moderate 3 unhealthy d/yr today · 3 by 30 yrs out
Nearby sold comps map
Loading sold comps map…
Walkable amenities ~0.75 mi
Loading nearby amenities…
Taxation est. · year 1
- Rental income
- $19,262
- − Mortgage interest
- −$10,643
- − Property taxes
- −$2,329
- − Insurance
- −$950
- − Repairs & maintenance
- −$1,541
- − Management
- −$1,541
- − Depreciation
- −$5,527
- Taxable loss
- −$3,270
- Est. tax savings @ 24.0%
- +$785
- After-tax cash flow
- $765/yr
For passive investors: Depreciation is non-cash, so a rental often shows a tax loss while cash-flowing — sheltering income. Rental losses are passive: they offset passive income freely, and up to $25,000/yr can offset ordinary (W-2) income if you actively participate and your MAGI is under $100k (phasing out to $0 by $150k); unused losses carry forward. On sale, claimed depreciation is recaptured at up to 25%, and gains may owe capital-gains tax (a 1031 exchange can defer both). Figures are a year-1 estimate at your 24.0% rate — not tax advice; consult a CPA.
Schools (NCES district)
- District
- Houston ISD
- NCES district ID
- 4823640
- Math proficiency
- 27% ▼ -18.00%
- Reading proficiency
- 35% ▼ -6.00%
- Median HH income
- $46,054
- Composite
- 26.63/100
- National rank
- #7173
- State rank
- #593 of 826 in TX
Livability — Houston
- Score
- 74/100
- State rank
- #184
- US rank
- #4771
Category grades
Schools grade is shown separately in the Schools card above.
Census & demographics
- Census place
- Houston, TX
- County
- Harris County · 4,702,590 people
- City population
- 3,226,434
- Metro
- Houston-The Woodlands-Sugar Land, TX
- Population (ZIP)
- 29,841
- Household income
- $47,677
- Rent vs Own
- Severe rent burden
- 1297.0
Population outlook (Harris County) Hauer SSP2
- Today (2025)
- 5,571,493 people
- By 2030
- 6,089,821 · +9.3%
- By 2040
- 7,142,806 · +28.2%
- By 2050
- 8,185,864 · +46.9%
- By 2075
- 10,574,329 · +89.8%
- By 2100
- 12,109,958 · +117.4%
Race, ethnicity, and origin ACS 2023
- Neighborhood character
- Majority Black (56%)
- Race & ethnicity
- Black 56% Hispanic / Latino 42% Two or more races 28%
- Hispanic origin (detail)
- Mexican 34%
- Foreign-born
- 18% · Canada
- Languages at home
- 61% English-only · Spanish 37%
Political lean MEDSL · Harris
- 2024 margin
- Lean D (+5.5) · D 52.0% · R 46.4% · Other 1.6%
- 2008→2024 swing
- +3.9pp toward D · 2008: 1.6pp · 2024: 5.5pp
- All cycles
- 2024: D+5.5 2020: D+13.3 2016: D+12.4 2012: D+0.1 2008: D+1.6
Not yet ingested
- Civics
- —
Market trends
- HPI YoY
- ▲ 8.65%
- Current HPI
- 315.6765
- Rent YoY
- ▲ 0.44%
- Metro
- Houston-The Woodlands-Sugar Land, TX
- State GDP YoY
- ▲ 3.95%
- F500 in state
- 110
Industry mix (Fortune 500 HQ in TX)
| Industry | F500 HQs | Revenue |
|---|---|---|
| Energy | 16 | $1,198B |
|
||
| Technology | 5 | $198B |
|
||
| Engineering / Construction | 4 | $72B |
|
||
| Energy Services | 3 | $60B |
|
||
| Utilities | 3 | $41B |
|
||
| Healthcare | 2 | $330B |
|
||
Price history
+322.2% since first listed15 events — show timeline
- 2026-05-04 Sold (Public Records) — Public Records
- 2026-04-16 Pending — HARMLS
- 2026-04-08 Pending — HARMLS
- 2026-03-30 Price Changed $190,000 HARMLS
- 2026-03-23 Relisted — HARMLS
- 2026-03-08 Listing Removed — HARMLS
- 2026-02-26 Listed $199,900 HARMLS
- 2026-02-23 Listing Removed — HARMLS
- 2026-02-22 Price Changed $205,000 HARMLS
- 2026-02-19 Price Changed $209,900 HARMLS
- 2026-02-05 Listed $215,000 HARMLS
- 2025-10-28 Sold (Public Records) — Public Records
- 2025-10-08 Listing Removed — HARMLS
- 2025-10-08 Listed $45,000 HARMLS
- 1996-08-11 Sold (Public Records) — Public Records
Property tax history
+3.8%/yrLatest (2025): $2,329 · -1.5% YoY. Source: county tax records.
Cash-flow waterfall
monthlySold comps — $/sqft
last 12 mo · ≤1 miLoading sold comps…