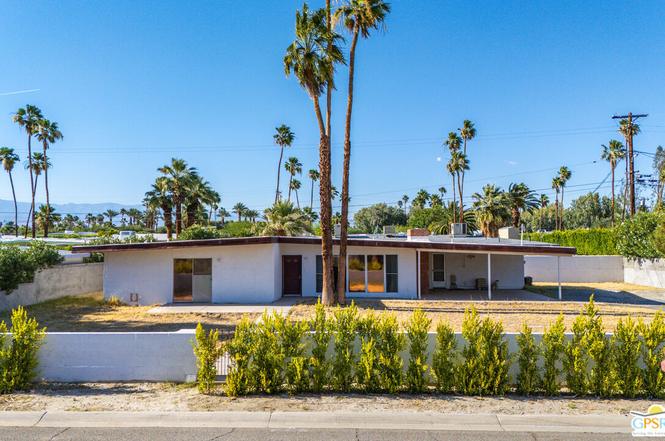
1166 Pasatiempo Rd · Palm Springs, CA
Flood risk 1/10 · Minimal
- FEMA flood zone
- X (unshaded)
- Chance of flooding over 30 yrs
- 0.0%
- Est. flood insurance / yr
- $507 – $1,088
Fire risk 2/10 · Minimal
- Est. fire insurance / yr
- $659 – $1,223
Heat risk 9/10 · Severe
- Hot days now (above 112°F)
- 8 days/yr
- Hot days in 30 yrs
- 22 days/yr
Wind risk 1/10 · Minimal
- Chance of severe wind over 30 yrs
- —
Air-quality risk 5/10 · Moderate
- Unhealthy air days now
- 6 days/yr
- Unhealthy air days in 30 yrs
- 8 days/yr
Risk factors via First Street. Map © Google.
Why this score? — see what drove the D grade
The composite is a weighted blend of 9 inputs, each scored 0–100. Each bar is that input's sub-score; the figure is the points it added to the 100-point composite (weight × sub-score).
- ARV discount +15.0/15.0
- Cash flow +11.6/30.0
- DSCR +3.4/10.0
- Livability +3.3/5.0
- Schools +2.7/10.0
- Rent growth +2.6/5.0
- Condition / age +2.5/5.0
- 1% rule +2.1/10.0
- Appreciation +0.0/10.0
$785,000
🖨 Deal sheet (PDF) 📄 Offer letter ✓ Due diligence
Listing remarks
Create the Palm Springs retreat you've always imagined in Movie Colony East - a neighborhood celebrated for its Hollywood history, iconic architecture, and walkable charm. Built in 1956, this classic mid-century fixer presents a rare opportunity to restore and reimagine a true desert retreat in one of the city's most sought-after locations. Set on a generous 10,454 sq. ft. lot with stunning south and west-facing mountain views, this 3-bedroom, 2-bath home spans approximately 1,827 sq. ft. and offers original character, clean mid-century lines, a classic brick fireplace, and an open layout ready for renovation and customization. A wall of windows could potentially be redesigned into expansiv
Key facts
- Mid-century fixer
- Open layout
- Desert retreat
Tags
Property features AI
Finance
- Other: Fee land lease type
Exterior
- Parking: Carport attached; Two covered parking spaces (total 2 parking spaces)
- Utilities: Sewer is connected and paid
- Home design: Detached single-family home; One level; Faces south; Fixer condition
- Construction: Stucco exterior; Foam roof; No other structures listed
- Exterior features: Front yard; Block wall fence; Mountain view
Interior
- Kitchen: Tile countertops
- Flooring: Tile floors
- Bathrooms: One full bathroom; One three-quarter bathroom
- Heating & cooling: Central heating; Air conditioning; Ceiling fan; Gas water heater
- Interior features: Fireplace in the living room; Dining area; Living room
- Laundry & utility: Laundry inside
Neighborhood map
What this means for you Summary
Snapshot
- This is a 3-bed/2.0-bath single-family listed at $785k.
Deal economics
- At list price, monthly cash flow is $-251 ($-3k/yr) — negative.
- To cash-flow at today's rent, offer at most $741k (5.6% below list).
- To meet the 1% rule (rent ≥ 1% of price), the offer needs to be $554k (29.4% below list).
- Recommended offer: $554k (29.4% below list) — sets the bar for 1% rule.
- Cap rate 5.9% vs local median 2.7% in Palm Springs — top-decile yield for the area; either an underpriced asset or a hidden risk that comps aren't pricing in. Stress-test before assuming the spread holds.
Location & tenants
- Location reads 66/100 on livability (#348 in CA) — a middle-class / working-renter tenant base. Strengths: amenities A+, commute A+; Watch: crime F, cost of living F, health & safety F.
- Palm Springs Unified (suburban): math 21% / reading 42% proficiency, ranked #328 of 517 in CA (top 63%) — families likely to look elsewhere, expect single-tenant / working-renter base with shorter leases; 73% free/reduced lunch — lower-income household profile, screen leases tightly.
- Zoned schools: Katherine Finchy Elementary (547 students, 92% FRL); Raymond Cree Middle (708 students, 98% FRL); Palm Springs High (math 30% / reading 51%, grade F, #508 of 1,170 statewide, top 44%, 1,584 students, 97% FRL) — zoned schools average 96% FRL vs 73% district-wide (22 pts higher); higher-poverty schools than district average — tighter screening recommended.
- Market conditions: Rents flat; 660 active listings in the ZIP; 40 comparable units currently listed for rent nearby; rentals lingering (median 46d on market — plan ~5-8 weeks vacancy on turnover, expect pricing pressure); 60% of comp listings sitting > 30 days — soft ceiling on asking rent; 9,195 units permitted in Riverside County in 2024 (1,512 in 5+ unit buildings).
- At $5,541/mo this rent would consume 93% of the median local household income ($72k/yr) (locally 1866% of renters already pay >50% of income on rent) — very limited rent-growth headroom before tenants either downsize or default.
Forward outlook
- Local home prices are declining (-3.0%/yr); year-one equity from $5k of loan paydown is wiped out by about $24k of value loss. Plan a longer hold.
- Riverside County population projected at +22% by 2050 — long-run rental-demand tailwind backs the buy-and-hold thesis.
Negotiation context
- It's been on market 39 days — a 3% lower offer ($761k) is reasonable based on typical stale-listing flexibility.
- Current owner paid $650k; 21% above their basis — modest negotiation headroom, anchor on the comps not their cost.
Risks & watch-outs
- Watch-outs: built in 1956 — expect roof / HVAC / electrical / plumbing capex.
- Climate carrying-cost: extreme-heat days projected 8→22/yr by 2055 (HVAC capex compounding) — expect insurance premiums to compound above CPI over the hold.
Questions for the listing agent
- What do current leases actually rent for vs. the listed asking? Can we see a recent rent roll and the last 12 months of T-12 income?
- It's been on market 39 days. Have you received any prior offers? Is the seller open to a 29% concession, seller financing, or rate buy-down credit?
- Built in 1956 — when were the roof, HVAC, electrical panel, plumbing, and water heater last replaced?
- Is there a deadline driving the sale (1031 exchange, divorce, estate, relocation)? That informs how much negotiation room exists.
- Crime grade is F in this area — have there been break-ins, vandalism, or insurance claims at this property in the last 3 years? What carrier currently insures it and at what premium?
- The area grade is low — what's the realistic commute time and amenity access for the typical tenant pool here? Any planned neighborhood developments (good or bad) we should know about?
- What's the average days-on-market for RENTAL listings here right now (not sales)? A rising rental-DOM trend means longer vacancies and softer asking-rent achievability than the comps imply.
- What's the recent tenant-quality profile in this submarket — average credit score on applications, eviction rate, late-payment / NSF rate, and stable-employment percentage? A property-management company in the area should have these aggregated.
- How much new for-sale + rental construction is in the pipeline within 1–3 miles? Heavy new supply typically softens prices + rents 12–24 months out; constrained supply supports both.
Investment metrics
- 1% rule
- 0.71% ✗
- Cap rate
- 5.91%
- Cash-on-cash
- -1.37%
- DSCR
- 0.94
- GRM
- 11.8
CMA / ARV
- ARV (median comp)
- $1,296,992
- List price
- $785,000
- Delta
- -39.48%
- Verdict
- UNDERPRICED
- Comps
- 20 within 1.0 mi
Show comp detail 12 sales within ~0.75 mi
| Address | Dist | Beds/Ba | Sqft | Sold | Price | $/sf | Match |
|---|---|---|---|---|---|---|---|
| 1650 E San Jacinto Way | 0.31mi | 3/3.0 | 1,826 (-0%) | 1mo | $1,325,000 | $726 | 81 |
| 1111 E Tachevah Dr | 0.12mi | 4/2.0 (+1) | 1,919 (+5%) | 2mo | $1,000,000 | $521 | 79 |
| 980 N Buttonwillow Cir | 0.41mi | 4/2.0 (+1) | 1,876 (+3%) | 0mo | $1,144,772 | $610 | 71 |
| 1387 E Verbena Dr | 0.33mi | 3/3.0 | 1,742 (-5%) | 2mo | $1,050,000 | $603 | 71 |
| 1371 E Del Paso | 0.56mi | 3/2.0 | 1,792 (-2%) | 3mo | $930,000 | $519 | 69 |
| 1065 E San Jacinto Way | 0.23mi | 2/2.0 (-1) | 1,664 (-9%) | 3mo | $875,000 | $526 | 67 |
| 1838 N Nogales Way | 0.52mi | 3/2.0 | 1,746 (-4%) | 2mo | $600,000 | $344 | 66 |
| 1043 E Via Escuela | 0.68mi | 3/2.0 | 1,830 (+0%) | 4mo | $675,000 | $369 | 65 |
| 1041 E El Conquistador | 0.63mi | 4/3.0 (+1) | 2,000 (+10%) | 2mo | $970,000 | $485 | 44 |
| 1062 Hunter Dr | 0.68mi | 3/3.0 | 2,052 (+12%) | 1mo | $1,410,000 | $687 | 43 |
| 1056 Dane Dr | 0.65mi | 3/3.0 | 2,081 (+14%) | 1mo | $1,300,000 | $625 | 42 |
| 1591 Olga Way | 0.74mi | 4/2.0 (+1) | 1,597 (-13%) | 2mo | $780,000 | $488 | 38 |
Match score weights: distance 35% · size 25% · config 20% · recency 20%. Top-matched comps best support the ARV.
Projected returns pro-forma
-3.0% appreciation · 0.46% rent growth · sell at horizon
- IRR
- -21.1%
- Equity multiple
- 0.28×
- Total profit
- $-157,393
- Equity at exit
- $117,046
- IRR
- -20.5%
- Equity multiple
- 0.03×
- Total profit
- $-213,134
- Equity at exit
- $67,872
Cash invested: $219,800 (down + closing). Projections, not guarantees.
Landlord ↔ Tenant lean methodology
- Overall (STATE)
- 18 Strongly Tenant-Friendly
- State California
- 18 Strongly Tenant-Friendly · D+13
- County
- — inherits STATE
- City
- — inherits STATE
ZIP-level market 92262
- Rents YoY
- 0.5%
- Active inventory
- 660
- Price-to-rent
- 11.8×
Monthly cashflow live
- Estimated rent
- $5,541 high interval (Pro) →
- Mortgage (P&I)
- −$4,117
- Tax from tax record
- −$185 /mo · $2,216/yr
- Insurance
- −$327
- HOA
- −$0
- Vacancy / Maint / Mgmt
- −$1,164
- Net cashflow
- $-251
Break-even live
Sensitivity live
| Price | -10% $194 | -5% $-29 | +0% $-251 | +5% $-473 | +10% $-695 |
|---|---|---|---|---|---|
| Rent | -10% $-689 | -5% $-470 | +0% $-251 | +5% $-32 | +10% $187 |
| Rate | -1.0pp $145 | -0.5pp $-51 | base $-251 | +0.5pp $-454 | +1.0pp $-661 |
UW: 25.0% down · 7.5% · 30yr · 1.5% tax · 5.0% vac · 8.0% maint · 8.0% mgmt
Financing live
Cash to close
- Down payment
- $196,250
- Closing costs
- $23,550
- Reserves months
- —
- Total cash needed
- —
Loan-product check · same deal, 3 products live
Conventional
25% down · 7.5% · 30yr
- Down + closing
- —
- Monthly P&I
- —
- Monthly cashflow
- —
- DSCR
- —
- Eligible?
- —
Personal DTI + credit; lowest rate.
DSCR
20% down · 8.5% · 30yr
- Down + closing
- —
- Monthly P&I
- —
- Monthly cashflow
- —
- DSCR
- —
- Eligible?
- —
No personal income docs; deal must DSCR.
Hard money
10% down · 12.0% · 12mo
- Down + closing
- —
- Monthly P&I
- —
- Monthly cashflow
- —
- DSCR
- —
- Eligible?
- —
Short-term bridge; refi at stabilization.
Rent comps 40 comps
| Address | Beds | Baths | Sqft | Rent | $/sqft | DOM | Units | Dist |
|---|---|---|---|---|---|---|---|---|
| 1261 Linda Vista Rd Palm Springs, CA | 4.0 | 2.0 | 1740 | $7,000 | $4.02 | 14d | 1 | 0.09mi |
| 1057 E Marshall Way Palm Springs, CA | 4.0 | 4.0 | 2129 | $24,000 | $11.27 | 45d | 1 | 0.17mi |
| 1260 E San Jacinto Way Palm Springs, CA | 4.0 | 3.0 | 2500 | $4,200 | $1.68 | 45d | 1 | 0.19mi |
| 1405 E Tachevah Dr Palm Springs, CA | 3.0 | 3.5 | 1332 | $5,999 | $4.50 | 26d | 1 | 0.20mi |
| 945 N Buttonwillow Cir Palm Springs, CA | 4.0 | 3.0 | 2300 | $10,260 | $4.46 | 45d | 1 | 0.38mi |
| 945 N Buttonwillow Cir Palm Springs, CA | 4.0 | 3.0 | 2300 | $10,260 | $4.46 | 16d | 1 | 0.38mi |
| 663 E Chia Rd Palm Springs, CA | 3.0 | 2.0 | 1849 | $10,000 | $5.41 | 9d | 1 | 0.47mi |
| 1481 N Fiesta Rd Palm Springs, CA | 3.0 | 4.0 | 1812 | $9,000 | $4.97 | 45d | 1 | 0.52mi |
| 1123 E El Cid Palm Springs, CA | 3.0 | 2.0 | 1722 | $4,695 | $2.73 | 1d | 1 | 0.56mi |
| 1020 N Cerritos Dr Palm Springs, CA | 3.0 | 2.0 | 1516 | $13,950 | $9.20 | 45d | 1 | 0.56mi |
| 1207 N Avenida Palmas Palm Springs, CA | 4.0 | 3.0 | 2107 | $3,000 | $1.42 | 45d | 1 | 0.56mi |
| 555 N Sunrise Way Palm Springs, CA | 3.0 | 4.0 | 2274 | $8,000 | $3.52 | 23d | 1 | 0.59mi |
| 547 N Sunrise Way Palm Springs, CA | 4.0 | 2.0 | 1560 | $7,170 | $4.60 | 16d | 1 | 0.61mi |
| 547 N Sunrise Way Palm Springs, CA | 4.0 | 2.0 | 1560 | $7,170 | $4.60 | 45d | 1 | 0.61mi |
| 1818 N Berne Dr Palm Springs, CA | 3.0 | 3.0 | 1760 | $4,500 | $2.56 | 45d | 1 | 0.64mi |
| 1052 Audrey Dr Palm Springs, CA | 3.0 | 3.0 | 2153 | $9,000 | $4.18 | 45d | 1 | 0.64mi |
| 1233 E Via Escuela Palm Springs, CA | 3.0 | 2.0 | 2080 | $4,500 | $2.16 | 6d | 1 | 0.65mi |
| 427 N Calle Rolph Palm Springs, CA | 2.0 | 2.0 | 1374 | $3,500 | $2.55 | 45d | 1 | 0.69mi |
| 1534 E Via Escuela Palm Springs, CA | 4.0 | 2.0 | 1717 | $4,800 | $2.80 | 45d | 1 | 0.69mi |
| 400 E Valmonte Norte Palm Springs, CA | 3.0 | 3.0 | 2579 | $29,500 | $11.44 | 45d | 1 | 0.73mi |
| 2004 Nicola Rd E Palm Springs, CA | 4.0 | 2.0 | 1698 | $4,400 | $2.59 | 45d | 1 | 0.76mi |
| 2120 Nicola Rd W Palm Springs, CA | 4.0 | 2.5 | 1883 | $4,800 | $2.55 | 26d | 1 | 0.78mi |
| 2450 Tamarisk Rd Palm Springs, CA | 4.0 | 2.0 | 1660 | $3,499 | $2.11 | 26d | 1 | 0.79mi |
| 2171 George Dr Palm Springs, CA | 4.0 | 3.0 | 1840 | $7,000 | $3.80 | 45d | 1 | 0.80mi |
| 616 Violeta Dr Palm Springs, CA | 2.0 | 2.5 | 1737 | $3,150 | $1.81 | 45d | 1 | 0.81mi |
| 803 N Palm Canyon Dr Unit 08 Palm Springs, CA | 2.0 | 2.0 | 1500 | $3,299 | $2.20 | 26d | 1 | 0.89mi |
| 1317 E Amado Rd Palm Springs, CA | 2.0 | 2.5 | 1839 | $5,400 | $2.94 | 45d | 1 | 0.89mi |
| 546 N Indian Canyon Dr Palm Springs, CA | 2.0 | 2.5 | 1964 | $4,750 | $2.42 | 26d | 1 | 0.90mi |
| 2295 Nicola Rd E Palm Springs, CA | 3.0 | 2.0 | 1338 | $3,990 | $2.98 | 45d | 1 | 0.91mi |
| 266 E Via Escuela Unit B Palm Springs, CA | 3.0 | 1.5 | 1344 | $2,295 | $1.71 | 45d | 1 | 0.92mi |
| 915 E Racquet Club Rd Palm Springs, CA | 3.0 | 2.0 | 1225 | $7,480 | $6.11 | 16d | 1 | 0.93mi |
| 915 E Racquet Club Rd Palm Springs, CA | 3.0 | 2.0 | 1225 | $7,480 | $6.11 | 45d | 1 | 0.93mi |
| 622 N Monterey Rd Palm Springs, CA | 4.0 | 3.0 | 1950 | $6,000 | $3.08 | 20d | 1 | 0.93mi |
| 2204 Acacia Rd W Palm Springs, CA | 4.0 | 3.0 | 2000 | $9,370 | $4.68 | 45d | 1 | 0.93mi |
| 2204 Acacia Rd W Palm Springs, CA | 4.0 | 3.0 | 2000 | $9,370 | $4.68 | 16d | 1 | 0.93mi |
| 688 E Spencer Dr Palm Springs, CA | 3.0 | 2.0 | 1225 | $7,560 | $6.17 | 45d | 1 | 0.95mi |
| 2223 N Magnolia Rd Palm Springs, CA | 3.0 | 2.0 | 1472 | $3,600 | $2.45 | 26d | 1 | 0.97mi |
| 2564 N Aurora Dr Palm Springs, CA | 3.0 | 2.0 | 1354 | $3,500 | $2.58 | 45d | 1 | 0.98mi |
| 2260 N Indian Canyon Dr Unit B Palm Springs, CA | 3.0 | 1.5 | 1344 | $2,250 | $1.67 | 45d | 1 | 0.98mi |
| 2166 N Indian Canyon Dr Palm Springs, CA | 3.0 | 3.0 | 1344 | $3,000 | $2.23 | 45d | 1 | 0.99mi |
Listing history 17 events
-
2026-06-17status $785,000 Pending 39 DOM
-
2026-06-17days on market $785,000 Backup Offers Accepted 39 DOM
-
2026-06-16days on market $785,000 Backup Offers Accepted 38 DOM
-
2026-06-15days on market $785,000 Backup Offers Accepted 37 DOM
-
2026-06-13days on market $785,000 Backup Offers Accepted 35 DOM
-
2026-06-13days on market $785,000 Backup Offers Accepted 34 DOM
-
2026-06-09days on market $785,000 Backup Offers Accepted 31 DOM
-
2026-06-08days on market $785,000 Backup Offers Accepted 30 DOM
-
2026-06-07days on market $785,000 Backup Offers Accepted 29 DOM
-
2026-06-04days on market $785,000 Backup Offers Accepted 26 DOM
-
2026-06-03days on market $785,000 Backup Offers Accepted 25 DOM
-
2026-06-02days on market $785,000 Backup Offers Accepted 24 DOM
-
2026-06-01days on market $785,000 Backup Offers Accepted 23 DOM
-
2026-05-31days on market $785,000 Backup Offers Accepted 22 DOM
-
2026-05-09$785,000 Active 1289-char remark
-
2025-02-07soldstatus $650,000
-
1981-06-01soldstatus $60,000
ⓘ Source: listings_history table (triggers on properties + properties_extension) + one-shot
backfill from property_details.listing_events for pre-trigger history.
Tax reassessment forecast CA · Resets to sale price
- Current annual tax
- $2,216 · $185/mo
- Projected year-2 tax
- $5,966 · $497/mo
- Expected delta
- +$3,750/yr (+$312/mo · 169.2%)
ⓘ Screening estimate from a state-policy table — verify with the county assessor before closing.
Climate risk First Street
- Flood 1/10 Low FEMA zone X (unshaded) · 0% chance over 30 yrs
- Wildfire 2/10 Low
- Heat 9/10 Extreme 8 d/yr ≥112°F today · 22 d/yr by 30 yrs out
- Wind 1/10 Low
- Air quality 5/10 Major 6 unhealthy d/yr today · 8 by 30 yrs out
Nearby sold comps map
Loading sold comps map…
Walkable amenities ~0.75 mi
Loading nearby amenities…
Taxation est. · year 1
- Rental income
- $66,496
- − Mortgage interest
- −$43,972
- − Property taxes
- −$2,216
- − Insurance
- −$3,925
- − Repairs & maintenance
- −$5,320
- − Management
- −$5,320
- − Depreciation
- −$22,836
- Taxable loss
- −$17,094
- Est. tax savings @ 24.0%
- +$4,102
- After-tax cash flow
- $1,093/yr
For passive investors: Depreciation is non-cash, so a rental often shows a tax loss while cash-flowing — sheltering income. Rental losses are passive: they offset passive income freely, and up to $25,000/yr can offset ordinary (W-2) income if you actively participate and your MAGI is under $100k (phasing out to $0 by $150k); unused losses carry forward. On sale, claimed depreciation is recaptured at up to 25%, and gains may owe capital-gains tax (a 1031 exchange can defer both). Figures are a year-1 estimate at your 24.0% rate — not tax advice; consult a CPA.
Schools (NCES district)
- District
- Palm Springs Unified
- NCES district ID
- 0629550
- Math proficiency
- 21% ▼ -7.00%
- Reading proficiency
- 42% ▬ 0.00%
- Median HH income
- $43,638
- Composite
- 26.76/100
- National rank
- #7131
- State rank
- #328 of 517 in CA
Livability — Palm Springs
- Score
- 66/100
- State rank
- #348
- US rank
- #11850
Category grades
Schools grade is shown separately in the Schools card above.
Census & demographics
- Census place
- Palm Springs, CA
- County
- Riverside County · 2,287,001 people
- City population
- 46,786
- Metro
- Riverside-San Bernardino-Ontario, CA
- Population (ZIP)
- 26,887
- Household income
- $71,672
- Rent vs Own
- Severe rent burden
- 1866.0
Population outlook (Riverside County) Hauer SSP2
- Today (2025)
- 2,664,475 people
- By 2030
- 2,802,692 · +5.2%
- By 2040
- 3,050,904 · +14.5%
- By 2050
- 3,256,783 · +22.2%
- By 2075
- 3,655,058 · +37.2%
- By 2100
- 3,766,594 · +41.4%
Race, ethnicity, and origin ACS 2023
- Neighborhood character
- Diverse neighborhood (Simpson 0.58)
- Race & ethnicity
- White 58% Hispanic / Latino 27% Two or more races 13% Black 9% Asian 3%
- Hispanic origin (detail)
- Mexican 24%
- Common ancestry
- Lithuanian 3% Slovak 3% Italian 2%
- Foreign-born
- 17% · Canada, China
- Languages at home
- 75% English-only · Spanish 19% French/Haitian/Cajun 1% German/W. Germanic 1%
Political lean MEDSL · Riverside
- 2024 margin
- Toss-up / Even · D 48.0% · R 49.3% · Other 2.6%
- 2008→2024 swing
- -3.6pp toward R · 2008: 2.3pp · 2024: -1.3pp
- All cycles
- 2024: R+1.3 2020: D+8.0 2016: D+4.3 2012: R+0.4 2008: D+2.3
Not yet ingested
- Civics
- —
Market trends
- HPI YoY
- ▼ -1082.67%
- Current HPI
- 434.0524
- Rent YoY
- ▲ 0.46%
- Metro
- Riverside-San Bernardino-Ontario, CA
- State GDP YoY
- ▲ 3.21%
- F500 in state
- 116
Industry mix (Fortune 500 HQ in CA)
| Industry | F500 HQs | Revenue |
|---|---|---|
| Technology | 27 | $1,492B |
|
||
| Financial Services | 3 | $174B |
|
||
| Retail | 3 | $44B |
|
||
| Insurance | 3 | $26B |
|
||
| Media / Entertainment | 2 | $115B |
|
||
| Pharmaceuticals / Biotech | 2 | $62B |
|
||
Price history
+1208.3% since first listed5 events — show timeline
- 2026-06-17 Pending — TheMLS
- 2026-05-21 Contingent — TheMLS
- 2026-05-09 Listed $785,000 TheMLS
- 2025-02-07 Sold (Public Records) $650,000 Public Records
- 1981-06-01 Sold (Public Records) $60,000 Public Records
Property tax history
+1.6%/yrLatest (2025): $2,216 · -2.3% YoY. Source: county tax records.
Cash-flow waterfall
monthlySold comps — $/sqft
last 12 mo · ≤1 miLoading sold comps…