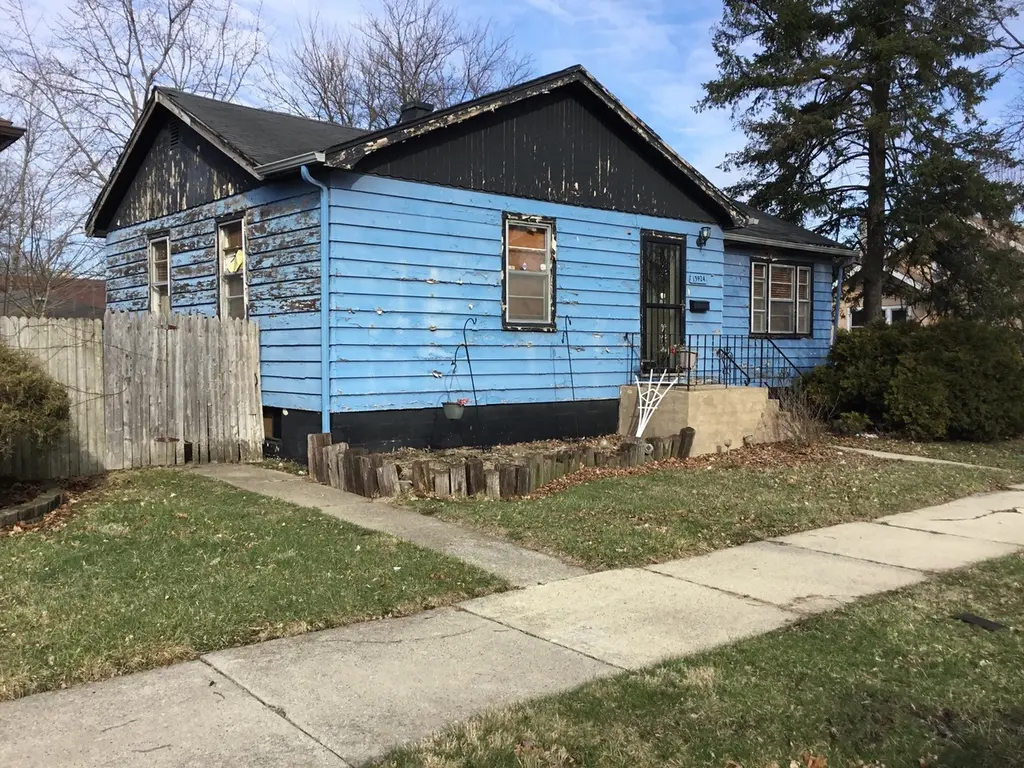
13924 S Michigan Ave · Riverdale, IL
Flood risk 3/10 · Minor
- FEMA flood zone
- X (unshaded)
- Chance of flooding over 30 yrs
- 0.2%
- Est. flood insurance / yr
- $473 – $860
Fire risk 1/10 · Minimal
- Est. fire insurance / yr
- $804 – $1,492
Heat risk 3/10 · Minor
- Hot days now (above 101°F)
- 7 days/yr
- Hot days in 30 yrs
- 15 days/yr
Wind risk 2/10 · Minimal
- Chance of severe wind over 30 yrs
- —
Air-quality risk 4/10 · Minor
- Unhealthy air days now
- 4 days/yr
- Unhealthy air days in 30 yrs
- 5 days/yr
Risk factors via First Street. Map © Google.
Why this score? — see what drove the B+ grade
The composite is a weighted blend of 9 inputs, each scored 0–100. Each bar is that input's sub-score; the figure is the points it added to the 100-point composite (weight × sub-score).
- Cash flow +30.0/30.0
- ARV discount +15.0/15.0
- 1% rule +10.0/10.0
- DSCR +10.0/10.0
- Rent growth +4.5/5.0
- Livability +3.5/5.0
- Condition / age +2.5/5.0
- Schools +0.7/10.0
- Appreciation +0.0/10.0
$65,000
🖨 Deal sheet (PDF) 📄 Offer letter ✓ Due diligence
Listing remarks
Looks can be deceiving with this property. This is a great rehab opportunity for the savvy investor to fix and flip or rent for passive income. You won't be disappointed after looking at this diamond in the rough. Property sold as-is. Room sizes are estimates.
Key facts
- 2 garage spots
- Built 1950
- Listed 85 days
Property features AI
Finance
- Other: Possession at closing; Earnest money held; Directions: Indiana Ave to 139th St, then west to Michigan and south to property
- Financial info: Tax exemptions: Homeowner
- HOA & community: No master association fee required
Exterior
- Parking: Detached garage (about 2.5 garage/total parking spaces)
- Utilities: Water source: Lake Michigan; Public sewer; Electric service with circuit breakers
- Home design: Detached single-family home; One-story layout; Fee simple ownership; Built before 1978
- Construction: Cedar construction; Asphalt roof; Estimated age: 71–80 years
- Exterior features: Less than 0.25 acre lot; Lot dimensions: 3125 (source: county records); Access to commuter bus, commuter train, interstate and school bus service
Interior
- Kitchen: Main-level kitchen (10 x 12)
- Bedrooms: Main-level master bedroom (10 x 13); Main-level second bedroom (10 x 11); Additional bedrooms indicated
- Bathrooms: One full bathroom
- Heating & cooling: Natural gas heating
- Interior features: Five total rooms; Unfinished full basement with walk-out access (20 x 38)
- Laundry & utility: Laundry room
Neighborhood map
What this means for you Summary
Snapshot
- This is a 2-bed/1.0-bath single-family listed at $65k.
Deal economics
- At list price, monthly cash flow is $640 ($8k/yr) — positive.
- The deal already cash-flows at list — no discount required.
- Meets the 1% rule at list price ($1k rent vs $65k).
- Recommended offer: $61k (6.0% below list) — sets the bar for market timing.
- Cap rate 18.1% vs local median 9.5% in Riverdale — top-decile yield for the area; either an underpriced asset or a hidden risk that comps aren't pricing in. Stress-test before assuming the spread holds.
Location & tenants
- Location reads 69/100 on livability (#434 in IL) — a middle-class / working-renter tenant base. Strengths: commute A+, cost of living A+, housing A-; Watch: health & safety C-, schools F, crime F.
- Thornton Twp Hsd 205 (suburban): math 7% / reading 8% proficiency, ranked #594 of 620 in IL (top 96%) — low school quality limits family demand, transient renter base, plan for 1-2y turnover.
- Market conditions: Rents rising fast (+7.8%/yr); 77 active listings in the ZIP; 15 comparable units currently listed for rent nearby; rentals at typical pace (median 20d on market — plan ~3-4 weeks tenant-placement turnaround); lower-income renter base — watch delinquency; 6,272 units permitted in Cook County in 2024 (4,658 in 5+ unit buildings).
- This rent runs 44% of the median local income ($37k/yr) — at the standard rent-burdened threshold; future hikes will face affordability resistance.
Forward outlook
- Local home prices are declining (-3.0%/yr); year-one equity from $449 of loan paydown is wiped out by about $2k of value loss. Plan a longer hold.
- At projected returns (-3.0% appreciation + 7.8% rent growth), your $18k cash investment doubles in ~3 years — after that, you're playing with house money.
Negotiation context
- It's been on market 86 days — a 6% lower offer ($61k) is reasonable based on typical stale-listing flexibility.
Risks & watch-outs
- Watch-outs: built in 1950 — expect roof / HVAC / electrical / plumbing capex.
Questions for the listing agent
- It's been on market 86 days. Have you received any prior offers? Is the seller open to a 6% concession, seller financing, or rate buy-down credit?
- Built in 1950 — when were the roof, HVAC, electrical panel, plumbing, and water heater last replaced?
- Why hasn't it sold? Are there any deal-killer items the seller is aware of (foundation, flood, title, zoning, code violations)?
- Is there a deadline driving the sale (1031 exchange, divorce, estate, relocation)? That informs how much negotiation room exists.
- Schools are F-rated, which usually means shorter tenancies and higher turnover. Who's the typical renter profile here, and what's been the actual vacancy rate?
- Crime grade is F in this area — have there been break-ins, vandalism, or insurance claims at this property in the last 3 years? What carrier currently insures it and at what premium?
- What's the average days-on-market for RENTAL listings here right now (not sales)? A rising rental-DOM trend means longer vacancies and softer asking-rent achievability than the comps imply.
- What's the recent tenant-quality profile in this submarket — average credit score on applications, eviction rate, late-payment / NSF rate, and stable-employment percentage? A property-management company in the area should have these aggregated.
- How much new for-sale + rental construction is in the pipeline within 1–3 miles? Heavy new supply typically softens prices + rents 12–24 months out; constrained supply supports both.
Investment metrics
- 1% rule
- 2.10% ✓
- Cap rate
- 18.11%
- Cash-on-cash
- 42.20%
- DSCR
- 2.88
- GRM
- 4.0
CMA / ARV
- ARV (on-the-fly)
- $83,848
- Comps found
- 12
Show comp detail 12 sales within ~0.75 mi
| Address | Dist | Beds/Ba | Sqft | Sold | Price | $/sf | Match |
|---|---|---|---|---|---|---|---|
| 10 W 140th Ct | 0.21mi | 2/1.0 | 900 (+1%) | 8mo | $85,000 | $94 | 82 |
| 21 W 141st St | 0.25mi | 2/1.5 | 864 (-3%) | 11mo | $65,000 | $75 | 72 |
| 13749 S Wabash Ave | 0.24mi | 3/1.0 (+1) | 945 (+6%) | 4mo | $30,000 | $32 | 70 |
| 13829 S State St | 0.16mi | 3/1.5 (+1) | 1,000 (+12%) | 2mo | $80,000 | $80 | 64 |
| 13910 Kanawha Ave | 0.57mi | 3/1.0 (+1) | 900 (+1%) | 7mo | $52,500 | $58 | 61 |
| 14231 S State St | 0.42mi | 2/1.0 | 1,000 (+12%) | 0mo | $145,000 | $145 | 60 |
| 14127 S La Salle St | 0.40mi | 3/1.0 (+1) | 976 (+9%) | 8mo | $80,000 | $82 | 54 |
| 14309 S La Salle St | 0.56mi | 2/1.5 | 964 (+8%) | 6mo | $67,000 | $70 | 54 |
| 14309 S Wabash Ave | 0.48mi | 3/1.0 (+1) | 974 (+9%) | 6mo | $175,000 | $180 | 52 |
| 14308 S Tracy Ave | 0.74mi | 3/2.0 (+1) | 914 (+2%) | 5mo | $128,229 | $140 | 48 |
| 14319 S Lasalle St | 0.58mi | 2/1.0 | 808 (-9%) | 13mo | $139,900 | $173 | 47 |
| 13815 S Tracy Ave | 0.56mi | 3/1.0 (+1) | 1,024 (+15%) | 11mo | $182,700 | $178 | 35 |
Match score weights: distance 35% · size 25% · config 20% · recency 20%. Top-matched comps best support the ARV.
Projected returns pro-forma
-3.0% appreciation · 7.82% rent growth · sell at horizon
- IRR
- 44.2%
- Equity multiple
- 3.04×
- Total profit
- $37,205
- Equity at exit
- $9,692
- IRR
- 52.3%
- Equity multiple
- 7.40×
- Total profit
- $116,489
- Equity at exit
- $5,620
Cash invested: $18,200 (down + closing). Projections, not guarantees.
Landlord ↔ Tenant lean methodology
- Overall (STATE)
- 43 Moderately Tenant-Leaning
- State Illinois
- 43 Moderately Tenant-Leaning · D+7
- County
- — inherits STATE
- City
- — inherits STATE
ZIP-level market 60827
- Home prices YoY
- -31.8%
- Rents YoY
- 7.8%
- Active inventory
- 77
- Price-to-rent
- 4.0×
Monthly cashflow live
- Estimated rent
- $1,368 high interval (Pro) →
- Mortgage (P&I)
- −$341
- Tax from tax record
- −$72 /mo · $869/yr
- Insurance
- −$27
- HOA
- −$0
- Vacancy / Maint / Mgmt
- −$287
- Net cashflow
- $640
Break-even live
Sensitivity live
| Price | -10% $677 | -5% $658 | +0% $640 | +5% $622 | +10% $603 |
|---|---|---|---|---|---|
| Rent | -10% $532 | -5% $586 | +0% $640 | +5% $694 | +10% $748 |
| Rate | -1.0pp $673 | -0.5pp $657 | base $640 | +0.5pp $623 | +1.0pp $606 |
UW: 25.0% down · 7.5% · 30yr · 1.5% tax · 5.0% vac · 8.0% maint · 8.0% mgmt
Financing live
Cash to close
- Down payment
- $16,250
- Closing costs
- $1,950
- Reserves months
- —
- Total cash needed
- —
Loan-product check · same deal, 3 products live
Conventional
25% down · 7.5% · 30yr
- Down + closing
- —
- Monthly P&I
- —
- Monthly cashflow
- —
- DSCR
- —
- Eligible?
- —
Personal DTI + credit; lowest rate.
DSCR
20% down · 8.5% · 30yr
- Down + closing
- —
- Monthly P&I
- —
- Monthly cashflow
- —
- DSCR
- —
- Eligible?
- —
No personal income docs; deal must DSCR.
Hard money
10% down · 12.0% · 12mo
- Down + closing
- —
- Monthly P&I
- —
- Monthly cashflow
- —
- DSCR
- —
- Eligible?
- —
Short-term bridge; refi at stabilization.
Rent comps 15 comps
| Address | Beds | Baths | Sqft | Rent | $/sqft | DOM | Units | Dist |
|---|---|---|---|---|---|---|---|---|
| 13905 S Clark St Riverdale, IL | 1.0 | 1.0 | 685 | $1,210 | $1.77 | 9d | 6 | 0.21mi |
| 13810 S La Salle St #1 Riverdale, IL | 3.0 | 1.0 | 800 | $1,550 | $1.94 | 3d | 1 | 0.34mi |
| 14101 S Atlantic Ave Riverdale, IL | 2.0 | 1.0 | 790 | $1,140 | $1.44 | 9d | 1 | 0.47mi |
| 13841 Forest Ave Dolton, IL | 3.0 | 1.0 | 930 | $1,895 | $2.04 | 25d | 1 | 0.47mi |
| 14031 S School St Riverdale, IL | 1.0 | 1.0 | 620 | $1,045 | $1.69 | 4d | 1 | 0.50mi |
| 14132 S Atlantic Ave Riverdale, IL | 1.0 | 1.0 | 900 | $1,150 | $1.28 | 25d | 1 | 0.53mi |
| 13604 S Wentworth Ave Riverdale, IL | 3.0 | 1.0 | 1100 | $1,200 | $1.09 | 25d | 1 | 0.54mi |
| 14119 S Tracy Ave Riverdale, IL | 2.0 | 1.0 | 696 | $1,205 | $1.73 | 4d | 1 | 0.60mi |
| 14015 S Stewart Ave Unit 2W Riverdale, IL | 2.0 | 1.0 | 800 | $1,400 | $1.75 | 25d | 1 | 0.61mi |
| 455 W 144th St Unit 2W Riverdale, IL | 1.0 | 1.0 | 750 | $1,250 | $1.67 | 0d | 1 | 0.90mi |
| 14305 Irving Ave Unit 2 Dolton, IL | 3.0 | 1.0 | 1100 | $2,200 | $2.00 | 25d | 1 | 1.03mi |
| 724 W 138th St Unit 3 Riverdale, IL | 2.0 | 1.0 | 800 | $1,250 | $1.56 | 20d | 1 | 1.04mi |
| 14500 Cottage Grove Ave Unit 3 Dolton, IL | 2.0 | 1.0 | 1000 | $1,475 | $1.48 | 25d | 1 | 1.32mi |
| 14502 Cottage Grove Ave Unit 1S Dolton, IL | 1.0 | 1.0 | 900 | $1,425 | $1.58 | 9d | 1 | 1.33mi |
| 14817 Champlain Ave Dolton, IL | 2.0 | 1.0 | 980 | $2,430 | $2.48 | 23d | 1 | 1.50mi |
Listing history 19 events
-
2026-06-21days on market $65,000 Active 86 DOM
-
2026-06-18days on market $65,000 Active 83 DOM
-
2026-06-17days on market $65,000 Active 82 DOM
-
2026-06-16days on market $65,000 Active 81 DOM
-
2026-06-15days on market $65,000 Active 80 DOM
-
2026-06-13days on market $65,000 Active 78 DOM
-
2026-06-13days on market $65,000 Active 77 DOM
-
2026-06-09days on market $65,000 Active 74 DOM
-
2026-06-08days on market $65,000 Active 73 DOM
-
2026-06-07days on market $65,000 Active 72 DOM
-
2026-06-04days on market $65,000 Active 69 DOM
-
2026-06-03days on market $65,000 Active 68 DOM
-
2026-06-02days on market $65,000 Active 67 DOM
-
2026-06-01days on market $65,000 Active 66 DOM
-
2026-05-31days on market $65,000 Active 65 DOM
-
2026-05-20price $65,000
-
2026-04-21price $75,000
-
2002-11-27soldstatus $75,000
-
1988-09-13soldstatus $38,444
ⓘ Source: listings_history table (triggers on properties + properties_extension) + one-shot
backfill from property_details.listing_events for pre-trigger history.
Tax reassessment forecast IL · Partial reset (capped growth)
- Current annual tax
- $869 · $72/mo
- Projected year-2 tax
- $1,172 · $98/mo
- Expected delta
- +$303/yr (+$25/mo · 34.9%)
ⓘ Screening estimate from a state-policy table — verify with the county assessor before closing.
Climate risk First Street
- Flood 3/10 Moderate FEMA zone X (unshaded) · 20% chance over 30 yrs
- Wildfire 1/10 Low
- Heat 3/10 Moderate 7 d/yr ≥101°F today · 15 d/yr by 30 yrs out
- Wind 2/10 Low
- Air quality 4/10 Moderate 4 unhealthy d/yr today · 5 by 30 yrs out
Nearby sold comps map
Loading sold comps map…
Walkable amenities ~0.75 mi
Loading nearby amenities…
Taxation est. · year 1
- Rental income
- $16,412
- − Mortgage interest
- −$3,641
- − Property taxes
- −$869
- − Insurance
- −$325
- − Repairs & maintenance
- −$1,313
- − Management
- −$1,313
- − Depreciation
- −$1,891
- Taxable income
- $7,060
- Est. tax owed @ 24.0%
- −$1,694
- After-tax cash flow
- $5,987/yr
For passive investors: Depreciation is non-cash, so a rental often shows a tax loss while cash-flowing — sheltering income. Rental losses are passive: they offset passive income freely, and up to $25,000/yr can offset ordinary (W-2) income if you actively participate and your MAGI is under $100k (phasing out to $0 by $150k); unused losses carry forward. On sale, claimed depreciation is recaptured at up to 25%, and gains may owe capital-gains tax (a 1031 exchange can defer both). Figures are a year-1 estimate at your 24.0% rate — not tax advice; consult a CPA.
Schools (NCES district)
- District
- Thornton Twp Hsd 205
- NCES district ID
- 1738970
- Math proficiency
- 7% ▬ 0.00%
- Reading proficiency
- 8% ▼ -2.00%
- Median HH income
- $43,392
- Composite
- 6.92/100
- National rank
- #9976
- State rank
- #594 of 620 in IL
Livability — Riverdale
- Score
- 69/100
- State rank
- #434
- US rank
- #8867
Category grades
Schools grade is shown separately in the Schools card above.
Census & demographics
- Census place
- Riverdale, IL
- County
- Cook County · 4,486,803 people
- City population
- 24,713
- Metro
- Chicago-Naperville-Elgin, IL-IN-WI
- Population (ZIP)
- 24,713
- Household income
- $37,217
- Rent vs Own
- Severe rent burden
- 1868.0
Population outlook (Cook County) Hauer SSP2
- Today (2025)
- 5,347,519 people
- By 2030
- 5,357,703 · +0.2%
- By 2040
- 5,324,924 · -0.4%
- By 2050
- 5,230,762 · -2.2%
- By 2075
- 4,785,735 · -10.5%
- By 2100
- 4,188,836 · -21.7%
Race, ethnicity, and origin ACS 2023
- Neighborhood character
- Predominantly Black (88%)
- Race & ethnicity
- Black 88% Two or more races 5% Hispanic / Latino 5% White 2%
- Common ancestry
- Iranian 1%
- Foreign-born
- 2% · Canada
- Languages at home
- 96% English-only · Spanish 3%
Political lean MEDSL · Cook
- 2024 margin
- Solid D (+42.0) · D 70.4% · R 28.4% · Other 1.2%
- 2008→2024 swing
- -11.4pp toward R · 2008: 53.4pp · 2024: 42.0pp
- All cycles
- 2024: D+42.0 2020: D+50.3 2016: D+53.0 2012: D+49.4 2008: D+53.4
Not yet ingested
- Civics
- —
Market trends
- HPI YoY
- ▼ -76.39%
- Current HPI
- 163.7725
- Rent YoY
- ▲ 7.82%
- Metro
- Chicago-Naperville-Elgin, IL-IN-WI
- State GDP YoY
- ▲ 1.59%
- F500 in state
- 60
Industry mix (Fortune 500 HQ in IL)
| Industry | F500 HQs | Revenue |
|---|---|---|
| Insurance | 4 | $201B |
|
||
| Consumer Goods | 4 | $87B |
|
||
| Industrial Machinery | 3 | $64B |
|
||
| Healthcare | 2 | $55B |
|
||
| Retail / Pharmacy | 1 | $148B |
|
||
| Agriculture / Food | 1 | $86B |
|
||
Price history
+69.1% since first listed4 events — show timeline
- 2026-05-20 Price Changed $65,000 MRED as Distributed by MLS Grid
- 2026-04-21 Price Changed $75,000 MRED as Distributed by MLS Grid
- 2002-11-27 Sold (Public Records) $75,000 Public Records
- 1988-09-13 Sold (Public Records) $38,444 Public Records
Property tax history
-2.2%/yrLatest (2023): $869 · +98.0% YoY. Source: county tax records.
Cash-flow waterfall
monthlySold comps — $/sqft
last 12 mo · ≤1 miLoading sold comps…