 🏗️ New Construction
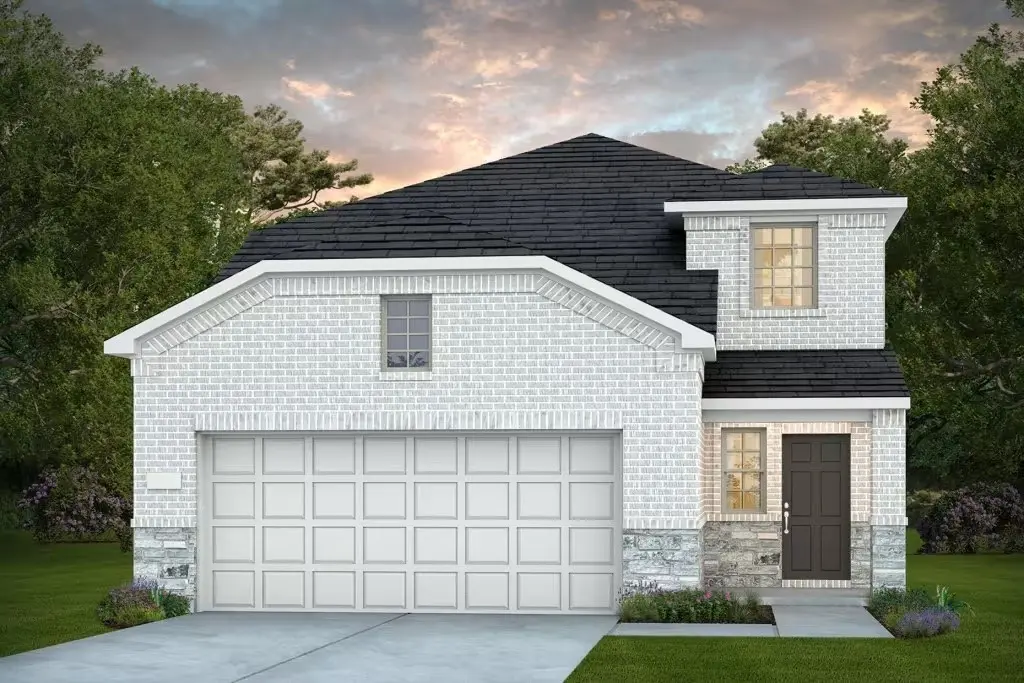
17211 Brine Pool Ln · Crosby, TX
Flood risk No data
- FEMA flood zone
- —
- Chance of flooding over 30 yrs
- —
- Est. flood insurance / yr
- —
Fire risk No data
- Est. fire insurance / yr
- —
Heat risk No data
- Hot days now (above threshold)
- —
- Hot days in 30 yrs
- —
Wind risk No data
- Chance of severe wind over 30 yrs
- —
Air-quality risk No data
- Unhealthy air days now
- —
- Unhealthy air days in 30 yrs
- —
Risk factors via First Street. Map © Google.
Why this score? — see what drove the D+ grade
The composite is a weighted blend of 9 inputs, each scored 0–100. Each bar is that input's sub-score; the figure is the points it added to the 100-point composite (weight × sub-score).
- Cash flow +17.9/30.0
- ARV discount +7.5/15.0
- DSCR +5.6/10.0
- 1% rule +4.0/10.0
- Schools +3.5/10.0
- Livability +3.0/5.0
- Rent growth +2.9/5.0
- Condition / age +2.5/5.0
- Appreciation +0.0/10.0
$259,990
🖨 Deal sheet 📄 Offer letter ✓ Due diligence
Listing remarks
The Fentress features an open-plan first floor perfect for gathering with family and friends. Plus, 4 bedrooms and a second-floor loft. This home features upgrades such as granite countertops, stainless steel appliances, and wood flooring.
Key facts
- 5,565 sq ft lot
- 2 garage spots
- Built 2026
Property features AI
Finance
- Other: Builder: Centex
- HOA & community: Community managed by Graham Management; Annual association fee of $650
Exterior
- Parking: Attached 2-car garage
- Security: Smoke detector(s)
- Utilities: Public water; Public sewer
- Home design: Residential property; Under construction (new construction); Faces east; Slab foundation
- Construction: Built in 2026; Brick and stone exterior; Composition roof
- Exterior features: Covered patio; Patio and deck; Fence (back yard); Sprinkler/irrigation; Subdivision with side yard
Interior
- Kitchen: Dishwasher; Disposal; Gas oven; Gas range; Microwave; Refrigerator; Instant hot water; Kitchen island; Walk-in pantry
- Bedrooms: Primary bedroom on the first floor (approx. 13'6" x 14'0"); Bedroom on the second floor (approx. 13'6" x 11'6"); Bedroom on the second floor (approx. 10'6" x 11'6"); Bedroom on the second floor (approx. 10'6" x 11'6")
- Flooring: Carpet; Plank; Vinyl
- Bathrooms: 2 full bathrooms; 1 half bathroom
- Heating & cooling: Central heating (gas); Central electric air conditioning
- Interior features: Double vanity; Granite counters; Kitchen island; Kitchen/family room combo; Self-closing cabinet doors and drawers; Soaking tub; Separate shower; Vanity; Walk-in pantry; Window treatments; Kitchen/dining combo; Window coverings
- Laundry & utility: Washer and dryer included; Gas dryer hookup; Tankless water heater
Neighborhood map
What this means for you Summary
Snapshot
- This is a 4-bed/2.5-bath land listed at $260k.
Deal economics
- At list price, monthly cash flow is $223 ($3k/yr) — positive.
- The deal already cash-flows at list — no discount required.
- To meet the 1% rule (rent ≥ 1% of price), the offer needs to be $238k (8.5% below list).
- Recommended offer: $238k (8.5% below list) — sets the bar for 1% rule.
- Cap rate 7.3% vs local median 4.8% in Crosby — top-decile yield for the area; either an underpriced asset or a hidden risk that comps aren't pricing in. Stress-test before assuming the spread holds.
Location & tenants
- Location reads 59/100 on livability (#1,121 in TX) — a working-class tenant base; expect higher turnover. Strengths: cost of living A+, crime A, housing A; Watch: amenities F, commute F, employment F.
- Crosby ISD (rural): math 39% / reading 40% proficiency, ranked #369 of 826 in TX (top 45%) — families likely to look elsewhere, expect single-tenant / working-renter base with shorter leases.
- Zoned schools: Crosby Middle (math 36% / reading 37%, grade F, #786 of 1,662 statewide, top 48%, 1,549 students, 60% FRL); Highpoint School East (Crosby) (20 students, 80% FRL) — zoned schools average 70% FRL vs 50% district-wide (20 pts higher); higher-poverty schools than district average — tighter screening recommended.
- Market conditions: Rents rising (+1.5%/yr); 1172 active listings in the ZIP; 4 comparable units currently listed for rent nearby; rentals lingering (median 44d on market — plan ~5-8 weeks vacancy on turnover, expect pricing pressure); 50% of comp listings sitting > 30 days — soft ceiling on asking rent; solid renter incomes; 29,883 units permitted in Harris County in 2024 (8,621 in 5+ unit buildings).
- This rent runs 31% of the median local income ($92k/yr) — at the standard rent-burdened threshold; future hikes will face affordability resistance.
Forward outlook
- Local home prices are declining (-3.0%/yr); year-one equity from $2k of loan paydown is wiped out by about $8k of value loss. Plan a longer hold.
- Harris County population projected at +47% by 2050 — long-run rental-demand tailwind backs the buy-and-hold thesis.
Negotiation context
- It's been on market 24 days — a 2% lower offer ($256k) is reasonable based on typical stale-listing flexibility.
Questions for the listing agent
- What does the HOA fee cover, when was the last increase, and are there any pending special assessments or reserve-fund shortfalls?
- Is there a deadline driving the sale (1031 exchange, divorce, estate, relocation)? That informs how much negotiation room exists.
- Schools are D-rated, which usually means shorter tenancies and higher turnover. Who's the typical renter profile here, and what's been the actual vacancy rate?
- The area grade is low — what's the realistic commute time and amenity access for the typical tenant pool here? Any planned neighborhood developments (good or bad) we should know about?
- What's the average days-on-market for RENTAL listings here right now (not sales)? A rising rental-DOM trend means longer vacancies and softer asking-rent achievability than the comps imply.
- What's the recent tenant-quality profile in this submarket — average credit score on applications, eviction rate, late-payment / NSF rate, and stable-employment percentage? A property-management company in the area should have these aggregated.
- How much new for-sale + rental construction is in the pipeline within 1–3 miles? Heavy new supply typically softens prices + rents 12–24 months out; constrained supply supports both.
Investment metrics
- 1% rule
- 0.90% ✗
- Cap rate
- 7.30%
- Cash-on-cash
- 3.61%
- DSCR
- 1.16
- GRM
- 9.3
CMA / ARV
- ARV (median comp)
- $265,070
- List price
- $259,990
- Delta
- -1.92%
- Verdict
- FAIR
- Comps
- 20 within 1.0 mi
Projected returns pro-forma
-3.0% appreciation · 1.48% rent growth · sell at horizon
- IRR
- -12.2%
- Equity multiple
- 0.56×
- Total profit
- $-32,397
- Equity at exit
- $39,523
- IRR
- -5.4%
- Equity multiple
- 0.67×
- Total profit
- $-24,466
- Equity at exit
- $22,918
Cash invested: $74,220 (down + closing). Projections, not guarantees.
Landlord ↔ Tenant lean methodology
- Overall (STATE)
- 87 Strongly Landlord-Friendly
- State Texas
- 87 Strongly Landlord-Friendly · R+5
- County
- — inherits STATE
- City
- — inherits STATE
ZIP-level market 77532
- Home prices YoY
- -28.6%
- Rents YoY
- 1.5%
- Active inventory
- 1172
- Price-to-rent
- 9.1×
Monthly cashflow live
- Estimated rent
- $2,378 medium interval (Pro) →
- Mortgage (P&I)
- −$1,390
- Tax from tax record
- −$101 /mo · $1,214/yr
- Insurance
- −$110
- HOA
- −$54
- Vacancy / Maint / Mgmt
- −$499
- Net cashflow
- $223
Break-even live
UW: 25.0% down · 7.5% · 30yr · 1.5% tax · 5.0% vac · 8.0% maint · 8.0% mgmt
Financing live
Cash to close
- Down payment
- $66,268
- Closing costs
- $7,952
- Reserves months
- —
- Total cash needed
- —
Loan-product check · same deal, 3 products live
Conventional
25% down · 7.5% · 30yr
- Down + closing
- —
- Monthly P&I
- —
- Monthly cashflow
- —
- DSCR
- —
- Eligible?
- —
Personal DTI + credit; lowest rate.
DSCR
20% down · 8.5% · 30yr
- Down + closing
- —
- Monthly P&I
- —
- Monthly cashflow
- —
- DSCR
- —
- Eligible?
- —
No personal income docs; deal must DSCR.
Hard money
10% down · 12.0% · 12mo
- Down + closing
- —
- Monthly P&I
- —
- Monthly cashflow
- —
- DSCR
- —
- Eligible?
- —
Short-term bridge; refi at stabilization.
Rent comps 4 comps
| Address | Beds | Baths | Sqft | Rent | $/sqft | DOM | Units | Dist |
|---|---|---|---|---|---|---|---|---|
| 711 Equinox St Crosby, TX | 3.0 | 2.0 | 1802 | $1,881 | $1.04 | 43d | 1 | 1.16mi |
| 6006 Lovage Ave Crosby, TX | 4.0 | 2.5 | 2261 | $2,055 | $0.91 | 20d | 1 | 1.19mi |
| 16807 Lisbon Ln Crosby, TX | 3.0 | 2.5 | 2196 | $1,910 | $0.87 | 43d | 1 | 1.31mi |
| 1310 Stem Way Dr Crosby, TX | 4.0 | 2.0 | 2346 | $2,700 | $1.15 | 2d | 1 | 1.41mi |
HOA detail
- Monthly dues
- $54 · $648/yr
Listing history 5 events
-
2026-06-02status $259,990 Pending 24 DOM
-
2026-06-01days on market $259,990 Active 24 DOM
-
2026-05-31days on market $259,990 Active 23 DOM
-
2026-05-08$281,280 Active 239-char remark
-
2026-05-01$281,280 Active 237-char remark
ⓘ Source: listings_history table (triggers on properties + properties_extension) + one-shot
backfill from property_details.listing_events for pre-trigger history.
Tax reassessment forecast TX · Resets to sale price
- Current annual tax
- $1,214 · $101/mo
- Projected year-2 tax
- $4,758 · $396/mo
- Expected delta
- +$3,544/yr (+$295/mo · 291.9%)
ⓘ Screening estimate from a state-policy table — verify with the county assessor before closing.
Nearby sold comps map
Loading sold comps map…
Walkable amenities ~0.75 mi
Loading nearby amenities…
Taxation est. · year 1
- Rental income
- $28,539
- − Mortgage interest
- −$14,848
- − Property taxes
- −$1,214
- − Insurance
- −$1,325
- − Repairs & maintenance
- −$2,283
- − Management
- −$2,283
- − HOA
- −$648
- − Depreciation
- −$7,711
- Taxable loss
- −$1,774
- Est. tax savings @ 24.0%
- +$426
- After-tax cash flow
- $3,103/yr
For passive investors: Depreciation is non-cash, so a rental often shows a tax loss while cash-flowing — sheltering income. Rental losses are passive: they offset passive income freely, and up to $25,000/yr can offset ordinary (W-2) income if you actively participate and your MAGI is under $100k (phasing out to $0 by $150k); unused losses carry forward. On sale, claimed depreciation is recaptured at up to 25%, and gains may owe capital-gains tax (a 1031 exchange can defer both). Figures are a year-1 estimate at your 24.0% rate — not tax advice; consult a CPA.
Schools (NCES district)
- District
- Crosby ISD
- NCES district ID
- 4815750
- Math proficiency
- 39% ▼ -13.00%
- Reading proficiency
- 40% ▼ -5.00%
- Median HH income
- $61,079
- Composite
- 35.14/100
- National rank
- #5012
- State rank
- #369 of 826 in TX
Livability — Crosby
- Score
- 59/100
- State rank
- #1121
- US rank
- #19783
Category grades
Schools grade is shown separately in the Schools card above.
Census & demographics
- County
- Harris County · 4,702,590 people
- City population
- 33,780
- Metro
- Houston-The Woodlands-Sugar Land, TX
- Population (ZIP)
- 33,780
- Household income
- $92,201
- Rent vs Own
- Severe rent burden
- 382.0
Population outlook (Harris County) Hauer SSP2
- Today (2025)
- 5,571,493 people
- By 2030
- 6,089,821 · +9.3%
- By 2040
- 7,142,806 · +28.2%
- By 2050
- 8,185,864 · +46.9%
- By 2075
- 10,574,329 · +89.8%
- By 2100
- 12,109,958 · +117.4%
Race, ethnicity, and origin ACS 2023
- Neighborhood character
- Diverse neighborhood (Simpson 0.60)
- Race & ethnicity
- White 54% Hispanic / Latino 31% Two or more races 16% Black 9%
- Hispanic origin (detail)
- Mexican 24%
- Common ancestry
- Lithuanian 4% Romanian 3% Italian 2%
- Foreign-born
- 10% · Canada
- Languages at home
- 78% English-only · Spanish 21%
Political lean MEDSL · Harris
- 2024 margin
- Lean D (+5.5) · D 52.0% · R 46.4% · Other 1.6%
- 2008→2024 swing
- +3.9pp toward D · 2008: 1.6pp · 2024: 5.5pp
- All cycles
- 2024: D+5.5 2020: D+13.3 2016: D+12.4 2012: D+0.1 2008: D+1.6
Not yet ingested
- Civics
- —
Market trends
- HPI YoY
- ▼ -105.63%
- Current HPI
- 264.0126
- Rent YoY
- ▲ 1.48%
- Metro
- Houston-The Woodlands-Sugar Land, TX
- State GDP YoY
- ▲ 3.95%
- F500 in state
- 110
Industry mix (Fortune 500 HQ in TX)
| Industry | F500 HQs | Revenue |
|---|---|---|
| Energy | 16 | $1,198B |
|
||
| Technology | 5 | $198B |
|
||
| Engineering / Construction | 4 | $72B |
|
||
| Energy Services | 3 | $60B |
|
||
| Utilities | 3 | $41B |
|
||
| Healthcare | 2 | $330B |
|
||
Price history
-7.6% since first listed4 events — show timeline
- 2026-06-01 Pending — HARMLS
- 2026-05-28 Price Changed $259,990 HARMLS
- 2026-05-19 Price Changed $264,990 HARMLS
- 2026-05-08 Listed $281,280 HARMLS
Cash-flow waterfall
monthlySold comps — $/sqft
last 12 mo · ≤1 miLoading sold comps…