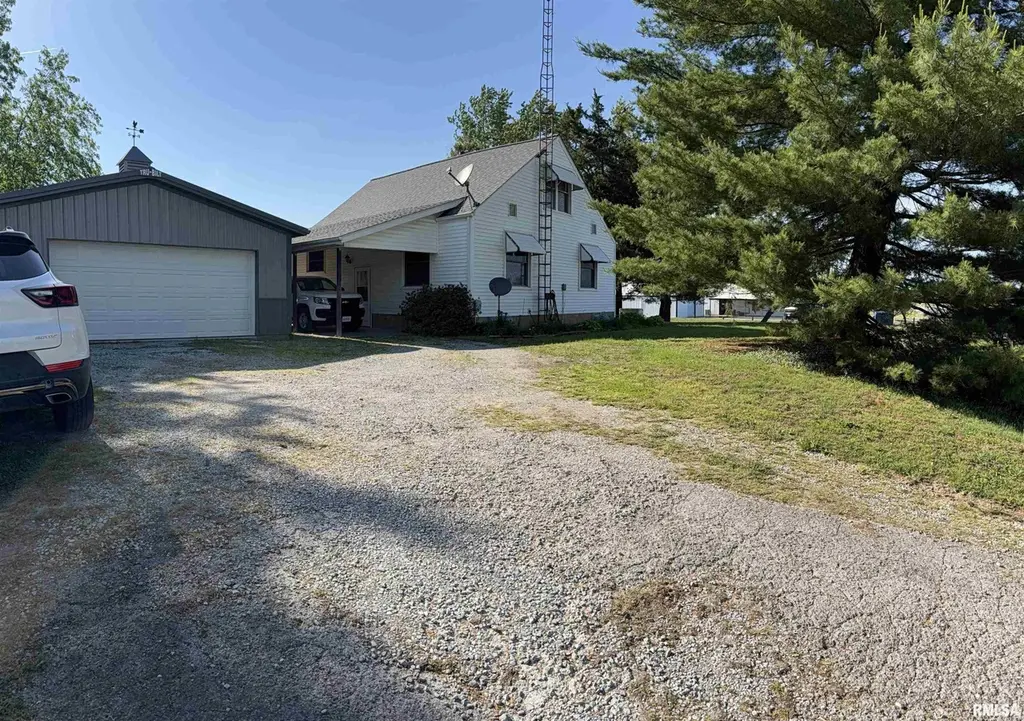
13041 Pittsburg Rd · Marion, IL
Flood risk 1/10 · Minimal
- FEMA flood zone
- X (unshaded)
- Chance of flooding over 30 yrs
- 0.0%
- Est. flood insurance / yr
- $473 – $860
Fire risk 1/10 · Minimal
- Est. fire insurance / yr
- $804 – $1,492
Heat risk 5/10 · Moderate
- Hot days now (above 108°F)
- 7 days/yr
- Hot days in 30 yrs
- 20 days/yr
Wind risk 3/10 · Minor
- Chance of severe wind over 30 yrs
- 4.0%
Air-quality risk 2/10 · Minimal
- Unhealthy air days now
- 1 days/yr
- Unhealthy air days in 30 yrs
- 3 days/yr
Risk factors via First Street. Map © Google.
Why this score? — see what drove the D grade
The composite is a weighted blend of 9 inputs, each scored 0–100. Each bar is that input's sub-score; the figure is the points it added to the 100-point composite (weight × sub-score).
- ARV discount +14.4/15.0
- Cash flow +11.3/30.0
- Rent growth +4.6/5.0
- DSCR +3.3/10.0
- Livability +3.1/5.0
- 1% rule +2.6/10.0
- Condition / age +2.5/5.0
- Schools +2.2/10.0
- Appreciation +0.0/10.0
$149,000
🖨 Deal sheet (PDF) 📄 Offer letter ✓ Due diligence
Listing remarks
* * * HOME WARRANTY * * * offered by the seller. Welcome to country living. 2 bedroom 1.5 bath home with bonus space to make a 4 bedroom home. It is prepped & ready for you to finish to your preference. Dry basement is perfect for extra storage & staying safe during storms. And never lose power with essential generator to keep the lights & heat on. Roof is less than 5 yrs old. New furnace is getting put in now. New Aerator was just put in. 24 x 30 2 car garage to store the toys. Has been very well maintained.
Key facts
- New furnace
- New aerator
- Essential generator
Tags
Property features AI
Exterior
- Parking: Detached 2-car garage
- Utilities: Aerator/Aerobic water source; Mill Creek water source
- Home design: Single family residence; Not new construction
- Construction: Built in 1930
- Exterior features: Shingle roof; Outbuilding; Level lot; Agricultural zoning/uses; Paved road access
Interior
- Kitchen: Dishwasher; Disposal; Refrigerator
- Bedrooms: 2 bedrooms (Bedroom 1 and Bedroom 2 on the main level)
- Flooring: Carpet; Hardwood; Vinyl; Other
- Bathrooms: 1 full bathroom; 1 half bathroom
- Heating & cooling: Central air conditioning; Forced air heating; Gas water heater
- Interior features: Ceiling fans; High-speed internet
Neighborhood map
What this means for you Summary
Snapshot
- This is a 2-bed/1.5-bath single-family listed at $149k.
Deal economics
- At list price, monthly cash flow is $-53 ($-641/yr) — negative.
- To cash-flow at today's rent, offer at most $140k (6.3% below list).
- To meet the 1% rule (rent ≥ 1% of price), the offer needs to be $113k (24.3% below list).
- Recommended offer: $113k (24.3% below list) — sets the bar for 1% rule.
- Cap rate 5.9% vs local median 3.8% in Marion — top-decile yield for the area; either an underpriced asset or a hidden risk that comps aren't pricing in. Stress-test before assuming the spread holds.
Location & tenants
- Location reads 61/100 on livability (#896 in IL) — a middle-class / working-renter tenant base. Strengths: cost of living A+, housing A+; Watch: employment D, crime F, amenities F.
- Marion CUSD 2 (urban): math 20% / reading 31% proficiency, ranked #317 of 620 in IL (top 51%) — low school quality limits family demand, transient renter base, plan for 1-2y turnover.
- Zoned schools: Washington Elem School (math 34% / reading 46%, grade F, #385 of 2,056 statewide, top 19%, 487 students, 0% FRL); Marion Jr High School (math 16% / reading 31%, grade F, #371 of 665 statewide, top 56%, 726 students, 0% FRL); Marion High School (math 14% / reading 18%, grade F, #457 of 693 statewide, top 66%, 1,159 students, 0% FRL) — zoned schools average 0% FRL vs 47% district-wide (47 pts lower); this property's tenant base skews higher-income than the district average.
- Market conditions: Rents rising fast (+8.4%/yr); 229 active listings in the ZIP; 130 units permitted in Williamson County in 2024 (5 in 5+ unit buildings).
Forward outlook
- Local home prices are declining (-3.0%/yr); year-one equity from $1k of loan paydown is wiped out by about $4k of value loss. Plan a longer hold.
Negotiation context
- It's been on market 49 days — a 3% lower offer ($145k) is reasonable based on typical stale-listing flexibility.
- Current owner paid $55k; list at $149k implies a 171% gain — meaningful room to come down on a strong offer.
Risks & watch-outs
- Watch-outs: built in 1930 — expect roof / HVAC / electrical / plumbing capex.
- Climate carrying-cost: extreme-heat days projected 7→20/yr by 2055 (HVAC capex compounding) — expect insurance premiums to compound above CPI over the hold.
Questions for the listing agent
- What do current leases actually rent for vs. the listed asking? Can we see a recent rent roll and the last 12 months of T-12 income?
- It's been on market 49 days. Have you received any prior offers? Is the seller open to a 24% concession, seller financing, or rate buy-down credit?
- Built in 1930 — when were the roof, HVAC, electrical panel, plumbing, and water heater last replaced?
- Is there a deadline driving the sale (1031 exchange, divorce, estate, relocation)? That informs how much negotiation room exists.
- Schools are F-rated, which usually means shorter tenancies and higher turnover. Who's the typical renter profile here, and what's been the actual vacancy rate?
- Crime grade is F in this area — have there been break-ins, vandalism, or insurance claims at this property in the last 3 years? What carrier currently insures it and at what premium?
- The area grade is low — what's the realistic commute time and amenity access for the typical tenant pool here? Any planned neighborhood developments (good or bad) we should know about?
- What's the average days-on-market for RENTAL listings here right now (not sales)? A rising rental-DOM trend means longer vacancies and softer asking-rent achievability than the comps imply.
- What's the recent tenant-quality profile in this submarket — average credit score on applications, eviction rate, late-payment / NSF rate, and stable-employment percentage? A property-management company in the area should have these aggregated.
- How much new for-sale + rental construction is in the pipeline within 1–3 miles? Heavy new supply typically softens prices + rents 12–24 months out; constrained supply supports both.
Investment metrics
- 1% rule
- 0.76% ✗
- Cap rate
- 5.86%
- Cash-on-cash
- -1.54%
- DSCR
- 0.93
- GRM
- 11.0
CMA / ARV
- ARV (median comp)
- $175,864
- List price
- $149,000
- Delta
- -15.28%
- Verdict
- UNDERPRICED
- Comps
- 3 within 2.0 mi
Projected returns pro-forma
-3.0% appreciation · 8.0% rent growth · sell at horizon
- IRR
- -13.9%
- Equity multiple
- 0.48×
- Total profit
- $-21,623
- Equity at exit
- $22,216
- IRR
- 1.1%
- Equity multiple
- 1.09×
- Total profit
- $3,765
- Equity at exit
- $12,883
Cash invested: $41,720 (down + closing). Projections, not guarantees.
Landlord ↔ Tenant lean methodology
- Overall (STATE)
- 43 Moderately Tenant-Leaning
- State Illinois
- 43 Moderately Tenant-Leaning · D+7
- County
- — inherits STATE
- City
- — inherits STATE
ZIP-level market 62959
- Rents YoY
- 8.4%
- Active inventory
- 229
- Price-to-rent
- 11.0×
Monthly cashflow live
- Estimated rent
- $1,127 medium interval (Pro) →
- Mortgage (P&I)
- −$781
- Tax from tax record
- −$101 /mo · $1,207/yr
- Insurance
- −$62
- HOA
- −$0
- Vacancy / Maint / Mgmt
- −$237
- Net cashflow
- $-53
Break-even live
Sensitivity live
| Price | -10% $31 | -5% $-11 | +0% $-53 | +5% $-96 | +10% $-138 |
|---|---|---|---|---|---|
| Rent | -10% $-142 | -5% $-98 | +0% $-53 | +5% $-9 | +10% $36 |
| Rate | -1.0pp $22 | -0.5pp $-15 | base $-53 | +0.5pp $-92 | +1.0pp $-131 |
UW: 25.0% down · 7.5% · 30yr · 1.5% tax · 5.0% vac · 8.0% maint · 8.0% mgmt
Financing live
Cash to close
- Down payment
- $37,250
- Closing costs
- $4,470
- Reserves months
- —
- Total cash needed
- —
Loan-product check · same deal, 3 products live
Conventional
25% down · 7.5% · 30yr
- Down + closing
- —
- Monthly P&I
- —
- Monthly cashflow
- —
- DSCR
- —
- Eligible?
- —
Personal DTI + credit; lowest rate.
DSCR
20% down · 8.5% · 30yr
- Down + closing
- —
- Monthly P&I
- —
- Monthly cashflow
- —
- DSCR
- —
- Eligible?
- —
No personal income docs; deal must DSCR.
Hard money
10% down · 12.0% · 12mo
- Down + closing
- —
- Monthly P&I
- —
- Monthly cashflow
- —
- DSCR
- —
- Eligible?
- —
Short-term bridge; refi at stabilization.
Listing history 23 events
-
2026-06-22days on market $149,000 Active 49 DOM
-
2026-06-21days on market $149,000 Active 48 DOM
-
2026-06-19days on market $149,000 Active 46 DOM
-
2026-06-18days on market $149,000 Active 45 DOM
-
2026-06-17days on market $149,000 Active 44 DOM
-
2026-06-17remarks 525-char remark
-
2026-06-17price $149,000 Active 43 DOM
-
2026-06-16days on market $154,000 Active 43 DOM
-
2026-06-15days on market $154,000 Active 42 DOM
-
2026-06-14days on market $154,000 Active 40 DOM
-
2026-06-13days on market $154,000 Active 39 DOM
-
2026-06-10days on market $154,000 Active 37 DOM
-
2026-06-09days on market $154,000 Active 36 DOM
-
2026-06-09days on market $154,000 Active 35 DOM
-
2026-06-07days on market $154,000 Active 34 DOM
-
2026-06-05days on market $154,000 Active 31 DOM
-
2026-06-03days on market $154,000 Active 30 DOM
-
2026-06-02days on market $154,000 Active 29 DOM
-
2026-06-01days on market $154,000 Active 28 DOM
-
2026-05-31days on market $154,000 Active 27 DOM
-
2026-05-30days on market $154,000 Active 26 DOM
-
2026-05-04$154,000 Active 477-char remark
-
2001-09-26soldstatus $55,000
ⓘ Source: listings_history table (triggers on properties + properties_extension) + one-shot
backfill from property_details.listing_events for pre-trigger history.
Tax reassessment forecast IL · Partial reset (capped growth)
- Current annual tax
- $1,207 · $101/mo
- Projected year-2 tax
- $2,295 · $191/mo
- Expected delta
- +$1,088/yr (+$91/mo · 90.1%)
ⓘ Screening estimate from a state-policy table — verify with the county assessor before closing.
Climate risk First Street
- Flood 1/10 Low FEMA zone X (unshaded) · 0% chance over 30 yrs
- Wildfire 1/10 Low
- Heat 5/10 Major 7 d/yr ≥108°F today · 20 d/yr by 30 yrs out
- Wind 3/10 Moderate 4% chance of damaging wind over 30 yrs
- Air quality 2/10 Low 1 unhealthy d/yr today · 3 by 30 yrs out
Nearby sold comps map
Loading sold comps map…
Walkable amenities ~0.75 mi
Loading nearby amenities…
Taxation est. · year 1
- Rental income
- $13,529
- − Mortgage interest
- −$8,346
- − Property taxes
- −$1,207
- − Insurance
- −$745
- − Repairs & maintenance
- −$1,082
- − Management
- −$1,082
- − Depreciation
- −$4,335
- Taxable loss
- −$3,269
- Est. tax savings @ 24.0%
- +$784
- After-tax cash flow
- $144/yr
For passive investors: Depreciation is non-cash, so a rental often shows a tax loss while cash-flowing — sheltering income. Rental losses are passive: they offset passive income freely, and up to $25,000/yr can offset ordinary (W-2) income if you actively participate and your MAGI is under $100k (phasing out to $0 by $150k); unused losses carry forward. On sale, claimed depreciation is recaptured at up to 25%, and gains may owe capital-gains tax (a 1031 exchange can defer both). Figures are a year-1 estimate at your 24.0% rate — not tax advice; consult a CPA.
Schools (NCES district)
- District
- Marion CUSD 2
- NCES district ID
- 1724600
- Math proficiency
- 20% ▼ -11.00%
- Reading proficiency
- 31% ▼ -11.00%
- Median HH income
- $46,221
- Composite
- 22.07/100
- National rank
- #8189
- State rank
- #317 of 620 in IL
Livability — Marion
- Score
- 61/100
- State rank
- #896
- US rank
- #17434
Category grades
Schools grade is shown separately in the Schools card above.
Census & demographics
- County
- Williamson County · 38,451 people
- City population
- 27,793
- Metro
- Carbondale-Marion, IL
- Population (ZIP)
- 27,793
- Household income
- $71,063
- Rent vs Own
- Severe rent burden
- 763.0
Population outlook (Williamson County) Hauer SSP2
- Today (2025)
- 69,553 people
- By 2030
- 70,090 · +0.8%
- By 2040
- 70,345 · +1.1%
- By 2050
- 69,394 · -0.2%
- By 2075
- 63,590 · -8.6%
- By 2100
- 51,154 · -26.5%
Race, ethnicity, and origin ACS 2023
- Neighborhood character
- Predominantly White (87%)
- Race & ethnicity
- White 87% Black 5% Two or more races 4% Hispanic / Latino 3% Asian 2%
- Common ancestry
- Lithuanian 2% Italian 2% Slovak 1%
- Foreign-born
- 2% · Canada
- Languages at home
- 97% English-only · Spanish 1% Other Asian/Pacific 1% Other Indo-European 1%
Political lean MEDSL · Williamson
- 2024 margin
- Solid R (+38.8) · D 30.0% · R 68.8% · Other 1.3%
- 2008→2024 swing
- -24.0pp toward R · 2008: -14.8pp · 2024: -38.8pp
- All cycles
- 2024: R+38.8 2020: R+37.3 2016: R+41.2 2012: R+25.0 2008: R+14.8
Not yet ingested
- Civics
- —
Market trends
- HPI YoY
- ▼ -76.41%
- Current HPI
- 137.5955
- Rent YoY
- ▲ 8.40%
- Metro
- Carbondale-Marion, IL
- State GDP YoY
- ▲ 1.59%
- F500 in state
- 60
Industry mix (Fortune 500 HQ in IL)
| Industry | F500 HQs | Revenue |
|---|---|---|
| Insurance | 4 | $201B |
|
||
| Consumer Goods | 4 | $87B |
|
||
| Industrial Machinery | 3 | $64B |
|
||
| Healthcare | 2 | $55B |
|
||
| Retail / Pharmacy | 1 | $148B |
|
||
| Agriculture / Food | 1 | $86B |
|
||
Price history
+170.9% since first listed3 events — show timeline
- 2026-06-16 Price Changed $149,000 RMLSA as Distributed by MLS Grid
- 2026-05-04 Listed $154,000 RMLSA as Distributed by MLS Grid
- 2001-09-26 Sold (Public Records) $55,000 Public Records
Property tax history
+6.1%/yrLatest (2025): $1,207 · +3.4% YoY. Source: county tax records.
Cash-flow waterfall
monthlySold comps — $/sqft
last 12 mo · ≤1 miLoading sold comps…