1320 Quarters Ave Plan · Fort Lupton, CO
Flood risk No data
- FEMA flood zone
- —
- Chance of flooding over 30 yrs
- —
- Est. flood insurance / yr
- —
Fire risk No data
- Est. fire insurance / yr
- —
Heat risk No data
- Hot days now (above threshold)
- —
- Hot days in 30 yrs
- —
Wind risk No data
- Chance of severe wind over 30 yrs
- —
Air-quality risk No data
- Unhealthy air days now
- —
- Unhealthy air days in 30 yrs
- —
Risk factors via First Street. Map © Google.
Why this score? — see what drove the C+ grade
The composite is a weighted blend of 9 inputs, each scored 0–100. Each bar is that input's sub-score; the figure is the points it added to the 100-point composite (weight × sub-score).
- Cash flow +27.7/30.0
- DSCR +9.7/10.0
- 1% rule +7.6/10.0
- ARV discount +7.5/15.0
- Condition / age +4.0/5.0
- Livability +3.4/5.0
- Rent growth +2.5/5.0
- Schools +1.8/10.0
- Appreciation +0.0/10.0
$204,995
🖨 Deal sheet (PDF) 📄 Offer letter ✓ Due diligence
Listing remarks MLS
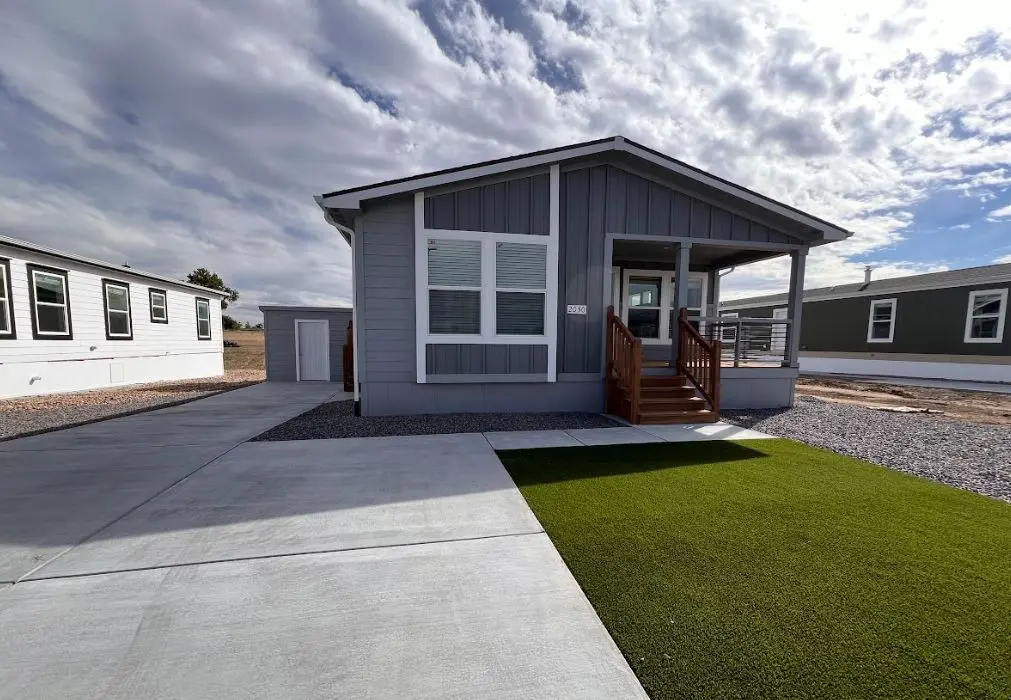
Welcome home to our Montoya model. You are greeted with a sizable covered front porch to enjoy the beautiful sunsets on with family. The open concept layout seamlessly connects the kitchen with the living room and dining room areas. The kitchen provides ample storage with plenty of cabinetry & counterspace. Abundant windows throughout the home flood the space with natural light, creating an airy and inviting environment. This is just to name a few of the many wonderful amenities this home has to offer, DON T MISS OUT GIVE US A CALL TODAY! Disclaimer: Photos are of a previously built home. Colors and options may vary.
Key facts
- Covered front porch
- Abundant windows
- Natural light
Tags
Neighborhood map
What this means for you Summary
Snapshot
- This is a 3-bed/2.0-bath manufactured listed at $205k. Condition is rated good.
Deal economics
- At list price, monthly cash flow is $617 ($7k/yr) — positive.
- The deal already cash-flows at list — no discount required.
- Meets the 1% rule at list price ($3k rent vs $205k).
- Recommended offer: $180k (12.0% below list) — sets the bar for market timing.
- Cap rate 9.9% vs local median 3.8% in Fort Lupton — top-decile yield for the area; either an underpriced asset or a hidden risk that comps aren't pricing in. Stress-test before assuming the spread holds.
Location & tenants
- Location reads 67/100 on livability (#130 in CO) — a middle-class / working-renter tenant base. Strengths: housing A+, amenities B; Watch: health & safety D, schools F, commute F.
- Weld County Reorganized School District No. Re-8 (town): math 17% / reading 23% proficiency, ranked #74 of 86 in CO (top 86%) — low school quality limits family demand, transient renter base, plan for 1-2y turnover.
- Market conditions: 221 active listings in the ZIP; 7 comparable units currently listed for rent nearby; rentals leasing fast (median 5d on market — plan ~1-2 weeks tenant-placement turnaround); 3,170 units permitted in Weld County in 2024 (278 in 5+ unit buildings).
Forward outlook
- Local home prices are declining (-3.0%/yr); year-one equity from $1k of loan paydown is wiped out by about $6k of value loss. Plan a longer hold.
- Weld County population projected at +46% by 2050 — long-run rental-demand tailwind backs the buy-and-hold thesis.
- At projected returns (-3.0% appreciation + 3.0% rent growth), your $57k cash investment doubles in ~9 years — after that, you're playing with house money.
Negotiation context
- It's been on market 161 days — a 12% lower offer ($180k) is reasonable based on typical stale-listing flexibility.
Questions for the listing agent
- It's been on market 161 days. Have you received any prior offers? Is the seller open to a 12% concession, seller financing, or rate buy-down credit?
- Why hasn't it sold? Are there any deal-killer items the seller is aware of (foundation, flood, title, zoning, code violations)?
- Is there a deadline driving the sale (1031 exchange, divorce, estate, relocation)? That informs how much negotiation room exists.
- Schools are F-rated, which usually means shorter tenancies and higher turnover. Who's the typical renter profile here, and what's been the actual vacancy rate?
- What's the average days-on-market for RENTAL listings here right now (not sales)? A rising rental-DOM trend means longer vacancies and softer asking-rent achievability than the comps imply.
- What's the recent tenant-quality profile in this submarket — average credit score on applications, eviction rate, late-payment / NSF rate, and stable-employment percentage? A property-management company in the area should have these aggregated.
- How much new for-sale + rental construction is in the pipeline within 1–3 miles? Heavy new supply typically softens prices + rents 12–24 months out; constrained supply supports both.
Investment metrics
- 1% rule
- 1.26% ✓
- Cap rate
- 9.90%
- Cash-on-cash
- 12.89%
- DSCR
- 1.57
- GRM
- 6.6
CMA / ARV
No comps found within radius.
Projected returns pro-forma
-3.0% appreciation · 3.0% rent growth · sell at horizon
- IRR
- 2.8%
- Equity multiple
- 1.11×
- Total profit
- $6,097
- Equity at exit
- $30,565
- IRR
- 12.3%
- Equity multiple
- 1.98×
- Total profit
- $56,042
- Equity at exit
- $17,724
Cash invested: $57,399 (down + closing). Projections, not guarantees.
Landlord ↔ Tenant lean methodology
- Overall (STATE)
- 38 Tenant-Leaning
- State Colorado
- 38 Tenant-Leaning · D+4
- County
- — inherits STATE
- City
- — inherits STATE
ZIP-level market 80621
- Active inventory
- 221
- Price-to-rent
- 6.6×
Monthly cashflow live
- Estimated rent
- $2,574 high interval (Pro) →
- Mortgage (P&I)
- −$1,075
- Tax est. 1.5%
- −$256 /mo · $3,075/yr
- Insurance
- −$85
- HOA
- −$0
- Vacancy / Maint / Mgmt
- −$541
- Net cashflow
- $617
Break-even live
Sensitivity live
| Price | -10% $758 | -5% $688 | +0% $617 | +5% $546 | +10% $475 |
|---|---|---|---|---|---|
| Rent | -10% $413 | -5% $515 | +0% $617 | +5% $718 | +10% $820 |
| Rate | -1.0pp $720 | -0.5pp $669 | base $617 | +0.5pp $564 | +1.0pp $510 |
UW: 25.0% down · 7.5% · 30yr · 1.5% tax · 5.0% vac · 8.0% maint · 8.0% mgmt
Financing live
Cash to close
- Down payment
- $51,249
- Closing costs
- $6,150
- Reserves months
- —
- Total cash needed
- —
Loan-product check · same deal, 3 products live
Conventional
25% down · 7.5% · 30yr
- Down + closing
- —
- Monthly P&I
- —
- Monthly cashflow
- —
- DSCR
- —
- Eligible?
- —
Personal DTI + credit; lowest rate.
DSCR
20% down · 8.5% · 30yr
- Down + closing
- —
- Monthly P&I
- —
- Monthly cashflow
- —
- DSCR
- —
- Eligible?
- —
No personal income docs; deal must DSCR.
Hard money
10% down · 12.0% · 12mo
- Down + closing
- —
- Monthly P&I
- —
- Monthly cashflow
- —
- DSCR
- —
- Eligible?
- —
Short-term bridge; refi at stabilization.
Rent comps 7 comps
| Address | Beds | Baths | Sqft | Rent | $/sqft | DOM | Units | Dist |
|---|---|---|---|---|---|---|---|---|
| 1300 Whitetail Ave Fort Lupton, CO | 2.0–4.0 | 2.0 | 1296 | $1,800 | $1.39 | 5d | 1 | 0.03mi |
| 2185 Alyssa St Fort Lupton, CO | 4.0 | 2.5 | 2171 | $2,925 | $1.35 | 5d | 1 | 0.27mi |
| 2155 Alyssa St Fort Lupton, CO | 3.0 | 2.5 | 1870 | $2,845 | $1.52 | 5d | 1 | 0.28mi |
| 2221 Christina St Fort Lupton, CO | 4.0 | 2.5 | 2171 | $3,235 | $1.49 | 5d | 1 | 0.33mi |
| 2170 Christina St Fort Lupton, CO | 4.0 | 2.5 | 2171 | $3,235 | $1.49 | 5d | 1 | 0.37mi |
| 2130 Christina St Fort Lupton, CO | 4.0 | 2.5 | 2171 | $2,925 | $1.35 | 5d | 1 | 0.38mi |
| 1653 Wagonwheel Dr Fort Lupton, CO | 4.0 | 3.0 | 2046 | $2,795 | $1.37 | 14d | 1 | 0.89mi |
Listing history 15 events
-
2026-06-18days on market $204,995 Active 161 DOM
-
2026-06-17days on market $204,995 Active 160 DOM
-
2026-06-16days on market $204,995 Active 159 DOM
-
2026-06-15days on market $204,995 Active 158 DOM
-
2026-06-14days on market $204,995 Active 156 DOM
-
2026-06-10days on market $204,995 Active 153 DOM
-
2026-06-09days on market $204,995 Active 152 DOM
-
2026-06-08days on market $204,995 Active 151 DOM
-
2026-06-07days on market $204,995 Active 150 DOM
-
2026-06-03days on market $204,995 Active 146 DOM
-
2026-06-02days on market $204,995 Active 145 DOM
-
2026-06-01days on market $204,995 Active 144 DOM
-
2026-05-31days on market $204,995 Active 143 DOM
-
2026-05-30days on market $204,995 Active 142 DOM
-
2026-01-08$204,995 Active 632-char remark
Show marketing remark (632 chars)
Welcome home to our Montoya model. You are greeted with a sizable covered front porch to enjoy the beautiful sunsets on with family. The open concept layout seamlessly connects the kitchen with the living room and dining room areas. The kitchen provides ample storage with plenty of cabinetry & counterspace. Abundant windows throughout the home flood the space with natural light, creating an airy and inviting environment. This is just to name a few of the many wonderful amenities this home has to offer, DON T MISS OUT GIVE US A CALL TODAY! Disclaimer: Photos are of a previously built home. Colors and options may vary.
ⓘ Source: listings_history table (triggers on properties + properties_extension) + one-shot
backfill from property_details.listing_events for pre-trigger history.
Nearby sold comps map
Loading sold comps map…
Walkable amenities ~0.75 mi
Loading nearby amenities…
Taxation est. · year 1
- Rental income
- $30,886
- − Mortgage interest
- −$11,483
- − Property taxes
- −$3,075
- − Insurance
- −$1,025
- − Repairs & maintenance
- −$2,471
- − Management
- −$2,471
- − Depreciation
- −$5,963
- Taxable income
- $4,398
- Est. tax owed @ 24.0%
- −$1,056
- After-tax cash flow
- $6,345/yr
For passive investors: Depreciation is non-cash, so a rental often shows a tax loss while cash-flowing — sheltering income. Rental losses are passive: they offset passive income freely, and up to $25,000/yr can offset ordinary (W-2) income if you actively participate and your MAGI is under $100k (phasing out to $0 by $150k); unused losses carry forward. On sale, claimed depreciation is recaptured at up to 25%, and gains may owe capital-gains tax (a 1031 exchange can defer both). Figures are a year-1 estimate at your 24.0% rate — not tax advice; consult a CPA.
Condition & rehab AI · 5 photos
This manufactured home is in excellent condition with a good condition score of 80. It is move-in ready with a modern kitchen, ample natural light, and a well-maintained exterior. The home has potential for further value increases through minor updates such as painting and smart home integration.
Value-add opportunities
- Both Paint interior walls — Fresh paint can enhance curb appeal and interior aesthetics.
- Both Install smart home devices — Smart home devices can increase home value and appeal to tech-savvy buyers/renters.
- Both Add outdoor lighting — Outdoor lighting can improve safety and curb appeal, especially at night.
Renovation cost estimate screening
Value-add ROI direction
- Both Paint interior walls — Fresh paint can enhance curb appeal and interior aesthetics. ↑
- Both Install smart home devices — Smart home devices can increase home value and appeal to tech-savvy buyers/renters. ↑
- Both Add outdoor lighting — Outdoor lighting can improve safety and curb appeal, especially at night. ↑
ⓘ Cost ranges are severity-bucket heuristics (US national rule-of-thumb). Get contractor quotes + a written scope before underwriting a rehab budget.
Schools (NCES district)
- District
- Weld County Reorganized School District No. Re-8
- NCES district ID
- 0804020
- Math proficiency
- 17% ▼ -6.00%
- Reading proficiency
- 23% ▼ -6.00%
- Median HH income
- $56,116
- Composite
- 18.48/100
- National rank
- #8921
- State rank
- #74 of 86 in CO
Livability — Fort Lupton
- Score
- 67/100
- State rank
- #130
- US rank
- #11069
Category grades
Schools grade is shown separately in the Schools card above.
Census & demographics
- Census place
- Fort Lupton, CO
- City population
- 14,542
- Population (ZIP)
- 14,542
Population outlook (Weld County) Hauer SSP2
- Today (2025)
- 351,957 people
- By 2030
- 385,304 · +9.5%
- By 2040
- 451,818 · +28.4%
- By 2050
- 514,478 · +46.2%
- By 2075
- 648,733 · +84.3%
- By 2100
- 720,400 · +104.7%
Race, ethnicity, and origin ACS 2023
- Neighborhood character
- Majority Hispanic (51%)
- Race & ethnicity
- Hispanic / Latino 51% White 44% Two or more races 16%
- Hispanic origin (detail)
- Mexican 44%
- Common ancestry
- Portuguese 2% Serbian 1% Italian 1%
- Foreign-born
- 14% · Canada
- Languages at home
- 66% English-only · Spanish 34%
Political lean MEDSL · Weld
- 2024 margin
- Strong R (+21.0) · D 38.2% · R 59.2% · Other 2.6%
- 2008→2024 swing
- -12.2pp toward R · 2008: -8.7pp · 2024: -21.0pp
- All cycles
- 2024: R+21.0 2020: R+18.0 2016: R+22.4 2012: R+13.2 2008: R+8.7
Not yet ingested
- Civics
- —
Market trends
- HPI YoY
- ▼ -164.37%
- Current HPI
- 285.9162
- Rent YoY
- —
- Metro
- —
- State GDP YoY
- ▲ 1.95%
- F500 in state
- 14
Industry mix (Fortune 500 HQ in CO)
| Industry | F500 HQs | Revenue |
|---|---|---|
| Technology Distribution | 1 | $31B |
|
||
| Food / Agriculture | 1 | $18B |
|
||
| Packaging | 1 | $14B |
|
||
| Healthcare | 1 | $13B |
|
||
| Energy | 1 | $10B |
|
||
| Technology | 1 | $4B |
|
||
Price history
1 event — show timeline
- 2026-01-08 Listed $204,995 Zillow
Cash-flow waterfall
monthlySold comps — $/sqft
last 12 mo · ≤1 miLoading sold comps…