93 Worth St #302 · New York, NY
Flood risk 1/10 · Minimal
- FEMA flood zone
- X (unshaded)
- Chance of flooding over 30 yrs
- 0.0%
- Est. flood insurance / yr
- $507 – $1,088
Fire risk 1/10 · Minimal
- Est. fire insurance / yr
- $691 – $1,283
Heat risk 6/10 · Moderate
- Hot days now (above 99°F)
- 7 days/yr
- Hot days in 30 yrs
- 15 days/yr
Wind risk 6/10 · Moderate
- Chance of severe wind over 30 yrs
- 27.0%
Air-quality risk 4/10 · Minor
- Unhealthy air days now
- 5 days/yr
- Unhealthy air days in 30 yrs
- 7 days/yr
Risk factors via First Street. Map © Google.
Why this score? — see what drove the D grade
The composite is a weighted blend of 9 inputs, each scored 0–100. Each bar is that input's sub-score; the figure is the points it added to the 100-point composite (weight × sub-score).
- Appreciation +10.0/10.0
- ARV discount +7.5/15.0
- Cash flow +6.7/30.0
- Schools +5.0/10.0
- Rent growth +4.9/5.0
- Livability +3.8/5.0
- Condition / age +2.5/5.0
- 1% rule +1.9/10.0
- DSCR +0.9/10.0
$1,020,000
🖨 Deal sheet (PDF) 📄 Offer letter ✓ Due diligence
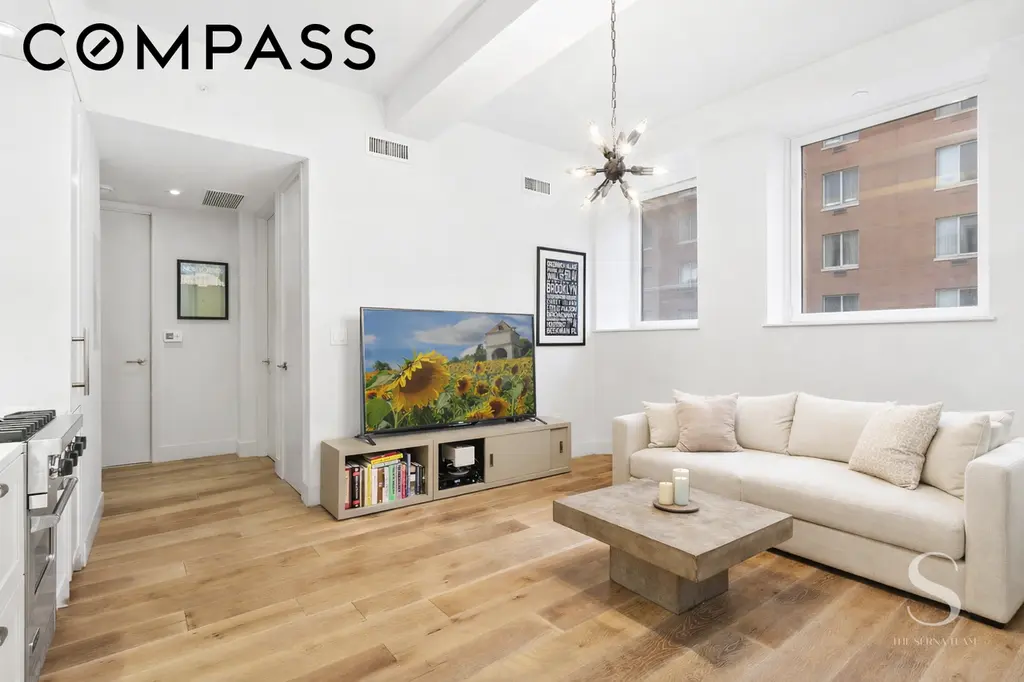
Listing remarks
Renovated 1-Bedroom with Great Light & Low Monthly Costs. Welcome to Residence 302 at 93 Worth Street, a beautifully renovated one-bedroom home offering natural light, thoughtful design, and the rare advantage of exceptionally low monthly carrying costs in a full-service Tribeca condominium. With north and east exposures, oversized windows, and ceilings over 10 feet, the home feels bright, open, and spacious. The layout comfortably accommodates both living and dining areas, while the open kitchen features a Viking range, Sub-Zero refrigeration drawers, and a Fisher & Paykel dishwasher. The king-sized bedroom includes custom California Closets, while the spa-like bathroom feature
Key facts
- Vaulted lobby
- Open chef's kitchen
- Landscaped rooftop
Tags
Property features AI
Finance
- Other: Building has elevator(s); Total units in building: 92
- HOA & community: Monthly association fee of $766; Building allows cats and dogs
Exterior
- Utilities: Central air (cooling)
- Home design: Condo in a 14-story building; Unit entry level 302; Has view
- Construction: Building name: 93 Worth
- Exterior features: Building roof deck; Building barbecue
Interior
- Bedrooms: 3 total rooms
- Flooring: Hardwood floors
- Bathrooms: 1 full bathroom
- Heating & cooling: Central air conditioning
- Interior features: High ceilings; Recessed lighting; Unfurnished
- Laundry & utility: In-unit laundry; Common laundry on the floor; Common area laundry
Neighborhood map
What this means for you Summary
Snapshot
- This is a 1-bed/1.0-bath condo listed at $1.02M.
Deal economics
- At list price, monthly cash flow is $-2k ($-20k/yr) — negative.
- To cash-flow at today's rent, offer at most $729k (28.5% below list).
- To meet the 1% rule (rent ≥ 1% of price), the offer needs to be $701k (31.3% below list).
- Recommended offer: $701k (31.3% below list) — sets the bar for 1% rule.
- Cap rate 4.4% vs local median 2.6% in New York — top-decile yield for the area; either an underpriced asset or a hidden risk that comps aren't pricing in. Stress-test before assuming the spread holds.
Location & tenants
- Location reads 75/100 on livability (#268 in NY, #4,188 nationally) — a middle-class / working-renter tenant base. Strengths: amenities A+, commute A+, health & safety A; Watch: crime F, cost of living F.
- Zoned schools: Elm Tree Elementary School (math 27% / reading 52%, grade F, #1,444 of 2,108 statewide, top 71%, 806 students, 94% FRL); Mark Twain Is 239 For The Gifted And Talented (math 90% / reading 96%, grade A+, #6 of 729 statewide, top 1%, 1,207 students, 44% FRL); Midwood High School (math 94% / reading 96%, grade A+, #83 of 1,100 statewide, top 8%, 4,062 students, 73% FRL).
- Market conditions: Rents rising fast (+9.4%/yr); 231 active listings in the ZIP; 40 comparable units currently listed for rent nearby; rentals leasing fast (median 10d on market — plan ~1-2 weeks tenant-placement turnaround); high-income renter base; 4,467 units permitted in New York County in 2024 (4,463 in 5+ unit buildings).
- At $7,006/mo this rent would consume 52% of the median local household income ($161k/yr) (locally 2000% of renters already pay >50% of income on rent) — very limited rent-growth headroom before tenants either downsize or default.
Forward outlook
- In year one you build about $109k of equity ($7k loan paydown + $102k appreciation (10.0% local appreciation)).
- New York County population projected at +21% by 2050 — long-run rental-demand tailwind backs the buy-and-hold thesis.
- By year 2, paydown + projected appreciation supports a ~$175k cash-out refi (75% LTV) — recoverable capital for the next deal without selling this one.
Negotiation context
- It's been on market 90 days — a 6% lower offer ($959k) is reasonable based on typical stale-listing flexibility.
- 6 sale attempts since 14y ago; this cycle's ask has dropped $140k (12%) from the opening price — seller is motivated, your offer sets the floor, not the list.
- Current owner paid $631k; list at $1.02M implies a 62% gain — meaningful room to come down on a strong offer.
Risks & watch-outs
- Watch-outs: built in 1924 — expect roof / HVAC / electrical / plumbing capex.
- Climate carrying-cost: major wind risk, 27% chance of damaging wind over 30y; extreme-heat days projected 7→15/yr by 2055 (HVAC capex compounding) — expect insurance premiums to compound above CPI over the hold.
Questions for the listing agent
- What do current leases actually rent for vs. the listed asking? Can we see a recent rent roll and the last 12 months of T-12 income?
- It's been on market 90 days. Have you received any prior offers? Is the seller open to a 31% concession, seller financing, or rate buy-down credit?
- Built in 1924 — when were the roof, HVAC, electrical panel, plumbing, and water heater last replaced?
- What does the HOA fee cover, when was the last increase, and are there any pending special assessments or reserve-fund shortfalls?
- Any open or pending special assessments — roof, HVAC, plumbing, elevator, façade? What's the per-unit balance and payoff schedule, and is the seller paying it off at close or rolling it to the buyer?
- Why hasn't it sold? Are there any deal-killer items the seller is aware of (foundation, flood, title, zoning, code violations)?
- Is there a deadline driving the sale (1031 exchange, divorce, estate, relocation)? That informs how much negotiation room exists.
- Schools are B-rated — typically a magnet for longer-tenancy family renters. What's the average tenant stay here, and is there a school-zone premium baked into asking?
- Crime grade is F in this area — have there been break-ins, vandalism, or insurance claims at this property in the last 3 years? What carrier currently insures it and at what premium?
- The area grade is low — what's the realistic commute time and amenity access for the typical tenant pool here? Any planned neighborhood developments (good or bad) we should know about?
- What's the average days-on-market for RENTAL listings here right now (not sales)? A rising rental-DOM trend means longer vacancies and softer asking-rent achievability than the comps imply.
- What's the recent tenant-quality profile in this submarket — average credit score on applications, eviction rate, late-payment / NSF rate, and stable-employment percentage? A property-management company in the area should have these aggregated.
- How much new apartment / multifamily construction is in the pipeline within 1–3 miles? Heavy new supply (>2% of stock underway) typically softens rents 12–24 months out; light construction supports rent growth.
Investment metrics
- 1% rule
- 0.69% ✗
- Cap rate
- 4.35%
- Cash-on-cash
- -6.93%
- DSCR
- 0.69
- GRM
- 12.1
CMA / ARV
No comps found within radius.
Projected returns pro-forma
10.0% appreciation · 8.0% rent growth · sell at horizon
- IRR
- 20.8%
- Equity multiple
- 2.71×
- Total profit
- $487,758
- Equity at exit
- $918,897
- IRR
- 20.0%
- Equity multiple
- 6.64×
- Total profit
- $1,611,025
- Equity at exit
- $1,981,636
Cash invested: $285,600 (down + closing). Projections, not guarantees.
Landlord ↔ Tenant lean methodology
- Overall (CITY)
- 0 Strongly Tenant-Friendly
- State New York
- 15 Strongly Tenant-Friendly · D+10
- County
- — inherits STATE
- City New York
- 0 Strongly Tenant-Friendly · D+34
ZIP-level market 10013
- Home prices YoY
- 4.4%
- Rents YoY
- 9.4%
- Active inventory
- 231
- Price-to-rent
- 12.1×
Monthly cashflow live
- Estimated rent
- $7,006 high interval (Pro) →
- Mortgage (P&I)
- −$5,349
- Tax from tax record
- −$643 /mo · $7,720/yr
- Insurance
- −$425
- HOA
- −$766
- Vacancy / Maint / Mgmt
- −$1,471
- Net cashflow
- $-1,648
Break-even live
Sensitivity live
| Price | -10% $-1,071 | -5% $-1,360 | +0% $-1,648 | +5% $-1,937 | +10% $-2,226 |
|---|---|---|---|---|---|
| Rent | -10% $-2,202 | -5% $-1,925 | +0% $-1,648 | +5% $-1,371 | +10% $-1,095 |
| Rate | -1.0pp $-1,135 | -0.5pp $-1,389 | base $-1,648 | +0.5pp $-1,913 | +1.0pp $-2,181 |
UW: 25.0% down · 7.5% · 30yr · 1.5% tax · 5.0% vac · 8.0% maint · 8.0% mgmt
Financing live
Cash to close
- Down payment
- $255,000
- Closing costs
- $30,600
- Reserves months
- —
- Total cash needed
- —
Loan-product check · same deal, 3 products live
Conventional
25% down · 7.5% · 30yr
- Down + closing
- —
- Monthly P&I
- —
- Monthly cashflow
- —
- DSCR
- —
- Eligible?
- —
Personal DTI + credit; lowest rate.
DSCR
20% down · 8.5% · 30yr
- Down + closing
- —
- Monthly P&I
- —
- Monthly cashflow
- —
- DSCR
- —
- Eligible?
- —
No personal income docs; deal must DSCR.
Hard money
10% down · 12.0% · 12mo
- Down + closing
- —
- Monthly P&I
- —
- Monthly cashflow
- —
- DSCR
- —
- Eligible?
- —
Short-term bridge; refi at stabilization.
Rent comps 40 comps
| Address | Beds | Baths | Sqft | Rent | $/sqft | DOM | Units | Dist |
|---|---|---|---|---|---|---|---|---|
| 88 Leonard St New York, NY | 1.0 | 1.0 | 598 | $7,966 | $13.32 | 10d | 13 | 0.01mi |
| 105 Duane St #183 New York, NY | 2.0 | 1.0–2.0 | 821 | $8,935 | $10.88 | 1d | 3 | 0.10mi |
| 111 Worth St New York, NY | 1.0–2.0 | 1.0–2.0 | 747 | $6,077 | $8.14 | 10d | 7 | 0.10mi |
| 120 Mulberry St Unit 1257050P New York, NY | 2.0 | 1.0 | 645 | $12,372 | $19.18 | 26d | 1 | 0.38mi |
| 400 Chambers St #587 New York, NY | 2.0 | 1.0–1.5 | 675 | $7,370 | $10.91 | 10d | 3 | 0.53mi |
| 140 Broadway Unit 1298277P New York, NY | 1.0 | 1.0 | 699 | $9,406 | $13.46 | 24d | 1 | 0.62mi |
| 180 Water St #537 New York, NY | 1.0–2.0 | 1.0–2.0 | 728 | $8,040 | $11.04 | 5d | 2 | 0.69mi |
| 389 S End Ave New York, NY | 3.0 | 1.0–2.0 | 1080 | $6,685 | $6.19 | 3d | 36 | 0.74mi |
| 63 Wall St #1971 New York, NY | 1.0 | 1.0 | 489 | $5,120 | $10.46 | 1d | 2 | 0.80mi |
| 67 Wall St #13 New York, NY | 1.0–2.0 | 1.0 | 636 | $5,750 | $9.03 | 5d | 2 | 0.81mi |
| 75 Wall St Unit 251 New York, NY | 1.0 | 1.5 | 653 | $6,580 | $10.08 | 26d | 1 | 0.83mi |
| 75 Wall St New York, NY | 3.0 | 1.0–3.0 | 452 | $7,598 | $16.81 | 17d | 16 | 0.83mi |
| 229 Chrystie St New York, NY | 1.0–2.0 | 1.0–2.0 | 810 | $6,120 | $7.56 | 6d | 3 | 0.83mi |
| 10 Downing St #131 New York, NY | 1.0 | 1.0 | 731 | $9,050 | $12.38 | 6d | 2 | 0.85mi |
| 95 Wall St New York, NY | 2.0 | 1.0–2.0 | 881 | $5,978 | $6.78 | 0d | 32 | 0.86mi |
| 11 E 1st St New York, NY | 2.0 | 1.0–2.0 | 1060 | $8,078 | $7.62 | 0d | 1 | 0.86mi |
| 3 Hanover Sq New York, NY | 3.0 | 1.0–2.0 | 600 | $4,534 | $7.56 | 26d | 5 | 0.87mi |
| 10 Hanover Sq New York, NY | 2.0 | 1.0–2.0 | 790 | $5,761 | $7.29 | 1d | 25 | 0.88mi |
| 104 MacDougal St Unit 1056263P New York, NY | 2.0 | 1.0 | 441 | $9,375 | $21.26 | 24d | 1 | 0.88mi |
| 125 Delancey St #1523 New York, NY | 1.0–2.0 | 1.0–2.0 | 850 | $7,860 | $9.25 | 4d | 2 | 0.90mi |
| 180 Broome St #1521 New York, NY | 1.0–2.0 | 1.0–2.0 | 850 | $7,970 | $9.38 | 4d | 2 | 0.98mi |
| 1 West St #546 New York, NY | 1.0 | 1.0 | 700 | $5,770 | $8.24 | 23d | 1 | 0.99mi |
| 25 Water St Unit 707 New York, NY | — | 1.0 | 550 | $3,950 | $7.18 | 26d | 1 | 1.03mi |
| 25 Water St Apt 706 New York, NY | — | 1.0 | 550 | $3,990 | $7.25 | 26d | 1 | 1.03mi |
| 52 Barrow St #2123 New York, NY | 1.0–2.0 | 1.0 | 547 | $6,420 | $11.73 | 12d | 3 | 1.04mi |
| 171 Suffolk St #1265 New York, NY | 1.0–2.0 | 1.0 | 650 | $6,950 | $10.69 | 10d | 2 | 1.09mi |
| 364 6th Ave Unit 1023432P New York, NY | 1.0 | 1.0 | 441 | $9,135 | $20.71 | 24d | 1 | 1.11mi |
| 120 Christopher St #1886 New York, NY | 1.0–2.0 | 1.0 | 574 | $5,640 | $9.82 | 1d | 3 | 1.11mi |
| 139 Christopher St Unit 1021914P New York, NY | 1.0–2.0 | 1.0 | 667 | $5,340 | $8.01 | 10d | 2 | 1.11mi |
| 140 Charles St Unit 14A New York, NY | 1.0 | 1.0 | 648 | $8,000 | $12.35 | 10d | 1 | 1.18mi |
| 177 Waverly Pl Unit 1075286P New York, NY | 1.0 | 1.0 | 452 | $10,000 | $22.12 | 26d | 1 | 1.20mi |
| 535 Hudson St #1032 New York, NY | 1.0–2.0 | 1.0 | 550 | $6,030 | $10.96 | 10d | 2 | 1.22mi |
| 93 1/2 E 7th St Unit 1054297P New York, NY | 2.0 | 1.0 | 495 | $10,000 | $20.20 | 24d | 1 | 1.24mi |
| 112 E 10th St Unit 1021937P New York, NY | 1.0–3.0 | 1.0–2.5 | 1296 | $5,772 | $4.45 | 5d | 2 | 1.26mi |
| 87 Perry St New York, NY | 2.0 | 2.0 | 748 | $18,500 | $24.73 | 26d | 1 | 1.27mi |
| 101 E 10th St #1153 New York, NY | 1.0–2.0 | 1.0–2.0 | 575 | $6,630 | $11.53 | 1d | 2 | 1.28mi |
| 815 Broadway #204 New York, NY | 1.0 | 1.0 | 522 | $8,250 | $15.80 | 10d | 1 | 1.32mi |
| 107 Columbia Hts #1757 Brooklyn, NY | 1.0–2.0 | 1.0–2.0 | 708 | $5,650 | $7.98 | 1d | 2 | 1.32mi |
| 290 W 12th St #1592 New York, NY | 1.0–2.0 | 1.0–2.0 | 515 | $7,110 | $13.81 | 10d | 2 | 1.40mi |
| 1 Union Sq S #1174 New York, NY | 2.0 | 1.0–2.0 | 775 | $10,120 | $13.06 | 12d | 3 | 1.42mi |
HOA detail condo
- Monthly dues
- $766 · $9,192/yr
- Assessments
- None detected in remarks — confirm with the listing agent.
Listing history 22 events
-
2026-06-21days on market $1,020,000 Active 90 DOM
-
2026-06-18days on market $1,020,000 Active 87 DOM
-
2026-06-17days on market $1,020,000 Active 86 DOM
-
2026-06-15days on market $1,020,000 Active 84 DOM
-
2026-06-13days on market $1,020,000 Active 82 DOM
-
2026-06-10days on market $1,020,000 Active 78 DOM
-
2026-06-08days on market $1,020,000 Active 77 DOM
-
2026-06-08days on market $1,020,000 Active 76 DOM
-
2026-06-04days on market $1,020,000 Active 73 DOM
-
2026-06-03days on market $1,020,000 Active 72 DOM
-
2026-06-01days on market $1,020,000 Active 70 DOM
-
2026-05-31remarks 691-char remark
-
2026-05-31pricedays on market $1,020,000 Active 69 DOM
-
2026-04-13price $1,100,000
-
2026-03-16$1,160,000 Active
-
2024-05-06price $1,199,000
-
2014-03-31soldstatus $631,315
-
2012-12-06$620,000
-
2012-12-06$631,315
-
2012-12-06$620,000
-
2012-12-06$620,000
-
2012-12-06$620,000
ⓘ Source: listings_history table (triggers on properties + properties_extension) + one-shot
backfill from property_details.listing_events for pre-trigger history.
Tax reassessment forecast NY · Partial reset (capped growth)
- Current annual tax
- $7,720 · $643/mo
- Projected year-2 tax
- $12,479 · $1,040/mo
- Expected delta
- +$4,759/yr (+$397/mo · 61.6%)
ⓘ Screening estimate from a state-policy table — verify with the county assessor before closing.
Climate risk First Street
- Flood 1/10 Low FEMA zone X (unshaded) · 0% chance over 30 yrs
- Wildfire 1/10 Low
- Heat 6/10 Major 7 d/yr ≥99°F today · 15 d/yr by 30 yrs out
- Wind 6/10 Major 27% chance of damaging wind over 30 yrs
- Air quality 4/10 Moderate 5 unhealthy d/yr today · 7 by 30 yrs out
Nearby sold comps map
Loading sold comps map…
Walkable amenities ~0.75 mi
Loading nearby amenities…
Taxation est. · year 1
- Rental income
- $84,078
- − Mortgage interest
- −$57,136
- − Property taxes
- −$7,720
- − Insurance
- −$5,100
- − Repairs & maintenance
- −$6,726
- − Management
- −$6,726
- − HOA
- −$9,192
- − Depreciation
- −$29,673
- Taxable loss
- −$38,196
- Est. tax savings @ 24.0%
- +$9,167
- After-tax cash flow
- $-10,612/yr
For passive investors: Depreciation is non-cash, so a rental often shows a tax loss while cash-flowing — sheltering income. Rental losses are passive: they offset passive income freely, and up to $25,000/yr can offset ordinary (W-2) income if you actively participate and your MAGI is under $100k (phasing out to $0 by $150k); unused losses carry forward. On sale, claimed depreciation is recaptured at up to 25%, and gains may owe capital-gains tax (a 1031 exchange can defer both). Figures are a year-1 estimate at your 24.0% rate — not tax advice; consult a CPA.
Schools (NCES district)
No district data.
Livability — New York
- Score
- 75/100
- State rank
- #268
- US rank
- #4188
Category grades
Schools grade is shown separately in the Schools card above.
Census & demographics
- Census place
- New York, NY
- County
- New York County · 1,599,927 people
- City population
- 7,731,280
- Metro
- New York-Newark-Jersey City, NY-NJ-PA
- Population (ZIP)
- 27,219
- Household income
- $161,154
- Rent vs Own
- Severe rent burden
- 2000.0
Population outlook (New York County) Hauer SSP2
- Today (2025)
- 1,825,725 people
- By 2030
- 1,904,611 · +4.3%
- By 2040
- 2,052,719 · +12.4%
- By 2050
- 2,206,601 · +20.9%
- By 2075
- 2,509,427 · +37.4%
- By 2100
- 2,702,933 · +48.0%
Race, ethnicity, and origin ACS 2023
- Neighborhood character
- Diverse neighborhood (Simpson 0.62)
- Race & ethnicity
- White 53% Asian 31% Hispanic / Latino 8% Two or more races 7% Black 3%
- Hispanic origin (detail)
- Mexican 1%
- Common ancestry
- Scotch-Irish 4% Romanian 3% Scandinavian 3%
- Foreign-born
- 31% · China, Canada, South Korea
- Languages at home
- 65% English-only · Chinese 19% Other Indo-European 7% Spanish 3%
Political lean MEDSL · New York
- 2024 margin
- Solid D (+64.8) · D 82.4% · R 17.6%
- 2008→2024 swing
- -7.4pp toward R · 2008: 72.2pp · 2024: 64.8pp
- All cycles
- 2024: D+64.8 2020: D+74.5 2016: D+77.2 2012: D+69.6 2008: D+72.2
Not yet ingested
- Civics
- —
Market trends
- HPI YoY
- ▲ 10.12%
- Current HPI
- 239.8397
- Rent YoY
- ▲ 9.40%
- Metro
- New York-Newark-Jersey City, NY-NJ-PA
- State GDP YoY
- ▲ 2.60%
- F500 in state
- 92
Industry mix (Fortune 500 HQ in NY)
| Industry | F500 HQs | Revenue |
|---|---|---|
| Financial Services | 10 | $950B |
|
||
| Consumer Goods | 9 | $162B |
|
||
| Insurance | 4 | $225B |
|
||
| Telecommunications | 2 | $144B |
|
||
| Pharmaceuticals | 2 | $112B |
|
||
| Media / Entertainment | 2 | $69B |
|
||
Price history
+77.4% since first listed9 events — show timeline
- 2026-04-13 Price Changed $1,100,000 RLS at REBNY
- 2026-03-16 Listed $1,160,000 RLS at REBNY
- 2024-05-06 Price Changed $1,199,000 RLS at REBNY
- 2014-03-31 Sold (Public Records) $631,315 Public Records
- 2012-12-06 Listed $620,000 RLS at REBNY
- 2012-12-06 Listed $620,000 RLS at REBNY
- 2012-12-06 Listed $620,000 RLS at REBNY
- 2012-12-06 Listed $631,315 RLS at REBNY
- 2012-12-06 Listed $620,000 RLS at REBNY
Property tax history
+1.7%/yrLatest (2025): $7,720 · -24.6% YoY. Source: county tax records.
Cash-flow waterfall
monthlySold comps — $/sqft
last 12 mo · ≤1 miLoading sold comps…