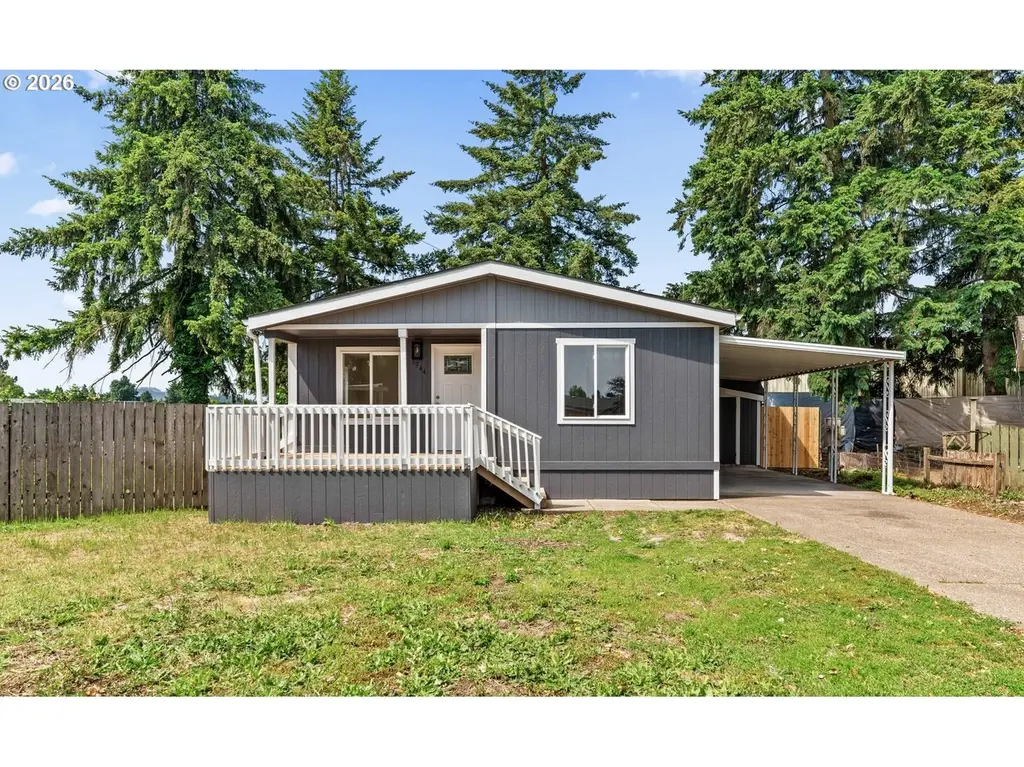
1944 Mctavish Ct · Springfield, OR
Flood risk 3/10 · Minor
- FEMA flood zone
- X (unshaded)
- Chance of flooding over 30 yrs
- 0.18%
- Est. flood insurance / yr
- $507 – $1,088
Fire risk 2/10 · Minimal
- Est. fire insurance / yr
- $498 – $926
Heat risk 4/10 · Minor
- Hot days now (above 92°F)
- 7 days/yr
- Hot days in 30 yrs
- 15 days/yr
Wind risk 1/10 · Minimal
- Chance of severe wind over 30 yrs
- —
Air-quality risk 10/10 · Severe
- Unhealthy air days now
- 15 days/yr
- Unhealthy air days in 30 yrs
- 16 days/yr
Risk factors via First Street. Map © Google.
Why this score? — see what drove the C+ grade
The composite is a weighted blend of 9 inputs, each scored 0–100. Each bar is that input's sub-score; the figure is the points it added to the 100-point composite (weight × sub-score).
- Cash flow +27.7/30.0
- DSCR +9.7/10.0
- 1% rule +6.7/10.0
- ARV discount +4.3/15.0
- Livability +4.2/5.0
- Rent growth +3.7/5.0
- Condition / age +2.5/5.0
- Schools +2.4/10.0
- Appreciation +0.0/10.0
$154,900
🖨 Deal sheet 📄 Offer letter ✓ Due diligence
Listing remarks MLS
Best Buy! Don't miss this 3bd/2ba charmer in a great family-friendly park, close to schools, shopping, and the new hospital. Located on a large, culdesac, totally fenced lot, this home features new windows, laminated flooring, master suite, vaulted ceilings, heat pump for economy, and all appliances. You'll appreciate the private setting. 2-car carport, and 8x20 shop, too!
Key facts
- New carpet
- Newer windows
- Fresh interior paint
Tags
Property features AI
Finance
- Other: Unit dimensions: approximately 56 ft long by 26 ft wide; Unit main level area approximately 1,352 (title area); Land lease extends through 01/01/2099
- Financial info: Monthly lot rent applies
- HOA & community: Located in Lochaven park; Park has pet rules (see park rules and regulations); Land lease community (land not included)
Exterior
- Parking: Carport; Driveway parking for 2 vehicles
- Utilities: Public water; Public sewer; Electric hot water; Electric service
- Home design: Manufactured home in a park; Updated/remodeled condition; Single-story (one level); No significant view
- Construction: Built in 1991; T-111 siding exterior; Composition roof; Skirting foundation
- Exterior features: Covered patio; Fenced yard; Tool shed; Yard; Located on a cul-de-sac; Level lot; Paved road access
Interior
- Kitchen: Quartz countertops; Free-standing range; Microwave; Dishwasher; Garbage disposal
- Bedrooms: Primary bedroom on main level with attached bathroom and wainscoting; Second bedroom on main level with wainscoting; Third bedroom on main level
- Flooring: Vinyl flooring in living areas; Wall-to-wall carpet in bedrooms
- Bathrooms: Two full bathrooms (both on the main level)
- Heating & cooling: Forced-air heating; Heat pump heating and cooling
- Interior features: High ceilings; Vaulted ceilings; Accessibility features: one-level living; Laundry area; Crawl space basement; Vinyl-framed windows
- Laundry & utility: Utility room on main level
Neighborhood map
What this means for you Summary
Snapshot
- This is a 3-bed/2.0-bath manufactured listed at $155k.
Deal economics
- At list price, monthly cash flow is $465 ($6k/yr) — positive.
- The deal already cash-flows at list — no discount required.
- Meets the 1% rule at list price ($2k rent vs $155k).
- Recommended offer: $153k (1.5% below list) — sets the bar for market timing.
- Cap rate 9.9% vs local median 3.0% in Springfield — top-decile yield for the area; either an underpriced asset or a hidden risk that comps aren't pricing in. Stress-test before assuming the spread holds.
Location & tenants
- Location reads 83/100 on livability (#40 in OR, #934 nationally) — a professional / high-income tenant draw. Strengths: amenities A+, commute A+, housing A+; Watch: crime D+, employment D+.
- Springfield SD 19 (suburban): math 19% / reading 38% proficiency, ranked #48 of 58 in OR (top 83%) — low school quality limits family demand, transient renter base, plan for 1-2y turnover.
- Zoned schools: Guy Lee Elementary School (math 15% / reading 15%, grade F, #392 of 412 statewide, top 96%, 347 students, 62% FRL); Hamlin Middle School (math 15% / reading 35%, grade F, #104 of 128 statewide, top 83%, 571 students, 64% FRL); Springfield High School (math 30% / reading 54%, grade F, #64 of 143 statewide, top 46%, 1,317 students, 65% FRL).
- Market conditions: Rents rising fast (+4.8%/yr); 163 active listings in the ZIP; 22 comparable units currently listed for rent nearby; rentals at typical pace (median 21d on market — plan ~3-4 weeks tenant-placement turnaround); 41% of comp listings sitting > 30 days — soft ceiling on asking rent; 1,808 units permitted in Lane County in 2024 (972 in 5+ unit buildings).
- This rent runs 33% of the median local income ($66k/yr) — at the standard rent-burdened threshold; future hikes will face affordability resistance.
Forward outlook
- Local home prices are declining (-3.0%/yr); year-one equity from $1k of loan paydown is wiped out by about $5k of value loss. Plan a longer hold.
- Lane County population projected at +15% by 2050 — long-run rental-demand tailwind backs the buy-and-hold thesis.
- At projected returns (-3.0% appreciation + 4.8% rent growth), your $43k cash investment doubles in ~8 years — after that, you're playing with house money.
Negotiation context
- It's been on market 19 days — a 2% lower offer ($153k) is reasonable based on typical stale-listing flexibility.
- 3 sale attempts since 24y ago with the ask held roughly flat each time — persistent listings suggest the price (not the market) is what's stuck; bring a comps-based counter.
- Current owner paid $34k; list at $155k implies a 356% gain — meaningful room to come down on a strong offer.
Questions for the listing agent
- Is there a deadline driving the sale (1031 exchange, divorce, estate, relocation)? That informs how much negotiation room exists.
- Schools are D-rated, which usually means shorter tenancies and higher turnover. Who's the typical renter profile here, and what's been the actual vacancy rate?
- Crime grade is D in this area — have there been break-ins, vandalism, or insurance claims at this property in the last 3 years? What carrier currently insures it and at what premium?
- What's the average days-on-market for RENTAL listings here right now (not sales)? A rising rental-DOM trend means longer vacancies and softer asking-rent achievability than the comps imply.
- What's the recent tenant-quality profile in this submarket — average credit score on applications, eviction rate, late-payment / NSF rate, and stable-employment percentage? A property-management company in the area should have these aggregated.
- How much new for-sale + rental construction is in the pipeline within 1–3 miles? Heavy new supply typically softens prices + rents 12–24 months out; constrained supply supports both.
Investment metrics
- 1% rule
- 1.17% ✓
- Cap rate
- 9.90%
- Cash-on-cash
- 12.87%
- DSCR
- 1.57
- GRM
- 7.2
CMA / ARV
- ARV (on-the-fly)
- $144,664
- Comps found
- 12
Show comp detail 12 sales within ~0.75 mi
| Address | Dist | Beds/Ba | Sqft | Sold | Price | $/sf | Match |
|---|---|---|---|---|---|---|---|
| 484 Scotts Glen Dr | 0.13mi | 3/2.0 | 1,404 (+4%) | 4mo | $150,000 | $107 | 84 |
| 451 Lochaven Ave | 0.16mi | 3/2.0 | 1,296 (-4%) | 2mo | $157,000 | $121 | 84 |
| 2150 Laura St #202 | 0.28mi | 3/2.0 | 1,296 (-4%) | 0mo | $81,500 | $63 | 80 |
| 898 Lochaven Ave | 0.26mi | 3/2.0 | 1,296 (-4%) | 2mo | $150,000 | $116 | 79 |
| 328 Scotts Glen Dr | 0.26mi | 3/2.0 | 1,323 (-2%) | 7mo | $345,000 | $261 | 78 |
| 475 Lochaven Ave | 0.15mi | 3/2.0 | 1,296 (-4%) | 14mo | $150,000 | $116 | 74 |
| 595 Lochaven Ave | 0.11mi | 3/2.0 | 1,414 (+5%) | 16mo | $199,800 | $141 | 74 |
| 2150 Laura St #222 | 0.28mi | 3/2.0 | 1,404 (+4%) | 14mo | $68,000 | $48 | 69 |
| 1120 W Fairview Dr #3 | 0.29mi | 3/2.0 | 1,232 (-9%) | 4mo | $99,000 | $80 | 68 |
| 708 Lochaven Ave | 0.17mi | 2/2.0 (-1) | 1,188 (-12%) | 16mo | $105,000 | $88 | 53 |
| 2150 Laura St #204 | 0.28mi | 2/2.0 (-1) | 1,535 (+14%) | 8mo | $89,000 | $58 | 52 |
| 2150 Laura St #213 | 0.28mi | 2/2.0 (-1) | 1,188 (-12%) | 12mo | $74,000 | $62 | 52 |
Match score weights: distance 35% · size 25% · config 20% · recency 20%. Top-matched comps best support the ARV.
Projected returns pro-forma
-3.0% appreciation · 4.81% rent growth · sell at horizon
- IRR
- 4.6%
- Equity multiple
- 1.18×
- Total profit
- $7,825
- Equity at exit
- $23,096
- IRR
- 15.5%
- Equity multiple
- 2.36×
- Total profit
- $59,037
- Equity at exit
- $13,393
Cash invested: $43,372 (down + closing). Projections, not guarantees.
Landlord ↔ Tenant lean methodology
- Overall (STATE)
- 28 Tenant-Leaning
- State Oregon
- 28 Tenant-Leaning · D+6
- County
- — inherits STATE
- City
- — inherits STATE
ZIP-level market 97477
- Rents YoY
- 4.8%
- Active inventory
- 163
- Price-to-rent
- 7.2×
Monthly cashflow live
- Estimated rent
- $1,805 high interval (Pro) →
- Mortgage (P&I)
- −$812
- Tax from tax record
- −$84 /mo · $1,005/yr
- Insurance
- −$65
- HOA
- −$0
- Vacancy / Maint / Mgmt
- −$379
- Net cashflow
- $465
Break-even live
UW: 25.0% down · 7.5% · 30yr · 1.5% tax · 5.0% vac · 8.0% maint · 8.0% mgmt
Financing live
Cash to close
- Down payment
- $38,725
- Closing costs
- $4,647
- Reserves months
- —
- Total cash needed
- —
Loan-product check · same deal, 3 products live
Conventional
25% down · 7.5% · 30yr
- Down + closing
- —
- Monthly P&I
- —
- Monthly cashflow
- —
- DSCR
- —
- Eligible?
- —
Personal DTI + credit; lowest rate.
DSCR
20% down · 8.5% · 30yr
- Down + closing
- —
- Monthly P&I
- —
- Monthly cashflow
- —
- DSCR
- —
- Eligible?
- —
No personal income docs; deal must DSCR.
Hard money
10% down · 12.0% · 12mo
- Down + closing
- —
- Monthly P&I
- —
- Monthly cashflow
- —
- DSCR
- —
- Eligible?
- —
Short-term bridge; refi at stabilization.
Rent comps 22 comps
| Address | Beds | Baths | Sqft | Rent | $/sqft | DOM | Units | Dist |
|---|---|---|---|---|---|---|---|---|
| 668 W Quinalt St Springfield, OR | 3.0 | 1.5 | 1100 | $1,695 | $1.54 | 43d | 1 | 0.18mi |
| 636 W Quinalt St Springfield, OR | 3.0 | 1.5 | 1045 | $1,595 | $1.53 | 43d | 1 | 0.19mi |
| 956 W Olympic St Springfield, OR | 3.0 | 2.0 | 1212 | $2,200 | $1.82 | 13d | 1 | 0.35mi |
| 2220 Shadylane Dr Springfield, OR | 2.0 | 1.5 | 860 | $1,730 | $2.01 | 21d | 4 | 0.47mi |
| 506 W Centennial Blvd Springfield, OR | 1.0–3.0 | 1.0–2.0 | 1182 | $1,699 | $1.44 | 21d | 3 | 0.49mi |
| 506 W Centennial Blvd Springfield, OR | 2.0 | 1.0 | 885 | $1,684 | $1.90 | 13d | 4 | 0.49mi |
| 859 W M St Springfield, OR | 4.0 | 1.0 | 1504 | $1,700 | $1.13 | 43d | 1 | 0.50mi |
| 2609 S Cloverleaf Loop Unit 2609 Springfield, OR | 3.0 | 1.5 | 1500 | $1,975 | $1.32 | 13d | 1 | 0.52mi |
| 2555 Gateway St Springfield, OR | 2.0 | 1.0 | 682 | $1,649 | $2.42 | 21d | 14 | 0.53mi |
| 243 R St Springfield, OR | 1.0–3.0 | 1.0–2.5 | 867 | $1,649 | $1.90 | 43d | 6 | 0.68mi |
| 175 G St Unit C Springfield, OR | 3.0 | 1.0 | 975 | $1,450 | $1.49 | 43d | 1 | 1.04mi |
| 562 Kelly Blvd Springfield, OR | 4.0 | 1.0 | 1500 | $1,995 | $1.33 | 43d | 1 | 1.07mi |
| 700 1st St Unit 18 Springfield, OR | 2.0 | 1.0 | 900 | $1,350 | $1.50 | 13d | 1 | 1.08mi |
| 3440 Westward Ho Ave Unit 3440 Eugene, OR | 2.0 | 1.0 | 950 | $1,995 | $2.10 | 43d | 1 | 1.11mi |
| 3450 McKenna Dr Eugene, OR | 1.0–2.0 | 1.0–2.0 | 1125 | $1,720 | $1.53 | 13d | 5 | 1.19mi |
| 375 Marche Chase Dr Eugene, OR | 1.0–2.0 | 1.0–2.0 | 896 | $1,960 | $2.19 | 13d | 8 | 1.19mi |
| 754 Leigh St Eugene, OR | 2.0 | 1.0 | 950 | $1,395 | $1.47 | 13d | 1 | 1.29mi |
| 430 Pioneer Pkwy W Unit 432 Springfield, OR | 2.0 | 1.5 | 1100 | $1,795 | $1.63 | 43d | 1 | 1.29mi |
| 3225 Kinsrow Ave Eugene, OR | 1.0–4.0 | 1.0–2.5 | 1009 | $2,467 | $2.44 | 21d | 10 | 1.30mi |
| 1217 R St #5 Springfield, OR | 2.0 | 1.0 | 900 | $1,395 | $1.55 | 21d | 1 | 1.39mi |
| 1253 R St Unit 4 Springfield, OR | 2.0 | 1.5 | 1000 | $1,295 | $1.29 | 43d | 1 | 1.41mi |
| 3120 Van Ave Eugene, OR | 2.0 | 1.5 | 1104 | $1,695 | $1.54 | 13d | 4 | 1.43mi |
Listing history 14 events
-
2026-06-18days on market $154,900 Active 19 DOM
-
2026-06-17days on market $154,900 Active 18 DOM
-
2026-06-16days on market $154,900 Active 17 DOM
-
2026-06-15days on market $154,900 Active 16 DOM
-
2026-06-14days on market $154,900 Active 14 DOM
-
2026-06-10days on market $154,900 Active 11 DOM
-
2026-06-09days on market $154,900 Active 10 DOM
-
2026-06-08days on market $154,900 Active 9 DOM
-
2026-06-07days on market $154,900 Active 8 DOM
-
2026-06-03days on market $154,900 Active 4 DOM
-
2026-06-02days on market $154,900 Active 3 DOM
-
2026-06-01days on market $154,900 Active 2 DOM
-
2026-05-31remarks 614-char remark
-
2026-05-31$154,900 Active 1 DOM
ⓘ Source: listings_history table (triggers on properties + properties_extension) + one-shot
backfill from property_details.listing_events for pre-trigger history.
Tax reassessment forecast OR · Resets to sale price
- Current annual tax
- $1,005 · $84/mo
- Projected year-2 tax
- $1,503 · $125/mo
- Expected delta
- +$498/yr (+$41/mo · 49.6%)
ⓘ Screening estimate from a state-policy table — verify with the county assessor before closing.
Climate risk First Street
- Flood 3/10 Moderate FEMA zone X (unshaded) · 18% chance over 30 yrs
- Wildfire 2/10 Low
- Heat 4/10 Moderate 7 d/yr ≥92°F today · 15 d/yr by 30 yrs out
- Wind 1/10 Low
- Air quality 10/10 Extreme 15 unhealthy d/yr today · 16 by 30 yrs out
Nearby sold comps map
Loading sold comps map…
Walkable amenities ~0.75 mi
Loading nearby amenities…
Taxation est. · year 1
- Rental income
- $21,655
- − Mortgage interest
- −$8,677
- − Property taxes
- −$1,005
- − Insurance
- −$774
- − Repairs & maintenance
- −$1,732
- − Management
- −$1,732
- − Depreciation
- −$4,506
- Taxable income
- $3,228
- Est. tax owed @ 24.0%
- −$775
- After-tax cash flow
- $4,806/yr
For passive investors: Depreciation is non-cash, so a rental often shows a tax loss while cash-flowing — sheltering income. Rental losses are passive: they offset passive income freely, and up to $25,000/yr can offset ordinary (W-2) income if you actively participate and your MAGI is under $100k (phasing out to $0 by $150k); unused losses carry forward. On sale, claimed depreciation is recaptured at up to 25%, and gains may owe capital-gains tax (a 1031 exchange can defer both). Figures are a year-1 estimate at your 24.0% rate — not tax advice; consult a CPA.
Schools (NCES district)
- District
- Springfield SD 19
- NCES district ID
- 4111670
- Math proficiency
- 19% ▼ -13.00%
- Reading proficiency
- 38% ▼ -10.00%
- Median HH income
- $42,236
- Composite
- 24.14/100
- National rank
- #7746
- State rank
- #48 of 58 in OR
Livability — Springfield
- Score
- 83/100
- State rank
- #40
- US rank
- #934
Category grades
Schools grade is shown separately in the Schools card above.
Census & demographics
- Census place
- Springfield, OR
- County
- Lane County · 310,476 people
- City population
- 76,907
- Metro
- Eugene-Springfield, OR
- Population (ZIP)
- 37,534
- Household income
- $65,662
- Rent vs Own
- Severe rent burden
- 1817.0
Population outlook (Lane County) Hauer SSP2
- Today (2025)
- 391,933 people
- By 2030
- 405,860 · +3.6%
- By 2040
- 429,386 · +9.6%
- By 2050
- 452,016 · +15.3%
- By 2075
- 508,825 · +29.8%
- By 2100
- 531,208 · +35.5%
Race, ethnicity, and origin ACS 2023
- Neighborhood character
- Predominantly White (77%)
- Race & ethnicity
- White 77% Hispanic / Latino 13% Two or more races 10% Asian 1% Native American 1%
- Hispanic origin (detail)
- Mexican 10%
- Common ancestry
- Lithuanian 4% Portuguese 4% Italian 3%
- Foreign-born
- 6% · Canada
- Languages at home
- 89% English-only · Spanish 9% Other Asian/Pacific 1%
Political lean MEDSL · Lane
- 2024 margin
- Strong D (+23.1) · D 60.0% · R 36.9% · Other 3.1%
- 2008→2024 swing
- -4.3pp toward R · 2008: 27.4pp · 2024: 23.1pp
- All cycles
- 2024: D+23.1 2020: D+24.3 2016: D+18.9 2012: D+23.4 2008: D+27.4
Not yet ingested
- Civics
- —
Market trends
- HPI YoY
- ▼ -489.08%
- Current HPI
- 299.6863
- Rent YoY
- ▲ 4.81%
- Metro
- Eugene-Springfield, OR
- State GDP YoY
- ▲ 2.05%
- F500 in state
- 2
Industry mix (Fortune 500 HQ in OR)
| Industry | F500 HQs | Revenue |
|---|---|---|
| Consumer Goods | 1 | $51B |
|
||
Price history
+308.7% since first listed6 events — show timeline
- 2026-05-30 Listed $154,900 RMLS
- 2008-12-10 Sold (MLS) $34,000 RMLS
- 2008-11-19 Delisted — RMLS
- 2008-11-04 Listed $39,900 RMLS
- 2003-03-31 Sold (MLS) $36,000 RMLS
- 2002-11-14 Listed $37,900 RMLS
Property tax history
+2.2%/yrLatest (2025): $1,005 · +1.6% YoY. Source: county tax records.
Cash-flow waterfall
monthlySold comps — $/sqft
last 12 mo · ≤1 miLoading sold comps…