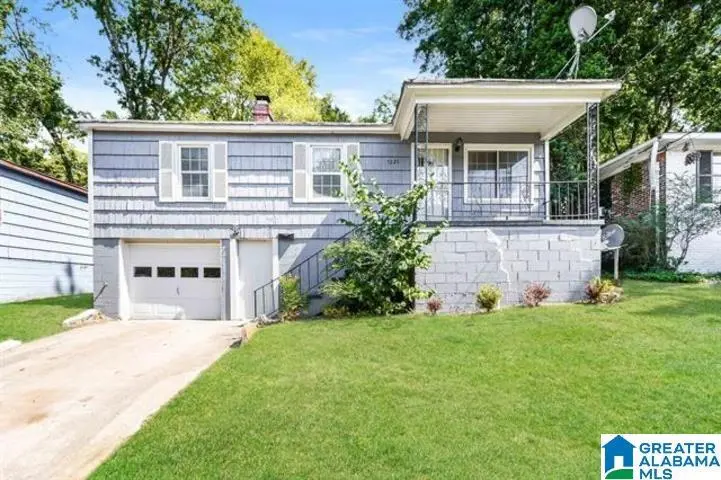
7225 Rome Ave · Birmingham, AL
Flood risk 1/10 · Minimal
- FEMA flood zone
- X (unshaded)
- Chance of flooding over 30 yrs
- 0.0%
- Est. flood insurance / yr
- $473 – $860
Fire risk 4/10 · Minor
- Est. fire insurance / yr
- $916 – $1,700
Heat risk 5/10 · Moderate
- Hot days now (above 106°F)
- 7 days/yr
- Hot days in 30 yrs
- 18 days/yr
Wind risk 6/10 · Moderate
- Chance of severe wind over 30 yrs
- 27.0%
Air-quality risk 5/10 · Moderate
- Unhealthy air days now
- 7 days/yr
- Unhealthy air days in 30 yrs
- 9 days/yr
Risk factors via First Street. Map © Google.
Why this score? — see what drove the C grade
The composite is a weighted blend of 9 inputs, each scored 0–100. Each bar is that input's sub-score; the figure is the points it added to the 100-point composite (weight × sub-score).
- Cash flow +28.0/30.0
- DSCR +9.9/10.0
- 1% rule +7.6/10.0
- Livability +3.4/5.0
- Rent growth +3.0/5.0
- Condition / age +2.5/5.0
- Schools +0.9/10.0
- ARV discount +0.8/15.0
- Appreciation +0.0/10.0
$94,900
🖨 Deal sheet 📄 Offer letter ✓ Due diligence
Listing remarks MLS
Solid income-producing investment! Tenant-occupied home generating $1,139/month with lease in place. Well-maintained property offering stable cash flow in a high-demand rental area. Ideal for investors looking to add a performing asset to their portfolio. Available individually or as part of a portfolio.
Key facts
- 6,969 sq ft lot
- Garage
- Built 1959
Neighborhood map
What this means for you Summary
Snapshot
- This is a 3-bed/1.0-bath single-family listed at $95k.
Deal economics
- At list price, monthly cash flow is $294 ($4k/yr) — positive.
- The deal already cash-flows at list — no discount required.
- Meets the 1% rule at list price ($1k rent vs $95k).
- Recommended offer: $92k (3.0% below list) — sets the bar for market timing.
- Cap rate 10.0% vs local median 6.2% in Birmingham — top-decile yield for the area; either an underpriced asset or a hidden risk that comps aren't pricing in. Stress-test before assuming the spread holds.
Location & tenants
- Location reads 67/100 on livability (#78 in AL) — a middle-class / working-renter tenant base. Strengths: commute A+, cost of living A+, housing A+; Watch: amenities C-, schools F, crime F.
- Birmingham City (urban): math 4% / reading 20% proficiency, ranked #116 of 129 in AL (top 90%) — low school quality limits family demand, transient renter base, plan for 1-2y turnover; 82% free/reduced lunch — lower-income household profile, screen leases tightly.
- Market conditions: Rents rising (+1.8%/yr); 128 active listings in the ZIP; 40 comparable units currently listed for rent nearby; rentals lingering (median 44d on market — plan ~5-8 weeks vacancy on turnover, expect pricing pressure); 52% of comp listings sitting > 30 days — soft ceiling on asking rent; lower-income renter base — watch delinquency; 2,114 units permitted in Jefferson County in 2024 (556 in 5+ unit buildings).
- This rent runs 34% of the median local income ($43k/yr) — at the standard rent-burdened threshold; future hikes will face affordability resistance.
Forward outlook
- Local home prices are declining (-3.0%/yr); year-one equity from $656 of loan paydown is wiped out by about $3k of value loss. Plan a longer hold.
- Jefferson County population projected to shrink 4% by 2050 — rents likely to lag national; underwrite the cash flow, not the appreciation.
- At projected returns (-3.0% appreciation + 1.8% rent growth), your $27k cash investment doubles in ~10 years — after that, you're playing with house money.
Negotiation context
- It's been on market 55 days — a 3% lower offer ($92k) is reasonable based on typical stale-listing flexibility.
- 3 sale attempts since 5y ago; this cycle's ask has dropped $17k (15%) from the opening price — seller is motivated, your offer sets the floor, not the list.
Risks & watch-outs
- Watch-outs: built in 1959 — expect roof / HVAC / electrical / plumbing capex.
- Climate carrying-cost: major wind risk, 27% chance of damaging wind over 30y; extreme-heat days projected 7→18/yr by 2055 (HVAC capex compounding) — expect insurance premiums to compound above CPI over the hold.
Questions for the listing agent
- It's been on market 55 days. Have you received any prior offers? Is the seller open to a 3% concession, seller financing, or rate buy-down credit?
- Built in 1959 — when were the roof, HVAC, electrical panel, plumbing, and water heater last replaced?
- Is there a deadline driving the sale (1031 exchange, divorce, estate, relocation)? That informs how much negotiation room exists.
- Schools are F-rated, which usually means shorter tenancies and higher turnover. Who's the typical renter profile here, and what's been the actual vacancy rate?
- Crime grade is F in this area — have there been break-ins, vandalism, or insurance claims at this property in the last 3 years? What carrier currently insures it and at what premium?
- What's the average days-on-market for RENTAL listings here right now (not sales)? A rising rental-DOM trend means longer vacancies and softer asking-rent achievability than the comps imply.
- What's the recent tenant-quality profile in this submarket — average credit score on applications, eviction rate, late-payment / NSF rate, and stable-employment percentage? A property-management company in the area should have these aggregated.
- How much new for-sale + rental construction is in the pipeline within 1–3 miles? Heavy new supply typically softens prices + rents 12–24 months out; constrained supply supports both.
Investment metrics
- 1% rule
- 1.26% ✓
- Cap rate
- 10.01%
- Cash-on-cash
- 13.27%
- DSCR
- 1.59
- GRM
- 6.6
CMA / ARV
- ARV (median comp)
- $82,588
- List price
- $94,900
- Delta
- 14.91%
- Verdict
- OVERPRICED
- Comps
- 20 within 1.0 mi
Show comp detail 12 sales within ~0.75 mi
| Address | Dist | Beds/Ba | Sqft | Sold | Price | $/sf | Match |
|---|---|---|---|---|---|---|---|
| 913 77th St S | 0.35mi | 3/1.5 | 1,238 (+2%) | 8mo | $65,000 | $53 | 72 |
| 7432 Queenstown Ave | 0.28mi | 3/2.0 | 1,127 (-7%) | 5mo | $179,000 | $159 | 66 |
| 7705 Belmont Ave | 0.36mi | 3/1.0 | 1,324 (+9%) | 5mo | $60,000 | $45 | 64 |
| 816 Vanderbilt St | 0.38mi | 3/1.0 | 1,096 (-10%) | 3mo | $81,500 | $74 | 63 |
| 7915 7th Ave S | 0.73mi | 3/1.0 | 1,162 (-4%) | 1mo | $85,000 | $73 | 58 |
| 713 77th Pl S | 0.43mi | 3/1.0 | 1,364 (+12%) | 2mo | $215,000 | $158 | 58 |
| 758 Vanderbilt St | 0.43mi | 3/2.0 | 1,096 (-10%) | 3mo | $175,000 | $160 | 57 |
| 2120 3rd Ave N | 0.71mi | 3/2.0 | 1,184 (-3%) | 4mo | $170,000 | $144 | 55 |
| 7332 Sparta Ave | 0.15mi | 3/3.0 | 1,396 (+15%) | 7mo | $181,500 | $130 | 54 |
| 515 72nd St S | 0.71mi | 3/1.5 | 1,290 (+6%) | 7mo | $105,500 | $82 | 48 |
| 6909 Suburban Ter | 0.74mi | 3/2.0 | 1,287 (+6%) | 8mo | $107,500 | $84 | 45 |
| 7801 7th Ave S | 0.66mi | 3/1.0 | 1,040 (-14%) | 8mo | $125,000 | $120 | 39 |
Match score weights: distance 35% · size 25% · config 20% · recency 20%. Top-matched comps best support the ARV.
Projected returns pro-forma
-3.0% appreciation · 1.82% rent growth · sell at horizon
- IRR
- 1.9%
- Equity multiple
- 1.07×
- Total profit
- $1,945
- Equity at exit
- $14,150
- IRR
- 10.3%
- Equity multiple
- 1.76×
- Total profit
- $20,220
- Equity at exit
- $8,205
Cash invested: $26,572 (down + closing). Projections, not guarantees.
Landlord ↔ Tenant lean methodology
- Overall (STATE)
- 90 Strongly Landlord-Friendly
- State Alabama
- 90 Strongly Landlord-Friendly · R+15
- County
- — inherits STATE
- City
- — inherits STATE
ZIP-level market 35206
- Home prices YoY
- -32.0%
- Rents YoY
- 1.8%
- Active inventory
- 128
- Price-to-rent
- 6.6×
Monthly cashflow live
- Estimated rent
- $1,199 high interval (Pro) →
- Mortgage (P&I)
- −$498
- Tax from tax record
- −$116 /mo · $1,393/yr
- Insurance
- −$40
- HOA
- −$0
- Vacancy / Maint / Mgmt
- −$252
- Net cashflow
- $294
Break-even live
UW: 25.0% down · 7.5% · 30yr · 1.5% tax · 5.0% vac · 8.0% maint · 8.0% mgmt
Financing live
Cash to close
- Down payment
- $23,725
- Closing costs
- $2,847
- Reserves months
- —
- Total cash needed
- —
Loan-product check · same deal, 3 products live
Conventional
25% down · 7.5% · 30yr
- Down + closing
- —
- Monthly P&I
- —
- Monthly cashflow
- —
- DSCR
- —
- Eligible?
- —
Personal DTI + credit; lowest rate.
DSCR
20% down · 8.5% · 30yr
- Down + closing
- —
- Monthly P&I
- —
- Monthly cashflow
- —
- DSCR
- —
- Eligible?
- —
No personal income docs; deal must DSCR.
Hard money
10% down · 12.0% · 12mo
- Down + closing
- —
- Monthly P&I
- —
- Monthly cashflow
- —
- DSCR
- —
- Eligible?
- —
Short-term bridge; refi at stabilization.
Rent comps 40 comps
| Address | Beds | Baths | Sqft | Rent | $/sqft | DOM | Units | Dist |
|---|---|---|---|---|---|---|---|---|
| 7216 Paris Ave Birmingham, AL | 3.0 | 1.5 | 966 | $1,125 | $1.16 | 19d | 1 | 0.15mi |
| 7313 Paris Ave Birmingham, AL | 3.0 | 2.0 | 1000 | $1,395 | $1.40 | 3d | 1 | 0.17mi |
| 7341 Rome Ave Birmingham, AL | 3.0 | 1.0 | 1000 | $1,300 | $1.30 | 44d | 1 | 0.19mi |
| 7341 Rome Ave Birmingham, AL | 3.0 | 1.0 | 1000 | $1,275 | $1.27 | 3d | 1 | 0.19mi |
| 7213 Naples Ave Birmingham, AL | 3.0 | 1.5 | 925 | $1,100 | $1.19 | 44d | 1 | 0.25mi |
| 7213 Naples Ave Birmingham, AL | 3.0 | 1.5 | 937 | $1,100 | $1.17 | 12d | 1 | 0.25mi |
| 7404 Paris Ave Birmingham, AL | 3.0 | 1.5 | 802 | $1,200 | $1.50 | 44d | 1 | 0.27mi |
| 836 Vanderbilt St Birmingham, AL | 3.0 | 1.0 | 1072 | $850 | $0.79 | 24d | 1 | 0.41mi |
| 756 Vanderbilt St Birmingham, AL | 3.0 | 2.0 | 1096 | $1,000 | $0.91 | 44d | 1 | 0.46mi |
| 630 77th St S Birmingham, AL | 2.0 | 2.0 | 1100 | $983 | $0.89 | 3d | 1 | 0.48mi |
| 7808 Vienna Ave Birmingham, AL | 2.0 | 1.0 | 904 | $850 | $0.94 | 44d | 1 | 0.56mi |
| 7740 Rugby Ave Unit 2 Birmingham, AL | 2.0 | 1.0 | 800 | $1,000 | $1.25 | 44d | 1 | 0.56mi |
| 7740 Rugby Ave Unit b Birmingham, AL | 2.0 | 1.0 | 800 | $1,100 | $1.38 | 44d | 1 | 0.56mi |
| 7825 Rugby Ct Birmingham, AL | 2.0 | 1.0 | 929 | $875 | $0.94 | 21d | 1 | 0.58mi |
| 7728 Rugby Ave Birmingham, AL | 2.0 | 1.0 | 700 | $850 | $1.21 | 44d | 1 | 0.60mi |
| 7701 7th Ave S Birmingham, AL | 2.0 | 1.0 | 800 | $850 | $1.06 | 24d | 1 | 0.62mi |
| 832 79th Pl S Birmingham, AL | 3.0 | 1.0 | 960 | $1,250 | $1.30 | 24d | 1 | 0.63mi |
| 7823 Rugby Ave Birmingham, AL | 3.0 | 1.0 | 1023 | $1,175 | $1.15 | 44d | 1 | 0.63mi |
| 7827 Rugby Ave Birmingham, AL | 3.0 | 1.0 | 1365 | $850 | $0.62 | 3d | 1 | 0.64mi |
| 605 71st St S Birmingham, AL | 3.0 | 1.5 | 1024 | $1,303 | $1.27 | 2d | 1 | 0.72mi |
| 7620 4th Ave S Birmingham, AL | 3.0 | 1.0 | 1144 | $1,025 | $0.90 | 44d | 1 | 0.75mi |
| 768 80th Pl S Unit 1 Birmingham, AL | 3.0 | 2.0 | 1134 | $1,200 | $1.06 | 44d | 1 | 0.77mi |
| 8013 Rugby Ave Birmingham, AL | 3.0 | 2.0 | 1460 | $1,150 | $0.79 | 24d | 1 | 0.79mi |
| 7931 7th Ave S Birmingham, AL | 3.0 | 1.0 | 1320 | $1,450 | $1.10 | 44d | 1 | 0.80mi |
| 7815 4th Ave S Birmingham, AL | 3.0 | 2.0 | 1496 | $1,650 | $1.10 | 2d | 1 | 0.83mi |
| 764 81st St S Unit B Birmingham, AL | 2.0 | 1.0 | 800 | $800 | $1.00 | 44d | 1 | 0.84mi |
| 7025 4th Ave S Birmingham, AL | 3.0 | 1.0 | 1090 | $845 | $0.78 | 44d | 1 | 0.87mi |
| 2884 Montevallo Park Rd Irondale, AL | 3.0 | 2.0 | 1275 | $2,206 | $1.73 | 3d | 1 | 0.87mi |
| 7801 3rd Ave S Unit B Birmingham, AL | 2.0 | 1.5 | 1100 | $1,000 | $0.91 | 44d | 1 | 0.89mi |
| 7129 3rd Ave S Birmingham, AL | 3.0 | 2.0 | 1264 | $1,095 | $0.87 | 3d | 1 | 0.89mi |
| 735 81st St S Birmingham, AL | 3.0 | 2.0 | 1224 | $1,400 | $1.14 | 24d | 1 | 0.91mi |
| 775 81st Pl S Birmingham, AL | 3.0 | 1.0 | 1232 | $1,095 | $0.89 | 24d | 1 | 0.91mi |
| 731 81st St S Birmingham, AL | 3.0 | 1.0 | 1221 | $995 | $0.81 | 10d | 1 | 0.91mi |
| 7829 3rd Ave S Birmingham, AL | 3.0 | 1.5 | 1005 | $1,025 | $1.02 | 44d | 1 | 0.92mi |
| 6732 Frankfort Ave Birmingham, AL | 3.0 | 1.0 | 924 | $995 | $1.08 | 44d | 1 | 0.93mi |
| 8122 Rugby Ave Unit B Birmingham, AL | 2.0 | 1.0 | 900 | $795 | $0.88 | 44d | 1 | 0.95mi |
| 7721 1st Ave S Birmingham, AL | 3.0 | 1.0 | 956 | $949 | $0.99 | 24d | 1 | 0.96mi |
| 514 81st St S Birmingham, AL | 4.0 | 2.0 | 1174 | $1,295 | $1.10 | 44d | 1 | 0.97mi |
| 7716 Sunrise Cir Birmingham, AL | 1.0–2.0 | 1.0 | 795 | $1,000 | $1.26 | 44d | 1 | 0.97mi |
| 6936 66th St S Birmingham, AL | 3.0 | 1.0 | 880 | $1,050 | $1.19 | 44d | 1 | 0.98mi |
Listing history 27 events
-
2026-06-16statusdays on market $94,900 Pending 55 DOM
-
2026-06-15days on market $94,900 Active 54 DOM
-
2026-06-13days on market $94,900 Active 52 DOM
-
2026-06-10days on market $94,900 Active 49 DOM
-
2026-06-09days on market $94,900 Active 48 DOM
-
2026-06-08days on market $94,900 Active 47 DOM
-
2026-06-07days on market $94,900 Active 46 DOM
-
2026-06-03days on market $94,900 Active 42 DOM
-
2026-06-02days on market $94,900 Active 41 DOM
-
2026-06-01days on market $94,900 Active 40 DOM
-
2026-05-31days on market $94,900 Active 39 DOM
-
2026-05-13price $94,900 305-char remark
Show marketing remark (305 chars)
Solid income-producing investment! Tenant-occupied home generating $1,139/month with lease in place. Well-maintained property offering stable cash flow in a high-demand rental area. Ideal for investors looking to add a performing asset to their portfolio. Available individually or as part of a portfolio.
-
2026-04-23$112,000 Active 305-char remark
Show marketing remark (305 chars)
Solid income-producing investment! Tenant-occupied home generating $1,139/month with lease in place. Well-maintained property offering stable cash flow in a high-demand rental area. Ideal for investors looking to add a performing asset to their portfolio. Available individually or as part of a portfolio.
-
2023-12-15soldstatus $96,500 Sold 571-char remark
Show marketing remark (571 chars)
Discover the ideal opportunity at 7225 Rome Avenue, whether you're an investor or a homeowner! This recently updated 3-bedroom, 1-bath home boasts hardwood floors in all bedrooms, a 1-car garage, and an inviting open back patio perfect for entertaining or enjoying the spacious backyard. With its prime location just minutes from the Walmart Supercenter, Amazon warehouse, and local shops and restaurants, this property offers both immediate comfort and long-term potential. Don't miss out on this fantastic opportunity – schedule a viewing today and make it yours!
-
2023-12-11historical Contingent 571-char remark
Show marketing remark (571 chars)
Discover the ideal opportunity at 7225 Rome Avenue, whether you're an investor or a homeowner! This recently updated 3-bedroom, 1-bath home boasts hardwood floors in all bedrooms, a 1-car garage, and an inviting open back patio perfect for entertaining or enjoying the spacious backyard. With its prime location just minutes from the Walmart Supercenter, Amazon warehouse, and local shops and restaurants, this property offers both immediate comfort and long-term potential. Don't miss out on this fantastic opportunity – schedule a viewing today and make it yours!
-
2023-10-04$104,900 Active 571-char remark
Show marketing remark (571 chars)
Discover the ideal opportunity at 7225 Rome Avenue, whether you're an investor or a homeowner! This recently updated 3-bedroom, 1-bath home boasts hardwood floors in all bedrooms, a 1-car garage, and an inviting open back patio perfect for entertaining or enjoying the spacious backyard. With its prime location just minutes from the Walmart Supercenter, Amazon warehouse, and local shops and restaurants, this property offers both immediate comfort and long-term potential. Don't miss out on this fantastic opportunity – schedule a viewing today and make it yours!
-
2022-08-07price $895
-
2022-06-28soldstatus $1,541,040
-
2022-04-22soldstatus $72,500
-
2022-04-22soldstatus $51,000
-
2022-04-21soldstatus $72,500 Sold
-
2022-01-09historical Contingent
-
2021-12-19$79,000 Active
-
2021-12-16historical $79,000
-
2003-03-12soldstatus $68,000
-
2002-07-19soldstatus $32,500
-
1997-01-15soldstatus $45,000
ⓘ Source: listings_history table (triggers on properties + properties_extension) + one-shot
backfill from property_details.listing_events for pre-trigger history.
Tax reassessment forecast AL · Resets to sale price
- Current annual tax
- $1,393 · $116/mo
- Projected year-2 tax
- $1,393 · $116/mo
- Expected delta
- $0/yr ($0/mo · 0.0%)
ⓘ Screening estimate from a state-policy table — verify with the county assessor before closing.
Climate risk First Street
- Flood 1/10 Low FEMA zone X (unshaded) · 0% chance over 30 yrs
- Wildfire 4/10 Moderate
- Heat 5/10 Major 7 d/yr ≥106°F today · 18 d/yr by 30 yrs out
- Wind 6/10 Major 27% chance of damaging wind over 30 yrs
- Air quality 5/10 Major 7 unhealthy d/yr today · 9 by 30 yrs out
Nearby sold comps map
Loading sold comps map…
Walkable amenities ~0.75 mi
Loading nearby amenities…
Taxation est. · year 1
- Rental income
- $14,387
- − Mortgage interest
- −$5,316
- − Property taxes
- −$1,393
- − Insurance
- −$474
- − Repairs & maintenance
- −$1,151
- − Management
- −$1,151
- − Depreciation
- −$2,761
- Taxable income
- $2,141
- Est. tax owed @ 24.0%
- −$514
- After-tax cash flow
- $3,012/yr
For passive investors: Depreciation is non-cash, so a rental often shows a tax loss while cash-flowing — sheltering income. Rental losses are passive: they offset passive income freely, and up to $25,000/yr can offset ordinary (W-2) income if you actively participate and your MAGI is under $100k (phasing out to $0 by $150k); unused losses carry forward. On sale, claimed depreciation is recaptured at up to 25%, and gains may owe capital-gains tax (a 1031 exchange can defer both). Figures are a year-1 estimate at your 24.0% rate — not tax advice; consult a CPA.
Schools (NCES district)
- District
- Birmingham City
- NCES district ID
- 0100390
- Math proficiency
- 4% ▼ -17.00%
- Reading proficiency
- 20% ▼ -4.00%
- Median HH income
- $31,988
- Composite
- 9.49/100
- National rank
- #9850
- State rank
- #116 of 129 in AL
Livability — Birmingham
- Score
- 67/100
- State rank
- #78
- US rank
- #10412
Category grades
Schools grade is shown separately in the Schools card above.
Census & demographics
- Census place
- Birmingham, AL
- County
- Jefferson County · 527,445 people
- City population
- 210,422
- Metro
- Birmingham-Hoover, AL
- Population (ZIP)
- 15,621
- Household income
- $42,549
- Rent vs Own
- Severe rent burden
- 1169.0
Population outlook (Jefferson County) Hauer SSP2
- Today (2025)
- 669,185 people
- By 2030
- 669,694 · +0.1%
- By 2040
- 661,388 · -1.2%
- By 2050
- 643,086 · -3.9%
- By 2075
- 577,267 · -13.7%
- By 2100
- 474,758 · -29.1%
Race, ethnicity, and origin ACS 2023
- Neighborhood character
- Predominantly Black (73%)
- Race & ethnicity
- Black 73% White 22% Two or more races 3% Hispanic / Latino 2%
- Common ancestry
- Slovak 1%
- Foreign-born
- 3% · Canada
- Languages at home
- 97% English-only · Spanish 2% Other Indo-European 0%
Political lean MEDSL · Jefferson
- 2024 margin
- D (+10.4) · D 54.6% · R 44.2% · Other 1.2%
- 2008→2024 swing
- +5.4pp toward D · 2008: 5.1pp · 2024: 10.4pp
- All cycles
- 2024: D+10.4 2020: D+13.2 2016: D+7.2 2012: D+6.0 2008: D+5.1
Not yet ingested
- Civics
- —
Market trends
- HPI YoY
- ▼ -68.70%
- Current HPI
- 146.2168
- Rent YoY
- ▲ 1.82%
- Metro
- Birmingham-Hoover, AL
- State GDP YoY
- ▲ 2.94%
- F500 in state
- 4
Industry mix (Fortune 500 HQ in AL)
| Industry | F500 HQs | Revenue |
|---|---|---|
| Financial Services | 1 | $8B |
|
||
| Healthcare | 1 | $5B |
|
||
Price history
+110.9% since first listed16 events — show timeline
- 2026-05-13 Price Changed $94,900 Greater Alabama MLS
- 2026-04-23 Listed $112,000 Greater Alabama MLS
- 2023-12-15 Sold (MLS) $96,500 Greater Alabama MLS
- 2023-12-11 Contingent — Greater Alabama MLS
- 2023-10-04 Listed $104,900 Greater Alabama MLS
- 2022-08-07 Price Changed $895 RENT.
- 2022-06-28 Sold (Public Records) $1,541,040 Public Records
- 2022-04-22 Sold (Public Records) $51,000 Public Records
- 2022-04-22 Sold (Public Records) $72,500 Public Records
- 2022-04-21 Sold (MLS) $72,500 Greater Alabama MLS
- 2022-01-09 Contingent — Greater Alabama MLS
- 2021-12-19 Listed $79,000 Greater Alabama MLS
- 2021-12-16 Coming Soon $79,000 Greater Alabama MLS
- 2003-03-12 Sold (Public Records) $68,000 Public Records
- 2002-07-19 Sold (Public Records) $32,500 Public Records
- 1997-01-15 Sold (Public Records) $45,000 Public Records
Property tax history
+10.4%/yrLatest (2025): $1,393 · +15.4% YoY. Source: county tax records.
Cash-flow waterfall
monthlySold comps — $/sqft
last 12 mo · ≤1 miLoading sold comps…