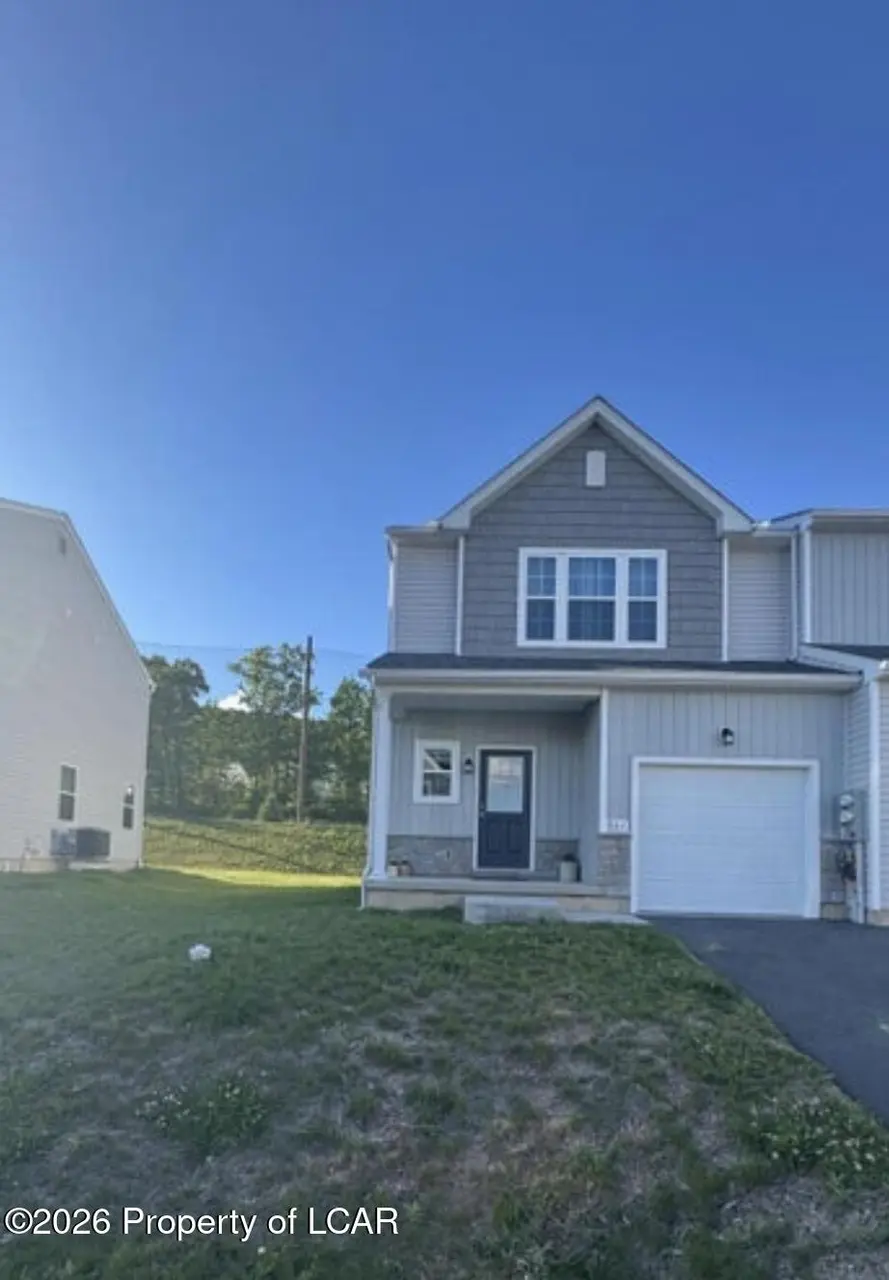
861 Champions Drive Dr · Beech Mountain Lakes, PA
Flood risk 6/10 · Moderate
- FEMA flood zone
- X (unshaded)
- Chance of flooding over 30 yrs
- 0.75%
- Est. flood insurance / yr
- $507 – $1,088
Fire risk 1/10 · Minimal
- Est. fire insurance / yr
- $511 – $949
Heat risk 2/10 · Minimal
- Hot days now (above 93°F)
- 7 days/yr
- Hot days in 30 yrs
- 16 days/yr
Wind risk 3/10 · Minor
- Chance of severe wind over 30 yrs
- 7.0%
Air-quality risk 2/10 · Minimal
- Unhealthy air days now
- 1 days/yr
- Unhealthy air days in 30 yrs
- 2 days/yr
Risk factors via First Street. Map © Google.
Why this score? — see what drove the D+ grade
The composite is a weighted blend of 9 inputs, each scored 0–100. Each bar is that input's sub-score; the figure is the points it added to the 100-point composite (weight × sub-score).
- ARV discount +15.0/15.0
- Appreciation +10.0/10.0
- Cash flow +6.9/30.0
- Livability +3.6/5.0
- Rent growth +2.5/5.0
- Condition / age +2.5/5.0
- 1% rule +2.3/10.0
- Schools +2.0/10.0
- DSCR +1.1/10.0
$295,000
🖨 Deal sheet 📄 Offer letter ✓ Due diligence
Listing remarks MLS
The Greens at Sand Springs are both elegant and spacious, with a floorplan that will make you feel right at home. Upon entering, you'll be welcomed by an open-concept first floor, featuring a Kitchen that has everything you need for cooking and entertaining complete with a large island for extra seating, ample counter space, a convenient pantry.
Key facts
- Garage
- Built 2023
- Listed 9 days
Property features AI
Finance
- Other: Property listed as a residential condo/townhome subtype in some records
- HOA & community: Homeowners association with an annual fee of $240 (approximately $20/month)
Exterior
- Parking: Attached 1-car garage
- Utilities: Shared well water; Public sewer
- Home design: Single-family residence; Three or more levels
- Construction: Vinyl siding construction
- Exterior features: Vinyl siding; Located in the Sand Springs subdivision; Residential zoning
Interior
- Kitchen: Eat-in kitchen
- Bathrooms: 2 full bathrooms; 1 half bathroom
- Heating & cooling: Central air conditioning; Natural gas heating with forced air
- Interior features: Eat-in kitchen; Full, unfinished basement
Neighborhood map
What this means for you Summary
Snapshot
- This is a 3-bed/2.5-bath single-family listed at $295k.
Deal economics
- At list price, monthly cash flow is $-449 ($-5k/yr) — negative.
- To cash-flow at today's rent, offer at most $216k (26.9% below list).
- To meet the 1% rule (rent ≥ 1% of price), the offer needs to be $217k (26.6% below list).
- Recommended offer: $216k (26.9% below list) — sets the bar for cash-flow.
- Cap rate 4.5% vs local median 3.7% in Beech Mountain Lakes — meaningfully above typical; check what's discounted (condition, days-on-market, listing class) to confirm the premium yield is real.
Location & tenants
- Location reads 71/100 on livability (#698 in PA) — a middle-class / working-renter tenant base. Strengths: crime A+, employment A+, cost of living A+; Watch: schools D+, amenities F, commute F.
- Hazleton Area SD (suburban): math 18% / reading 30% proficiency, ranked #476 of 539 in PA (top 88%) — low school quality limits family demand, transient renter base, plan for 1-2y turnover.
- Market conditions: 134 active listings in the ZIP; 4 comparable units currently listed for rent nearby; rentals at typical pace (median 21d on market — plan ~3-4 weeks tenant-placement turnaround); 349 units permitted in Luzerne County in 2024 (16 in 5+ unit buildings).
Forward outlook
- In year one you build about $32k of equity ($2k loan paydown + $30k appreciation (10.0% local appreciation)).
- Luzerne County population projected at +4% by 2050 — modest demand growth; plan on rents tracking national, not racing it.
- By year 2, paydown + projected appreciation supports a ~$51k cash-out refi (75% LTV) — recoverable capital for the next deal without selling this one.
Negotiation context
- Only 10 days on market — expect competitive offers; lowballing is unlikely to land.
- 3 sale attempts since 2y ago with the ask held roughly flat each time — persistent listings suggest the price (not the market) is what's stuck; bring a comps-based counter.
Risks & watch-outs
- Climate carrying-cost: major flood risk — expect insurance premiums to compound above CPI over the hold.
Questions for the listing agent
- What do current leases actually rent for vs. the listed asking? Can we see a recent rent roll and the last 12 months of T-12 income?
- What does the HOA fee cover, when was the last increase, and are there any pending special assessments or reserve-fund shortfalls?
- Is there a deadline driving the sale (1031 exchange, divorce, estate, relocation)? That informs how much negotiation room exists.
- Schools are D-rated, which usually means shorter tenancies and higher turnover. Who's the typical renter profile here, and what's been the actual vacancy rate?
- The area grade is low — what's the realistic commute time and amenity access for the typical tenant pool here? Any planned neighborhood developments (good or bad) we should know about?
- What's the average days-on-market for RENTAL listings here right now (not sales)? A rising rental-DOM trend means longer vacancies and softer asking-rent achievability than the comps imply.
- What's the recent tenant-quality profile in this submarket — average credit score on applications, eviction rate, late-payment / NSF rate, and stable-employment percentage? A property-management company in the area should have these aggregated.
- How much new for-sale + rental construction is in the pipeline within 1–3 miles? Heavy new supply typically softens prices + rents 12–24 months out; constrained supply supports both.
Investment metrics
- 1% rule
- 0.73% ✗
- Cap rate
- 4.47%
- Cash-on-cash
- -6.53%
- DSCR
- 0.71
- GRM
- 11.4
CMA / ARV
- ARV (on-the-fly)
- $363,825
- Comps found
- 10
Show comp detail 10 sales within ~0.75 mi
| Address | Dist | Beds/Ba | Sqft | Sold | Price | $/sf | Match |
|---|---|---|---|---|---|---|---|
| 853 Champions Dr | 0.05mi | 3/2.5 | 1,510 (+2%) | 9mo | $286,640 | $190 | 87 |
| 855 Champions Dr | 0.03mi | 3/2.5 | 1,495 (+1%) | 14mo | $281,645 | $188 | 85 |
| 733 Quarry Rd | 0.27mi | 3/2.0 | 1,530 (+3%) | 2mo | $424,900 | $278 | 79 |
| 323 Long Run Rd | 0.26mi | 3/2.0 | 1,530 (+3%) | 2mo | $400,000 | $261 | 79 |
| 399 Long Run Rd | 0.17mi | 3/2.0 | 1,530 (+3%) | 10mo | $439,900 | $288 | 77 |
| 365 Long Run Rd | 0.07mi | 3/3.0 | 1,530 (+3%) | 19mo | $384,900 | $252 | 74 |
| 324 Long Run Rd | 0.25mi | 3/2.0 | 1,530 (+3%) | 10mo | $375,000 | $245 | 72 |
| 718 Quarry Rd | 0.32mi | 3/2.0 | 1,530 (+3%) | 10mo | $375,000 | $245 | 70 |
| 49 Reserve Dr | 0.16mi | 3/2.0 | 1,700 (+14%) | 1mo | $385,000 | $226 | 66 |
| 110 Refuge Dr | 0.72mi | 3/2.0 | 1,666 (+12%) | 11mo | $332,000 | $199 | 34 |
Match score weights: distance 35% · size 25% · config 20% · recency 20%. Top-matched comps best support the ARV.
Projected returns pro-forma
10.0% appreciation · 3.0% rent growth · sell at horizon
- IRR
- 19.7%
- Equity multiple
- 2.60×
- Total profit
- $132,152
- Equity at exit
- $265,759
- IRR
- 18.1%
- Equity multiple
- 5.99×
- Total profit
- $411,886
- Equity at exit
- $573,120
Cash invested: $82,600 (down + closing). Projections, not guarantees.
Landlord ↔ Tenant lean methodology
- Overall (STATE)
- 62 Landlord-Friendly
- State Pennsylvania
- 62 Landlord-Friendly · EVEN
- County
- — inherits STATE
- City
- — inherits STATE
ZIP-level market 18222
- Home prices YoY
- 10.2%
- Active inventory
- 134
- Price-to-rent
- 11.4×
Monthly cashflow live
- Estimated rent
- $2,165 medium interval (Pro) →
- Mortgage (P&I)
- −$1,547
- Tax from tax record
- −$470 /mo · $5,638/yr
- Insurance
- −$123
- HOA
- −$20
- Vacancy / Maint / Mgmt
- −$455
- Net cashflow
- $-449
Break-even live
UW: 25.0% down · 7.5% · 30yr · 1.5% tax · 5.0% vac · 8.0% maint · 8.0% mgmt
Financing live
Cash to close
- Down payment
- $73,750
- Closing costs
- $8,850
- Reserves months
- —
- Total cash needed
- —
Loan-product check · same deal, 3 products live
Conventional
25% down · 7.5% · 30yr
- Down + closing
- —
- Monthly P&I
- —
- Monthly cashflow
- —
- DSCR
- —
- Eligible?
- —
Personal DTI + credit; lowest rate.
DSCR
20% down · 8.5% · 30yr
- Down + closing
- —
- Monthly P&I
- —
- Monthly cashflow
- —
- DSCR
- —
- Eligible?
- —
No personal income docs; deal must DSCR.
Hard money
10% down · 12.0% · 12mo
- Down + closing
- —
- Monthly P&I
- —
- Monthly cashflow
- —
- DSCR
- —
- Eligible?
- —
Short-term bridge; refi at stabilization.
Rent comps 4 comps
| Address | Beds | Baths | Sqft | Rent | $/sqft | DOM | Units | Dist |
|---|---|---|---|---|---|---|---|---|
| 860 Champions Dr Drums, PA | 3.0 | 2.5 | 1510 | $2,200 | $1.46 | 44d | 1 | 0.05mi |
| 16 Scotia Dr Drums, PA | 3.0 | 2.5 | 1650 | $2,240 | $1.36 | 21d | 1 | 1.07mi |
| 11 Lazy Ln Drums, PA | 2.0 | 2.0 | 1063 | $1,815 | $1.71 | 13d | 1 | 1.18mi |
| 227 Sand Springs Dr Drums, PA | 2.0 | 2.0 | 1052 | $1,805 | $1.72 | 21d | 1 | 1.32mi |
HOA detail
- Monthly dues
- $20 · $240/yr
Listing history 9 events
-
2026-06-19days on market $295,000 Active 10 DOM
-
2026-06-18days on market $295,000 Active 9 DOM
-
2026-06-17days on market $295,000 Active 8 DOM
-
2026-06-16days on market $295,000 Active 7 DOM
-
2026-06-15days on market $295,000 Active 6 DOM
-
2026-06-14days on market $295,000 Active 4 DOM
-
2026-06-12days on market $295,000 Active 3 DOM
-
2026-06-09remarks 371-char remark
-
2026-06-09$295,000 Active 1 DOM
ⓘ Source: listings_history table (triggers on properties + properties_extension) + one-shot
backfill from property_details.listing_events for pre-trigger history.
Tax reassessment forecast PA · Partial reset (capped growth)
- Current annual tax
- $5,638 · $470/mo
- Projected year-2 tax
- $5,638 · $470/mo
- Expected delta
- $0/yr ($0/mo · 0.0%)
ⓘ Screening estimate from a state-policy table — verify with the county assessor before closing.
Climate risk First Street
- Flood 6/10 Major FEMA zone X (unshaded) · 75% chance over 30 yrs
- Wildfire 1/10 Low
- Heat 2/10 Low 7 d/yr ≥93°F today · 16 d/yr by 30 yrs out
- Wind 3/10 Moderate 7% chance of damaging wind over 30 yrs
- Air quality 2/10 Low 1 unhealthy d/yr today · 2 by 30 yrs out
Nearby sold comps map
Loading sold comps map…
Walkable amenities ~0.75 mi
Loading nearby amenities…
Taxation est. · year 1
- Rental income
- $25,981
- − Mortgage interest
- −$16,525
- − Property taxes
- −$5,638
- − Insurance
- −$1,475
- − Repairs & maintenance
- −$2,078
- − Management
- −$2,078
- − HOA
- −$240
- − Depreciation
- −$8,582
- Taxable loss
- −$10,635
- Est. tax savings @ 24.0%
- +$2,553
- After-tax cash flow
- $-2,840/yr
For passive investors: Depreciation is non-cash, so a rental often shows a tax loss while cash-flowing — sheltering income. Rental losses are passive: they offset passive income freely, and up to $25,000/yr can offset ordinary (W-2) income if you actively participate and your MAGI is under $100k (phasing out to $0 by $150k); unused losses carry forward. On sale, claimed depreciation is recaptured at up to 25%, and gains may owe capital-gains tax (a 1031 exchange can defer both). Figures are a year-1 estimate at your 24.0% rate — not tax advice; consult a CPA.
Schools (NCES district)
- District
- Hazleton Area SD
- NCES district ID
- 4211700
- Math proficiency
- 18% ▼ -3.00%
- Reading proficiency
- 30% ▼ -15.00%
- Median HH income
- $42,247
- Composite
- 20.44/100
- National rank
- #8582
- State rank
- #476 of 539 in PA
Livability — Beech Mountain Lakes
- Score
- 71/100
- State rank
- #698
- US rank
- #6837
Category grades
Schools grade is shown separately in the Schools card above.
Census & demographics
- Population (ZIP)
- 9,946
Population outlook (Luzerne County) Hauer SSP2
- Today (2025)
- 319,505 people
- By 2030
- 319,943 · +0.1%
- By 2040
- 322,643 · +1.0%
- By 2050
- 330,817 · +3.5%
- By 2075
- 379,145 · +18.7%
- By 2100
- 431,908 · +35.2%
Race, ethnicity, and origin ACS 2023
- Neighborhood character
- Predominantly White (86%)
- Race & ethnicity
- White 86% Hispanic / Latino 7% Two or more races 7% Black 2%
- Hispanic origin (detail)
- Puerto Rican 2% Dominican 4%
- Common ancestry
- Romanian 10% Scotch-Irish 2% Iranian 2%
- Foreign-born
- 2% · Canada
- Languages at home
- 94% English-only · Spanish 3% Other Indo-European 1% Arabic 1%
Political lean MEDSL · Luzerne
- 2024 margin
- R (+19.2) · D 40.0% · R 59.2%
- 2008→2024 swing
- -27.6pp toward R · 2008: 8.4pp · 2024: -19.2pp
- All cycles
- 2024: R+19.2 2020: R+14.4 2016: R+19.6 2012: D+4.8 2008: D+8.4
Not yet ingested
- Civics
- —
Market trends
- HPI YoY
- ▲ 28.01%
- Current HPI
- 302.4923
- Rent YoY
- —
- Metro
- —
- State GDP YoY
- ▲ 1.68%
- F500 in state
- 34
Industry mix (Fortune 500 HQ in PA)
| Industry | F500 HQs | Revenue |
|---|---|---|
| Healthcare | 2 | $309B |
|
||
| Insurance | 2 | $27B |
|
||
| Telecommunications / Media | 1 | $124B |
|
||
| Industrial Distribution | 1 | $22B |
|
||
| Financial Services | 1 | $20B |
|
||
| Chemicals / Materials | 1 | $18B |
|
||
Price history
+4.0% since first listed9 events — show timeline
- 2026-06-08 Listed $295,000 LCAR
- 2024-12-23 Sold (MLS) $288,000 LCAR
- 2024-11-25 Pending — LCAR
- 2024-11-25 Price Changed $288,000 LCAR
- 2024-11-10 Relisted — LCAR
- 2024-11-10 Price Changed $283,645 LCAR
- 2024-10-25 Pending — LCAR
- 2024-10-25 Price Changed $294,800 LCAR
- 2024-06-24 Listed $283,645 LCAR
Cash-flow waterfall
monthlySold comps — $/sqft
last 12 mo · ≤1 miLoading sold comps…