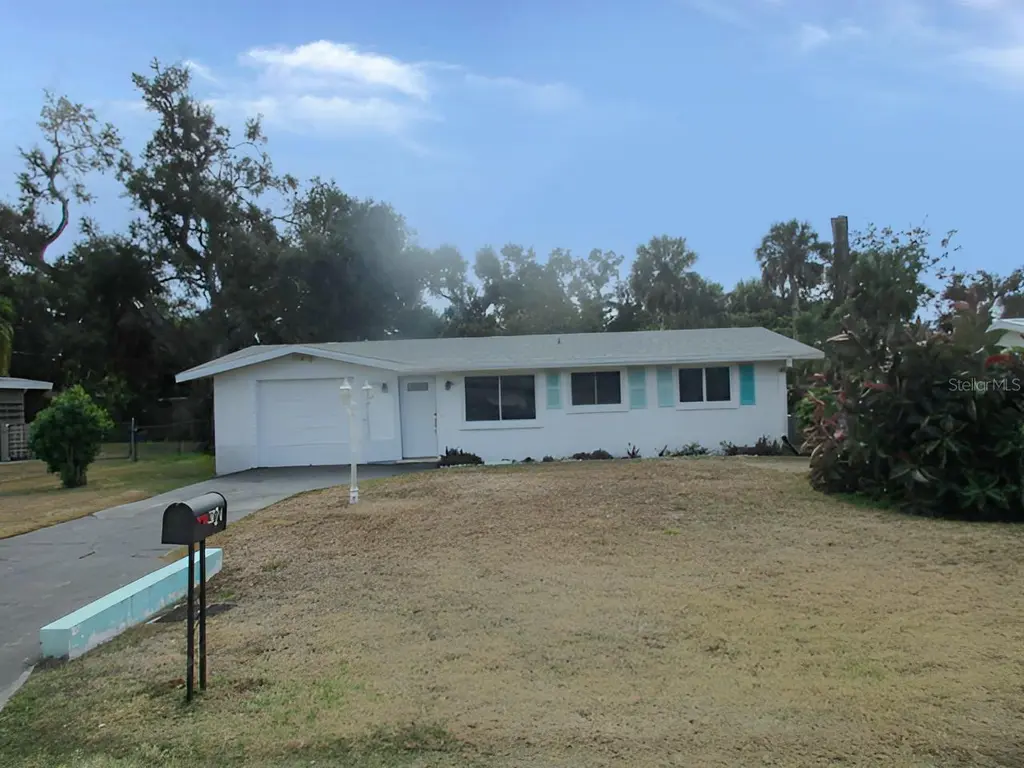
3024 Williamsburg St · Gulf Gate, FL
Flood risk 4/10 · Minor
- FEMA flood zone
- X (unshaded)
- Chance of flooding over 30 yrs
- 0.22%
- Est. flood insurance / yr
- $507 – $1,088
Fire risk 1/10 · Minimal
- Est. fire insurance / yr
- $947 – $1,759
Heat risk 10/10 · Severe
- Hot days now (above 107°F)
- 7 days/yr
- Hot days in 30 yrs
- 28 days/yr
Wind risk 10/10 · Severe
- Chance of severe wind over 30 yrs
- 99.0%
Air-quality risk 2/10 · Minimal
- Unhealthy air days now
- 1 days/yr
- Unhealthy air days in 30 yrs
- 1 days/yr
Risk factors via First Street. Map © Google.
Why this score? — see what drove the D grade
The composite is a weighted blend of 9 inputs, each scored 0–100. Each bar is that input's sub-score; the figure is the points it added to the 100-point composite (weight × sub-score).
- Cash flow +15.7/30.0
- ARV discount +7.5/15.0
- Schools +5.4/10.0
- DSCR +4.8/10.0
- 1% rule +3.1/10.0
- Livability +2.5/5.0
- Condition / age +2.5/5.0
- Rent growth +2.0/5.0
- Appreciation +0.0/10.0
$235,600
🖨 Deal sheet (PDF) 📄 Offer letter ✓ Due diligence
Listing remarks MLS
This ranch-style home offers potential on a lot close to town. This property presents a compelling investment opportunity with much potential. The two-bedroom, one-bathroom configuration offers flexibility for renovation and customization to suit various needs. The single-level design provides practical living convenience while allowing for creative updates and improvements. With thoughtful renovation, this home could be transformed into an attractive residence that maximizes its inherent possibilities and location advantages. Schedule your showing today to explore this ranch home's potential and spacious layout. This is a Fannie Mae Homepath property.
Key facts
- 9,004 sq ft lot
- Garage
- Built 1965
Neighborhood map
What this means for you Summary
Snapshot
- This is a 2-bed/2.0-bath single-family listed at $236k.
Deal economics
- At list price, monthly cash flow is $104 ($1k/yr) — positive.
- The deal already cash-flows at list — no discount required.
- To meet the 1% rule (rent ≥ 1% of price), the offer needs to be $192k (18.6% below list).
- Recommended offer: $192k (18.6% below list) — sets the bar for 1% rule.
Location & tenants
- Location reads: area grade D — affects rentability + tenant quality, not the cash-flow math above.
- Sarasota (urban): math 63% / reading 63% proficiency, ranked #7 of 73 in FL (top 10%) — acceptable for families but not a draw, mixed tenant base, ~2y average lease.
- Zoned schools: Gulf Gate Elementary School (math 60% / reading 65%, grade B, #601 of 2,144 statewide, top 28%, 655 students, 54% FRL); Brookside Middle School (math 62% / reading 55%, grade B, #148 of 571 statewide, top 26%, 745 students, 66% FRL); Riverview High School (math 61% / reading 65%, grade B-, #89 of 667 statewide, top 14%, 2,597 students, 35% FRL).
- Market conditions: Rents soft (-2.1%/yr); 566 active listings in the ZIP; 7,466 units permitted in Sarasota County in 2024 (2,138 in 5+ unit buildings).
- This rent runs 33% of the median local income ($70k/yr) — at the standard rent-burdened threshold; future hikes will face affordability resistance.
Forward outlook
- Local home prices are declining (-3.0%/yr); year-one equity from $2k of loan paydown is wiped out by about $7k of value loss. Plan a longer hold.
- Sarasota County population projected at +20% by 2050 — long-run rental-demand tailwind backs the buy-and-hold thesis.
Negotiation context
- It's been on market 103 days — a 9% lower offer ($214k) is reasonable based on typical stale-listing flexibility.
- 3 sale attempts; this cycle's ask has dropped $12k (5%) from the opening price — seller is motivated, your offer sets the floor, not the list.
Risks & watch-outs
- Climate carrying-cost: severe wind risk, 99% chance of damaging wind over 30y; extreme-heat days projected 7→28/yr by 2055 (HVAC capex compounding) — expect insurance premiums to compound above CPI over the hold.
Questions for the listing agent
- It's been on market 103 days. Have you received any prior offers? Is the seller open to a 19% concession, seller financing, or rate buy-down credit?
- Built in 1965 — when were the roof, HVAC, electrical panel, plumbing, and water heater last replaced?
- Why hasn't it sold? Are there any deal-killer items the seller is aware of (foundation, flood, title, zoning, code violations)?
- Is there a deadline driving the sale (1031 exchange, divorce, estate, relocation)? That informs how much negotiation room exists.
- The area grade is low — what's the realistic commute time and amenity access for the typical tenant pool here? Any planned neighborhood developments (good or bad) we should know about?
- What's the average days-on-market for RENTAL listings here right now (not sales)? A rising rental-DOM trend means longer vacancies and softer asking-rent achievability than the comps imply.
- What's the recent tenant-quality profile in this submarket — average credit score on applications, eviction rate, late-payment / NSF rate, and stable-employment percentage? A property-management company in the area should have these aggregated.
- How much new for-sale + rental construction is in the pipeline within 1–3 miles? Heavy new supply typically softens prices + rents 12–24 months out; constrained supply supports both.
Investment metrics
- 1% rule
- 0.81% ✗
- Cap rate
- 6.83%
- Cash-on-cash
- 1.90%
- DSCR
- 1.08
- GRM
- 10.2
CMA / ARV
No comps found within radius.
Projected returns pro-forma
-3.0% appreciation · 0.0% rent growth · sell at horizon
- IRR
- -16.3%
- Equity multiple
- 0.44×
- Total profit
- $-37,248
- Equity at exit
- $35,129
- IRR
- -13.7%
- Equity multiple
- 0.30×
- Total profit
- $-46,015
- Equity at exit
- $20,370
Cash invested: $65,968 (down + closing). Projections, not guarantees.
Landlord ↔ Tenant lean methodology
- Overall (STATE)
- 87 Strongly Landlord-Friendly
- State Florida
- 87 Strongly Landlord-Friendly · R+3
- County
- — inherits STATE
- City
- — inherits STATE
ZIP-level market 34231
- Rents YoY
- -2.1%
- Active inventory
- 566
- Price-to-rent
- 10.2×
Monthly cashflow live
- Estimated rent
- $1,918 medium interval (Pro) →
- Mortgage (P&I)
- −$1,236
- Tax from tax record
- −$77 /mo · $925/yr
- Insurance
- −$98
- HOA
- −$0
- Vacancy / Maint / Mgmt
- −$403
- Net cashflow
- $104
Break-even live
Sensitivity live
| Price | -10% $238 | -5% $171 | +0% $104 | +5% $38 | +10% $-29 |
|---|---|---|---|---|---|
| Rent | -10% $-47 | -5% $29 | +0% $104 | +5% $180 | +10% $256 |
| Rate | -1.0pp $223 | -0.5pp $164 | base $104 | +0.5pp $43 | +1.0pp $-19 |
UW: 25.0% down · 7.5% · 30yr · 1.5% tax · 5.0% vac · 8.0% maint · 8.0% mgmt
Financing live
Cash to close
- Down payment
- $58,900
- Closing costs
- $7,068
- Reserves months
- —
- Total cash needed
- —
Loan-product check · same deal, 3 products live
Conventional
25% down · 7.5% · 30yr
- Down + closing
- —
- Monthly P&I
- —
- Monthly cashflow
- —
- DSCR
- —
- Eligible?
- —
Personal DTI + credit; lowest rate.
DSCR
20% down · 8.5% · 30yr
- Down + closing
- —
- Monthly P&I
- —
- Monthly cashflow
- —
- DSCR
- —
- Eligible?
- —
No personal income docs; deal must DSCR.
Hard money
10% down · 12.0% · 12mo
- Down + closing
- —
- Monthly P&I
- —
- Monthly cashflow
- —
- DSCR
- —
- Eligible?
- —
Short-term bridge; refi at stabilization.
Listing history 21 events
-
2026-06-21days on market $235,600 Active 103 DOM
-
2026-06-18days on market $235,600 Active 100 DOM
-
2026-06-17days on market $235,600 Active 99 DOM
-
2026-06-16days on market $235,600 Active 98 DOM
-
2026-06-15days on market $235,600 Active 97 DOM
-
2026-06-13days on market $235,600 Active 95 DOM
-
2026-06-13days on market $235,600 Active 94 DOM
-
2026-06-10days on market $235,600 Active 92 DOM
-
2026-06-09days on market $235,600 Active 91 DOM
-
2026-06-08days on market $235,600 Active 90 DOM
-
2026-06-08days on market $235,600 Active 89 DOM
-
2026-06-05pricedays on market $235,600 Active 86 DOM
-
2026-06-03days on market $248,000 Active 85 DOM
-
2026-06-02days on market $248,000 Active 84 DOM
-
2026-06-01days on market $248,000 Active 83 DOM
-
2026-05-31days on market $248,000 Active 82 DOM
-
2026-03-10$248,000 Active 660-char remark
Show marketing remark (660 chars)
This ranch-style home offers potential on a lot close to town. This property presents a compelling investment opportunity with much potential. The two-bedroom, one-bathroom configuration offers flexibility for renovation and customization to suit various needs. The single-level design provides practical living convenience while allowing for creative updates and improvements. With thoughtful renovation, this home could be transformed into an attractive residence that maximizes its inherent possibilities and location advantages. Schedule your showing today to explore this ranch home's potential and spacious layout. This is a Fannie Mae Homepath property.
-
2025-11-13status Active
-
2025-11-12historical
-
2025-09-19status Pending
-
2025-09-08$250,000 Active
ⓘ Source: listings_history table (triggers on properties + properties_extension) + one-shot
backfill from property_details.listing_events for pre-trigger history.
Tax reassessment forecast FL · Resets to sale price
- Current annual tax
- $925 · $77/mo
- Projected year-2 tax
- $1,955 · $163/mo
- Expected delta
- +$1,030/yr (+$86/mo · 111.4%)
ⓘ Screening estimate from a state-policy table — verify with the county assessor before closing.
Climate risk First Street
- Flood 4/10 Moderate FEMA zone X (unshaded) · 22% chance over 30 yrs
- Wildfire 1/10 Low
- Heat 10/10 Extreme 7 d/yr ≥107°F today · 28 d/yr by 30 yrs out
- Wind 10/10 Extreme 99% chance of damaging wind over 30 yrs
- Air quality 2/10 Low 1 unhealthy d/yr today · 1 by 30 yrs out
Nearby sold comps map
Loading sold comps map…
Walkable amenities ~0.75 mi
Loading nearby amenities…
Taxation est. · year 1
- Rental income
- $23,017
- − Mortgage interest
- −$13,197
- − Property taxes
- −$925
- − Insurance
- −$1,178
- − Repairs & maintenance
- −$1,841
- − Management
- −$1,841
- − Depreciation
- −$6,854
- Taxable loss
- −$2,820
- Est. tax savings @ 24.0%
- +$677
- After-tax cash flow
- $1,931/yr
For passive investors: Depreciation is non-cash, so a rental often shows a tax loss while cash-flowing — sheltering income. Rental losses are passive: they offset passive income freely, and up to $25,000/yr can offset ordinary (W-2) income if you actively participate and your MAGI is under $100k (phasing out to $0 by $150k); unused losses carry forward. On sale, claimed depreciation is recaptured at up to 25%, and gains may owe capital-gains tax (a 1031 exchange can defer both). Figures are a year-1 estimate at your 24.0% rate — not tax advice; consult a CPA.
Schools (NCES district)
- District
- Sarasota
- NCES district ID
- 1201680
- Math proficiency
- 63% ▼ -8.00%
- Reading proficiency
- 63% ▼ -3.00%
- Median HH income
- $51,167
- Composite
- 53.68/100
- National rank
- #1428
- State rank
- #7 of 73 in FL
Livability — Gulf Gate
No livability data for this city. (Only ~50 U.S. cities are tracked.)
Census & demographics
- Census place
- Gulf Gate, FL
- County
- Sarasota County · 448,376 people
- City population
- 32,203
- Metro
- North Port-Sarasota-Bradenton, FL
- Population (ZIP)
- 32,404
- Household income
- $69,925
- Rent vs Own
- Severe rent burden
- 1983.0
Population outlook (Sarasota County) Hauer SSP2
- Today (2025)
- 452,380 people
- By 2030
- 474,175 · +4.8%
- By 2040
- 511,577 · +13.1%
- By 2050
- 541,467 · +19.7%
- By 2075
- 604,947 · +33.7%
- By 2100
- 621,965 · +37.5%
Race, ethnicity, and origin ACS 2023
- Neighborhood character
- Predominantly White (86%)
- Race & ethnicity
- White 86% Hispanic / Latino 10% Two or more races 7% Black 2%
- Hispanic origin (detail)
- Mexican 2%
- Common ancestry
- Romanian 4% Slovak 3% Lithuanian 3%
- Foreign-born
- 11% · Canada, Jamaica, China
- Languages at home
- 88% English-only · Spanish 6% Russian/Polish/Slavic 2% German/W. Germanic 1%
Political lean MEDSL · Sarasota
- 2024 margin
- R (+18.2) · D 40.5% · R 58.7%
- 2008→2024 swing
- -18.1pp toward R · 2008: -0.1pp · 2024: -18.2pp
- All cycles
- 2024: R+18.2 2020: R+10.4 2016: R+11.6 2012: R+7.4 2008: R+0.1
Not yet ingested
- Civics
- —
Market trends
- HPI YoY
- ▼ -448.92%
- Current HPI
- 292.9055
- Rent YoY
- ▼ -2.13%
- Metro
- North Port-Sarasota-Bradenton, FL
- State GDP YoY
- ▲ 3.28%
- F500 in state
- 36
Industry mix (Fortune 500 HQ in FL)
| Industry | F500 HQs | Revenue |
|---|---|---|
| Industrial Technology | 2 | $29B |
|
||
| Insurance | 2 | $17B |
|
||
| Retail | 1 | $60B |
|
||
| Technology Distribution | 1 | $58B |
|
||
| Homebuilding | 1 | $35B |
|
||
| Technology Manufacturing | 1 | $35B |
|
||
Price history
-0.8% since first listed5 events — show timeline
- 2026-03-10 Listed $248,000 Stellar MLS as Distributed by MLS Grid
- 2025-11-13 Relisted — Stellar MLS as Distributed by MLS Grid
- 2025-11-12 Listing Removed — Stellar MLS as Distributed by MLS Grid
- 2025-09-19 Pending — Stellar MLS as Distributed by MLS Grid
- 2025-09-08 Listed $250,000 Stellar MLS as Distributed by MLS Grid
Property tax history
+1.8%/yrLatest (2025): $925 · +5.4% YoY. Source: county tax records.
Cash-flow waterfall
monthlySold comps — $/sqft
last 12 mo · ≤1 miLoading sold comps…