1833 Courtyard Way · Naples, FL
Flood risk 7/10 · Major
- FEMA flood zone
- X (shaded)
- Chance of flooding over 30 yrs
- 0.89%
- Est. flood insurance / yr
- $507 – $1,088
Fire risk 1/10 · Minimal
- Est. fire insurance / yr
- $947 – $1,759
Heat risk 10/10 · Severe
- Hot days now (above 107°F)
- 7 days/yr
- Hot days in 30 yrs
- 31 days/yr
Wind risk 10/10 · Severe
- Chance of severe wind over 30 yrs
- 99.0%
Air-quality risk 2/10 · Minimal
- Unhealthy air days now
- 2 days/yr
- Unhealthy air days in 30 yrs
- 2 days/yr
Risk factors via First Street. Map © Google.
Why this score? — see what drove the D grade
The composite is a weighted blend of 9 inputs, each scored 0–100. Each bar is that input's sub-score; the figure is the points it added to the 100-point composite (weight × sub-score).
- Cash flow +10.1/30.0
- ARV discount +7.5/15.0
- 1% rule +6.3/10.0
- Schools +5.0/10.0
- Livability +4.0/5.0
- DSCR +2.9/10.0
- Condition / age +2.5/5.0
- Rent growth +2.1/5.0
- Appreciation +0.0/10.0
$250,000
🖨 Deal sheet 📄 Offer letter ✓ Due diligence
Listing remarks
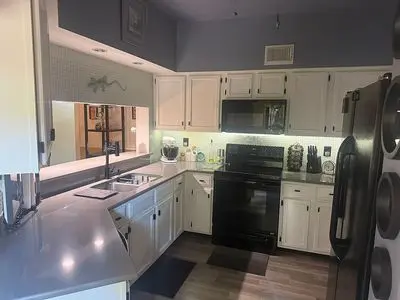
Welcome to this spacious and inviting 2-bedroom, 2-bath corner unit, offering both comfort and convenience. The home features vaulted ceilings in the living area, creating an open and airy atmosphere filled with natural light. Enjoy Florida living at its best with a fully screened lanai & acirc; & euro; & rdquo; perfect for relaxing or entertaining & acirc; & euro; & rdquo; plus an additional private back porch for extra outdoor space. Ideally situated in a quiet neighborhood, this property is just minutes from everything you need, including beautiful beaches, vibrant downtown attractions, shopping, dining, and more. A perfect blend of location, privacy, and comfort
Key facts
- Private back porch
- Corner unit
- Fully screened lanai
Tags
Property features AI
Exterior
- Home design: Built in 1983
- Exterior features: Located in the East Naples subdivision
Neighborhood map
What this means for you Summary
Snapshot
- This is a 2-bed/2.0-bath condo listed at $250k.
Deal economics
- At list price, monthly cash flow is $-215 ($-3k/yr) — negative.
- The deal already cash-flows at list — no discount required.
- Meets the 1% rule at list price ($3k rent vs $250k).
- Recommended offer: $246k (1.5% below list) — sets the bar for market timing.
Location & tenants
- Location reads 80/100 on livability (#126 in FL, #1,903 nationally) — a professional / high-income tenant draw. Strengths: crime A+, amenities A+, employment A+; Watch: commute D+, cost of living F.
- Collier (suburban): math 60% / reading 56% proficiency, ranked #16 of 73 in FL (top 22%) — acceptable for families but not a draw, mixed tenant base, ~2y average lease.
- Market conditions: Rents soft (-1.7%/yr); 771 active listings in the ZIP; 40 comparable units currently listed for rent nearby; rentals at typical pace (median 21d on market — plan ~3-4 weeks tenant-placement turnaround); 3,520 units permitted in Collier County in 2024 (959 in 5+ unit buildings).
- At $2,825/mo this rent would consume 49% of the median local household income ($70k/yr) (locally 980% of renters already pay >50% of income on rent) — very limited rent-growth headroom before tenants either downsize or default.
Forward outlook
- Local home prices are declining (-3.0%/yr); year-one equity from $2k of loan paydown is wiped out by about $8k of value loss. Plan a longer hold.
- Collier County population projected at +30% by 2050 — long-run rental-demand tailwind backs the buy-and-hold thesis.
Negotiation context
- It's been on market 20 days — a 2% lower offer ($246k) is reasonable based on typical stale-listing flexibility.
Risks & watch-outs
- Watch-outs: flood insurance adds $66/mo; HOA is 23% of rent.
- Climate carrying-cost: major flood risk; severe wind risk, 99% chance of damaging wind over 30y; extreme-heat days projected 7→31/yr by 2055 (HVAC capex compounding) — expect insurance premiums to compound above CPI over the hold.
Questions for the listing agent
- What do current leases actually rent for vs. the listed asking? Can we see a recent rent roll and the last 12 months of T-12 income?
- What's the actual annual flood-insurance premium (NFIP or private), and is the property in a SFHA with mandatory coverage?
- What does the HOA fee cover, when was the last increase, and are there any pending special assessments or reserve-fund shortfalls?
- Any open or pending special assessments — roof, HVAC, plumbing, elevator, façade? What's the per-unit balance and payoff schedule, and is the seller paying it off at close or rolling it to the buyer?
- Is there a deadline driving the sale (1031 exchange, divorce, estate, relocation)? That informs how much negotiation room exists.
- Schools are B-rated — typically a magnet for longer-tenancy family renters. What's the average tenant stay here, and is there a school-zone premium baked into asking?
- The area grade is low — what's the realistic commute time and amenity access for the typical tenant pool here? Any planned neighborhood developments (good or bad) we should know about?
- What's the average days-on-market for RENTAL listings here right now (not sales)? A rising rental-DOM trend means longer vacancies and softer asking-rent achievability than the comps imply.
- What's the recent tenant-quality profile in this submarket — average credit score on applications, eviction rate, late-payment / NSF rate, and stable-employment percentage? A property-management company in the area should have these aggregated.
- How much new apartment / multifamily construction is in the pipeline within 1–3 miles? Heavy new supply (>2% of stock underway) typically softens rents 12–24 months out; light construction supports rent growth.
Investment metrics
- 1% rule
- 1.13% ✓
- Cap rate
- 5.58%
- Cash-on-cash
- -2.54%
- DSCR
- 0.89
- GRM
- 7.4
CMA / ARV
No comps found within radius.
Projected returns pro-forma
-3.0% appreciation · 0.0% rent growth · sell at horizon
- IRR
- -27.3%
- Equity multiple
- 0.11×
- Total profit
- $-61,975
- Equity at exit
- $37,276
- IRR
- -53.3%
- Equity multiple
- -0.45×
- Total profit
- $-101,595
- Equity at exit
- $21,615
Cash invested: $70,000 (down + closing). Projections, not guarantees.
Landlord ↔ Tenant lean methodology
- Overall (STATE)
- 87 Strongly Landlord-Friendly
- State Florida
- 87 Strongly Landlord-Friendly · R+3
- County
- — inherits STATE
- City
- — inherits STATE
ZIP-level market 34112
- Rents YoY
- -1.7%
- Active inventory
- 771
- Price-to-rent
- 7.4×
Monthly cashflow live
- Estimated rent
- $2,825 high interval (Pro) →
- Mortgage (P&I)
- −$1,311
- Tax est. 1.5%
- −$312 /mo · $3,750/yr
- Insurance
- −$104
- Flood insurance flood zone
- −$66 /mo · $798/yr
- HOA est. from 4 same-building comps
- −$652
- Vacancy / Maint / Mgmt
- −$593
- Net cashflow
- $-215
Break-even live
UW: 25.0% down · 7.5% · 30yr · 1.5% tax · 5.0% vac · 8.0% maint · 8.0% mgmt
Financing live
Cash to close
- Down payment
- $62,500
- Closing costs
- $7,500
- Reserves months
- —
- Total cash needed
- —
Loan-product check · same deal, 3 products live
Conventional
25% down · 7.5% · 30yr
- Down + closing
- —
- Monthly P&I
- —
- Monthly cashflow
- —
- DSCR
- —
- Eligible?
- —
Personal DTI + credit; lowest rate.
DSCR
20% down · 8.5% · 30yr
- Down + closing
- —
- Monthly P&I
- —
- Monthly cashflow
- —
- DSCR
- —
- Eligible?
- —
No personal income docs; deal must DSCR.
Hard money
10% down · 12.0% · 12mo
- Down + closing
- —
- Monthly P&I
- —
- Monthly cashflow
- —
- DSCR
- —
- Eligible?
- —
Short-term bridge; refi at stabilization.
Rent comps 40 comps
| Address | Beds | Baths | Sqft | Rent | $/sqft | DOM | Units | Dist |
|---|---|---|---|---|---|---|---|---|
| 1826 Kings Lake Blvd #101 Naples, FL | 3.0 | 2.0 | 1456 | $2,700 | $1.85 | 13d | 1 | 0.05mi |
| 1895 Courtyard Way #103 Naples, FL | 3.0 | 2.0 | 1046 | $2,200 | $2.10 | 21d | 1 | 0.07mi |
| 1808 Kings Lake Blvd #203 Naples, FL | 2.0 | 2.0 | 1312 | $1,775 | $1.35 | 13d | 1 | 0.08mi |
| 1765 Courtyard Way Unit C-104 Naples, FL | 2.0 | 2.0 | 1132 | $2,700 | $2.39 | 13d | 1 | 0.10mi |
| 1765 Courtyard Way Unit C206 Naples, FL | 2.0 | 2.5 | 1150 | $1,650 | $1.43 | 13d | 1 | 0.10mi |
| 1933 Courtyard Way Unit D-103 Naples, FL | 2.0 | 2.0 | 947 | $1,850 | $1.95 | 13d | 1 | 0.10mi |
| 1701 Courtyard Way Naples, FL | 2.0 | 2.0 | 1072 | $1,990 | $1.86 | 23d | 1 | 0.12mi |
| 1802 Kings Lake Blvd Unit 2-101 Naples, FL | 2.0 | 2.0 | 1465 | $5,500 | $3.75 | 23d | 1 | 0.13mi |
| 1814 Kings Lake Blvd #204 Naples, FL | 2.0 | 2.0 | 1400 | $2,450 | $1.75 | 23d | 1 | 0.14mi |
| 153 Bristol Ln Unit A Naples, FL | 2.0 | 2.0 | 1009 | $2,250 | $2.23 | 13d | 1 | 0.24mi |
| 153 Bristol Ln Unit F102 Naples, FL | 2.0 | 2.0 | 1009 | $4,900 | $4.86 | 23d | 1 | 0.24mi |
| 141 Bristol Ln Unit C21 Naples, FL | 2.0 | 2.0 | 1400 | $5,900 | $4.21 | 23d | 1 | 0.24mi |
| 2132 Tama Cir #102 Naples, FL | 2.0 | 2.0 | 1368 | $4,000 | $2.92 | 23d | 1 | 0.25mi |
| 2103 Tama Cir Unit 2 Naples, FL | 2.0 | 2.0 | 1368 | $4,000 | $2.92 | 21d | 1 | 0.29mi |
| 4210 Looking Glass Ln Unit 4210 Naples, FL | 2.0 | 2.0 | 1300 | $3,000 | $2.31 | 13d | 1 | 0.29mi |
| 4180 Looking Glass Ln Unit 4104 Naples, FL | 2.0 | 2.0 | 1246 | $4,000 | $3.21 | 13d | 1 | 0.30mi |
| 4472 Beechwood Lake Dr Naples, FL | 3.0 | 2.0 | 1352 | $3,050 | $2.26 | 23d | 1 | 0.35mi |
| 2972 Kings Lake Blvd #2972 Naples, FL | 2.0 | 2.0 | 1100 | $3,000 | $2.73 | 23d | 1 | 0.36mi |
| 2648 Kings Lake Blvd Unit 6-201 Naples, FL | 3.0 | 2.0 | 1060 | $2,200 | $2.08 | 21d | 1 | 0.36mi |
| 2644 Kings Lake Blvd Unit 6-103 Naples, FL | 2.0 | 2.0 | 911 | $1,875 | $2.06 | 23d | 1 | 0.37mi |
| 2712 Kings Lake Blvd #201 Naples, FL | 1.0 | 1.0 | 1076 | $2,850 | $2.65 | 23d | 1 | 0.40mi |
| 4060 Ice Castle Way #10 Naples, FL | 2.0 | 2.0 | 1246 | $3,600 | $2.89 | 13d | 1 | 0.45mi |
| 4040 Ice Castle Way Unit 2 Naples, FL | 2.0 | 2.0 | 1246 | $2,800 | $2.25 | 23d | 1 | 0.45mi |
| 2050 W Crown Pointe Blvd Unit C214 Naples, FL | 3.0 | 2.0 | 1267 | $4,200 | $3.31 | 23d | 1 | 0.50mi |
| 1950 W Crown Pointe Blvd Unit B207 Naples, FL | 2.0 | 2.0 | 1129 | $1,950 | $1.73 | 23d | 1 | 0.50mi |
| 4021 Ice Castle Way #4 Naples, FL | 2.0 | 2.0 | 1246 | $2,600 | $2.09 | 13d | 1 | 0.51mi |
| 4010 Ice Castle Way #7 Naples, FL | 2.0 | 2.0 | 1314 | $3,200 | $2.44 | 23d | 1 | 0.53mi |
| 581 Teryl Rd #5 Naples, FL | 2.0 | 2.0 | 1403 | $4,500 | $3.21 | 13d | 1 | 0.55mi |
| 1075 Foxfire Ln Naples, FL | 2.0 | 2.0 | 1092 | $3,300 | $3.02 | 23d | 3 | 0.55mi |
| 1787 Reuven Cir Unit 1001 Naples, FL | 2.0 | 2.0 | 1112 | $1,300 | $1.17 | 13d | 1 | 0.62mi |
| 4069 Northlight Dr #1805 Naples, FL | 2.0 | 2.0 | 1234 | $3,000 | $2.43 | 21d | 1 | 0.64mi |
| 4502 Parrot Ave Naples, FL | 3.0 | 2.0 | 1200 | $2,950 | $2.46 | 23d | 1 | 0.64mi |
| 432 Teryl Rd Unit 1546319P Naples, FL | 2.0 | 2.0 | 1496 | $1,561 | $1.04 | 13d | 1 | 0.65mi |
| 195 Peppermint Ln Unit 4 Naples, FL | 2.0 | 2.0 | 1335 | $2,500 | $1.87 | 23d | 1 | 0.67mi |
| 195 Peppermint Ln Unit 884 Naples, FL | 2.0 | 2.0 | 1335 | $3,800 | $2.85 | 13d | 1 | 0.67mi |
| 195 Peppermint Ln Unit 881 Naples, FL | 2.0 | 2.0 | 1335 | $5,000 | $3.75 | 13d | 1 | 0.67mi |
| 202 Peppermint Ln #2 Naples, FL | 2.0 | 2.0 | 1335 | $5,000 | $3.75 | 13d | 1 | 0.67mi |
| 195 Peppermint Ln #2 Naples, FL | 2.0 | 2.0 | 1198 | $2,600 | $2.17 | 13d | 1 | 0.67mi |
| 146 Lollypop Ln #851 Naples, FL | 2.0 | 2.0 | 1335 | $3,750 | $2.81 | 23d | 1 | 0.69mi |
| 882 Bluebird St Naples, FL | 3.0 | 2.0 | 1308 | $6,000 | $4.59 | 23d | 1 | 0.72mi |
HOA detail condo
- Monthly dues
- $0 · $0/yr
- Assessments
- None detected in remarks — confirm with the listing agent.
Listing history 12 events
-
2026-06-18days on market $250,000 Active 20 DOM
-
2026-06-17days on market $250,000 Active 19 DOM
-
2026-06-16pricedays on market $250,000 Active 18 DOM
-
2026-06-15days on market $266,000 Active 17 DOM
-
2026-06-10days on market $266,000 Active 12 DOM
-
2026-06-09days on market $266,000 Active 11 DOM
-
2026-06-08days on market $266,000 Active 10 DOM
-
2026-06-07days on market $266,000 Active 9 DOM
-
2026-06-02days on market $266,000 Active 4 DOM
-
2026-06-01days on market $266,000 Active 3 DOM
-
2026-05-31days on market $266,000 Active 2 DOM
-
2026-05-29$266,000 Active
ⓘ Source: listings_history table (triggers on properties + properties_extension) + one-shot
backfill from property_details.listing_events for pre-trigger history.
Climate risk First Street
- Flood 7/10 Severe FEMA zone X (shaded) · 89% chance over 30 yrs
- Wildfire 1/10 Low
- Heat 10/10 Extreme 7 d/yr ≥107°F today · 31 d/yr by 30 yrs out
- Wind 10/10 Extreme 99% chance of damaging wind over 30 yrs
- Air quality 2/10 Low 2 unhealthy d/yr today · 2 by 30 yrs out
Nearby sold comps map
Loading sold comps map…
Walkable amenities ~0.75 mi
Loading nearby amenities…
Taxation est. · year 1
- Rental income
- $33,896
- − Mortgage interest
- −$14,004
- − Property taxes
- −$3,750
- − Insurance
- −$2,048
- − Repairs & maintenance
- −$2,712
- − Management
- −$2,712
- − HOA
- −$7,824
- − Depreciation
- −$7,273
- Taxable loss
- −$6,425
- Est. tax savings @ 24.0%
- +$1,542
- After-tax cash flow
- $-1,034/yr
For passive investors: Depreciation is non-cash, so a rental often shows a tax loss while cash-flowing — sheltering income. Rental losses are passive: they offset passive income freely, and up to $25,000/yr can offset ordinary (W-2) income if you actively participate and your MAGI is under $100k (phasing out to $0 by $150k); unused losses carry forward. On sale, claimed depreciation is recaptured at up to 25%, and gains may owe capital-gains tax (a 1031 exchange can defer both). Figures are a year-1 estimate at your 24.0% rate — not tax advice; consult a CPA.
Schools (NCES district)
- District
- Collier
- NCES district ID
- 1200330
- Math proficiency
- 60% ▼ -4.00%
- Reading proficiency
- 56% ▼ -2.00%
- Median HH income
- $58,275
- Composite
- 50.23/100
- National rank
- #1892
- State rank
- #16 of 73 in FL
Livability — Naples
- Score
- 80/100
- State rank
- #126
- US rank
- #1903
Category grades
Schools grade is shown separately in the Schools card above.
Census & demographics
- County
- Collier County · 396,295 people
- Metro
- Naples-Marco Island, FL
- Population (ZIP)
- 27,193
- Household income
- $69,842
- Rent vs Own
- Severe rent burden
- 980.0
Population outlook (Collier County) Hauer SSP2
- Today (2025)
- 420,858 people
- By 2030
- 450,054 · +6.9%
- By 2040
- 502,232 · +19.3%
- By 2050
- 544,932 · +29.5%
- By 2075
- 627,203 · +49.0%
- By 2100
- 659,015 · +56.6%
Race, ethnicity, and origin ACS 2023
- Neighborhood character
- Predominantly White (74%)
- Race & ethnicity
- White 74% Hispanic / Latino 18% Two or more races 9% Black 6% Native American 2% Asian 1%
- Hispanic origin (detail)
- Mexican 7% Puerto Rican 2% Cuban 4% Dominican 1%
- Common ancestry
- Hispanic 4% Romanian 3% Portuguese 2%
- Foreign-born
- 19% · Canada, Jamaica
- Languages at home
- 75% English-only · Spanish 17% French/Haitian/Cajun 4% German/W. Germanic 1%
Political lean MEDSL · Collier
- 2024 margin
- Solid R (+33.1) · D 33.1% · R 66.2%
- 2008→2024 swing
- -10.6pp toward R · 2008: -22.5pp · 2024: -33.1pp
- All cycles
- 2024: R+33.1 2020: R+24.7 2016: R+26.0 2012: R+30.1 2008: R+22.5
Not yet ingested
- Civics
- —
Market trends
- HPI YoY
- ▼ -235.10%
- Current HPI
- 256.9182
- Rent YoY
- ▼ -1.69%
- Metro
- Naples-Marco Island, FL
- State GDP YoY
- ▲ 3.28%
- F500 in state
- 36
Industry mix (Fortune 500 HQ in FL)
| Industry | F500 HQs | Revenue |
|---|---|---|
| Industrial Technology | 2 | $29B |
|
||
| Insurance | 2 | $17B |
|
||
| Retail | 1 | $60B |
|
||
| Technology Distribution | 1 | $58B |
|
||
| Homebuilding | 1 | $35B |
|
||
| Technology Manufacturing | 1 | $35B |
|
||
Price history
1 event — show timeline
- 2026-05-29 Listed $266,000 FSBO.com
Cash-flow waterfall
monthlySold comps — $/sqft
last 12 mo · ≤1 miLoading sold comps…