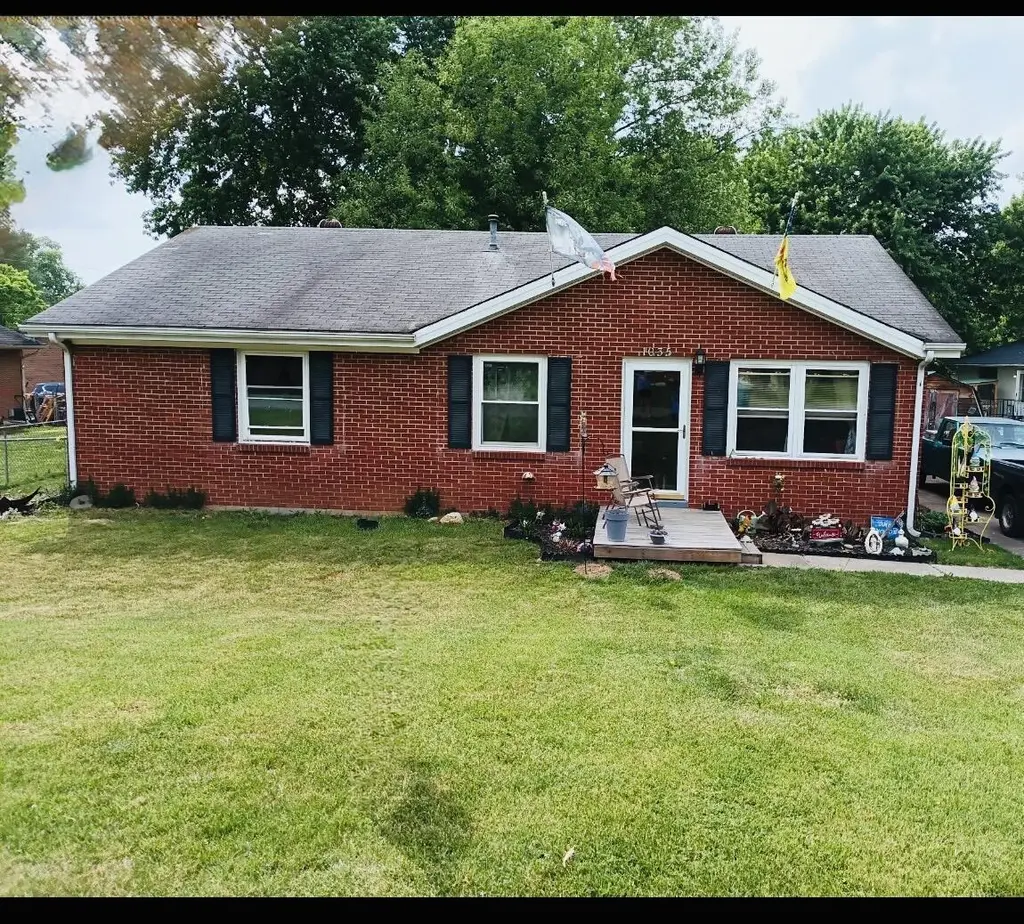
1035 Plainview Dr · Danville, KY
Flood risk 1/10 · Minimal
- FEMA flood zone
- X (unshaded)
- Chance of flooding over 30 yrs
- 0.0%
- Est. flood insurance / yr
- $507 – $1,088
Fire risk 4/10 · Minor
- Est. fire insurance / yr
- $839 – $1,559
Heat risk 4/10 · Minor
- Hot days now (above 103°F)
- 7 days/yr
- Hot days in 30 yrs
- 20 days/yr
Wind risk 3/10 · Minor
- Chance of severe wind over 30 yrs
- 5.0%
Air-quality risk 1/10 · Minimal
- Unhealthy air days now
- 0 days/yr
- Unhealthy air days in 30 yrs
- 0 days/yr
Risk factors via First Street. Map © Google.
Why this score? — see what drove the D grade
The composite is a weighted blend of 9 inputs, each scored 0–100. Each bar is that input's sub-score; the figure is the points it added to the 100-point composite (weight × sub-score).
- Cash flow +14.4/30.0
- ARV discount +7.5/15.0
- DSCR +4.4/10.0
- 1% rule +4.0/10.0
- Livability +3.9/5.0
- Rent growth +2.5/5.0
- Schools +2.5/10.0
- Condition / age +2.5/5.0
- Appreciation +0.0/10.0
$169,900
🖨 Deal sheet 📄 Offer letter ✓ Due diligence
Listing remarks
Charming 4-bedroom, 1-bath home nestled in a quiet neighborhood—perfect for comfortable everyday living. This inviting property offers the ideal blend of tranquility and convenience, located just minutes from popular restaurants, shopping, and local amenities. Inside, you'll find fresh updates that make this home move-in ready, including brand-new flooring throughout, new energy-efficient windows that bring in plenty of natural light, and a recently installed water heater for added peace of mind. With its cozy appeal, thoughtful upgrades, and unbeatable location, this home is a fantastic opportunity for anyone looking for comfort, value, and convenience all in one place.
Key facts
- New flooring
- Fresh updates
- Quiet neighborhood
Tags
Property features AI
Finance
- Other: Property is listed as contingent
Exterior
- Parking: Driveway
- Utilities: Public sewer; Public water
- Home design: Single-family property (one building); 1,376 building area (listed total area)
- Construction: Solid masonry construction; Block foundation; Shingle roof
- Exterior features: Shed(s) on the property; Chain link fencing; Public water supply; Not on waterfront
Interior
- Kitchen: Range; Refrigerator; Dishwasher not listed
- Bedrooms: 2 total rooms (includes bedrooms and living areas)
- Flooring: Carpet
- Bathrooms: 1 full bathroom
- Heating & cooling: Natural gas heating; Electric cooling; Heat pump
- Interior features: Washer and dryer included; Refrigerator included; Range (stove/oven) included; Carpet flooring; Crawl space foundation; No fireplace
- Laundry & utility: Washer; Dryer
Neighborhood map
What this means for you Summary
Snapshot
- This is a 4-bed/1.0-bath other listed at $170k.
Deal economics
- At list price, monthly cash flow is $33 ($399/yr) — positive.
- The deal already cash-flows at list — no discount required.
- To meet the 1% rule (rent ≥ 1% of price), the offer needs to be $153k (10.0% below list).
- Recommended offer: $153k (10.0% below list) — sets the bar for 1% rule.
- Cap rate 6.5% vs local median 3.0% in Danville — top-decile yield for the area; either an underpriced asset or a hidden risk that comps aren't pricing in. Stress-test before assuming the spread holds.
Location & tenants
- Location reads 77/100 on livability (#85 in KY, #3,148 nationally) — a middle-class / working-renter tenant base. Strengths: crime A+, cost of living A+, health & safety A+; Watch: amenities F, commute F, employment F.
- Danville Independent (town): math 26% / reading 35% proficiency, ranked #110 of 165 in KY (top 67%) — families likely to look elsewhere, expect single-tenant / working-renter base with shorter leases.
- Zoned schools: John W. Bate Middle School (math 19% / reading 37%, grade F, #165 of 217 statewide, top 77%, 399 students, 66% FRL); Danville High School (math 32% / reading 32%, grade F, #97 of 254 statewide, top 46%, 481 students, 63% FRL).
- Market conditions: 165 active listings in the ZIP; 85 units permitted in Boyle County in 2024 (0 in 5+ unit buildings).
- This rent runs 31% of the median local income ($60k/yr) — at the standard rent-burdened threshold; future hikes will face affordability resistance.
Forward outlook
- Local home prices are declining (-3.0%/yr); year-one equity from $1k of loan paydown is wiped out by about $5k of value loss. Plan a longer hold.
- Boyle County population projected at +13% by 2050 — modest demand growth; plan on rents tracking national, not racing it.
Negotiation context
- It's been on market 56 days — a 3% lower offer ($165k) is reasonable based on typical stale-listing flexibility.
- Current owner paid $30k; list at $170k implies a 466% gain — meaningful room to come down on a strong offer.
Questions for the listing agent
- It's been on market 56 days. Have you received any prior offers? Is the seller open to a 10% concession, seller financing, or rate buy-down credit?
- Is there a deadline driving the sale (1031 exchange, divorce, estate, relocation)? That informs how much negotiation room exists.
- The area grade is low — what's the realistic commute time and amenity access for the typical tenant pool here? Any planned neighborhood developments (good or bad) we should know about?
- What's the average days-on-market for RENTAL listings here right now (not sales)? A rising rental-DOM trend means longer vacancies and softer asking-rent achievability than the comps imply.
- What's the recent tenant-quality profile in this submarket — average credit score on applications, eviction rate, late-payment / NSF rate, and stable-employment percentage? A property-management company in the area should have these aggregated.
- How much new for-sale + rental construction is in the pipeline within 1–3 miles? Heavy new supply typically softens prices + rents 12–24 months out; constrained supply supports both.
Investment metrics
- 1% rule
- 0.90% ✗
- Cap rate
- 6.53%
- Cash-on-cash
- 0.84%
- DSCR
- 1.04
- GRM
- 9.3
CMA / ARV
No comps found within radius.
Projected returns pro-forma
-3.0% appreciation · 3.0% rent growth · sell at horizon
- IRR
- -14.9%
- Equity multiple
- 0.47×
- Total profit
- $-25,390
- Equity at exit
- $25,333
- IRR
- -6.3%
- Equity multiple
- 0.59×
- Total profit
- $-19,288
- Equity at exit
- $14,690
Cash invested: $47,572 (down + closing). Projections, not guarantees.
Landlord ↔ Tenant lean methodology
- Overall (STATE)
- 83 Strongly Landlord-Friendly
- State Kentucky
- 83 Strongly Landlord-Friendly · R+16
- County
- — inherits STATE
- City
- — inherits STATE
ZIP-level market 40422
- Home prices YoY
- -12.8%
- Active inventory
- 165
- Price-to-rent
- 9.3×
Monthly cashflow live
- Estimated rent
- $1,528 medium interval (Pro) →
- Mortgage (P&I)
- −$891
- Tax est. 1.5%
- −$212 /mo · $2,548/yr
- Insurance
- −$71
- HOA
- −$0
- Vacancy / Maint / Mgmt
- −$321
- Net cashflow
- $33
Break-even live
UW: 25.0% down · 7.5% · 30yr · 1.5% tax · 5.0% vac · 8.0% maint · 8.0% mgmt
Financing live
Cash to close
- Down payment
- $42,475
- Closing costs
- $5,097
- Reserves months
- —
- Total cash needed
- —
Loan-product check · same deal, 3 products live
Conventional
25% down · 7.5% · 30yr
- Down + closing
- —
- Monthly P&I
- —
- Monthly cashflow
- —
- DSCR
- —
- Eligible?
- —
Personal DTI + credit; lowest rate.
DSCR
20% down · 8.5% · 30yr
- Down + closing
- —
- Monthly P&I
- —
- Monthly cashflow
- —
- DSCR
- —
- Eligible?
- —
No personal income docs; deal must DSCR.
Hard money
10% down · 12.0% · 12mo
- Down + closing
- —
- Monthly P&I
- —
- Monthly cashflow
- —
- DSCR
- —
- Eligible?
- —
Short-term bridge; refi at stabilization.
Listing history 18 events
-
2026-06-19days on market $169,900 Active 56 DOM
-
2026-06-18days on market $169,900 Active 55 DOM
-
2026-06-17days on market $169,900 Active 54 DOM
-
2026-06-16days on market $169,900 Active 53 DOM
-
2026-06-15days on market $169,900 Active 52 DOM
-
2026-06-14days on market $169,900 Active 50 DOM
-
2026-06-12days on market $169,900 Active 49 DOM
-
2026-06-09days on market $169,900 Active 46 DOM
-
2026-06-08days on market $169,900 Active 45 DOM
-
2026-06-07days on market $169,900 Active 44 DOM
-
2026-06-07days on market $169,900 Active 43 DOM
-
2026-06-02days on market $169,900 Active 39 DOM
-
2026-06-01days on market $169,900 Active 38 DOM
-
2026-05-31days on market $169,900 Active 37 DOM
-
2026-05-30days on market $169,900 Active 36 DOM
-
2026-05-12historical Contingent
-
2026-04-24$169,900 Active
-
1981-07-01soldstatus $30,000
ⓘ Source: listings_history table (triggers on properties + properties_extension) + one-shot
backfill from property_details.listing_events for pre-trigger history.
Climate risk First Street
- Flood 1/10 Low FEMA zone X (unshaded) · 0% chance over 30 yrs
- Wildfire 4/10 Moderate
- Heat 4/10 Moderate 7 d/yr ≥103°F today · 20 d/yr by 30 yrs out
- Wind 3/10 Moderate 5% chance of damaging wind over 30 yrs
- Air quality 1/10 Low 0 unhealthy d/yr today · 0 by 30 yrs out
Nearby sold comps map
Loading sold comps map…
Walkable amenities ~0.75 mi
Loading nearby amenities…
Taxation est. · year 1
- Rental income
- $18,340
- − Mortgage interest
- −$9,517
- − Property taxes
- −$2,548
- − Insurance
- −$850
- − Repairs & maintenance
- −$1,467
- − Management
- −$1,467
- − Depreciation
- −$4,943
- Taxable loss
- −$2,452
- Est. tax savings @ 24.0%
- +$588
- After-tax cash flow
- $988/yr
For passive investors: Depreciation is non-cash, so a rental often shows a tax loss while cash-flowing — sheltering income. Rental losses are passive: they offset passive income freely, and up to $25,000/yr can offset ordinary (W-2) income if you actively participate and your MAGI is under $100k (phasing out to $0 by $150k); unused losses carry forward. On sale, claimed depreciation is recaptured at up to 25%, and gains may owe capital-gains tax (a 1031 exchange can defer both). Figures are a year-1 estimate at your 24.0% rate — not tax advice; consult a CPA.
Schools (NCES district)
- District
- Danville Independent
- NCES district ID
- 2101440
- Math proficiency
- 26% ▼ -14.00%
- Reading proficiency
- 35% ▼ -16.00%
- Median HH income
- $34,215
- Composite
- 25.08/100
- National rank
- #7535
- State rank
- #110 of 165 in KY
Livability — Danville
- Score
- 77/100
- State rank
- #85
- US rank
- #3148
Category grades
Schools grade is shown separately in the Schools card above.
Census & demographics
- Census place
- Danville, KY
- County
- Boyle County · 25,950 people
- City population
- 25,950
- Metro
- Danville, KY
- Population (ZIP)
- 25,950
- Household income
- $59,615
- Rent vs Own
- Severe rent burden
- 1047.0
Population outlook (Boyle County) Hauer SSP2
- Today (2025)
- 31,908 people
- By 2030
- 32,875 · +3.0%
- By 2040
- 34,549 · +8.3%
- By 2050
- 36,095 · +13.1%
- By 2075
- 39,800 · +24.7%
- By 2100
- 40,157 · +25.9%
Race, ethnicity, and origin ACS 2023
- Neighborhood character
- Predominantly White (81%)
- Race & ethnicity
- White 81% Black 9% Two or more races 6% Hispanic / Latino 5%
- Common ancestry
- Italian 2% Slovak 2% Lithuanian 1%
- Foreign-born
- 3% · Canada
- Languages at home
- 96% English-only · Spanish 2%
Political lean MEDSL · Boyle
- 2024 margin
- Strong R (+29.0) · D 34.7% · R 63.7% · Other 1.5%
- 2008→2024 swing
- -5.8pp toward R · 2008: -23.2pp · 2024: -29.0pp
- All cycles
- 2024: R+29.0 2020: R+24.7 2016: R+29.1 2012: R+26.1 2008: R+23.2
Not yet ingested
- Civics
- —
Market trends
- HPI YoY
- ▼ -38.55%
- Current HPI
- 262.516
- Rent YoY
- —
- Metro
- Danville, KY
- State GDP YoY
- ▲ 1.81%
- F500 in state
- 4
Industry mix (Fortune 500 HQ in KY)
| Industry | F500 HQs | Revenue |
|---|---|---|
| Healthcare | 1 | $118B |
|
||
| Food / Beverage | 1 | $7B |
|
||
Price history
+466.3% since first listed3 events — show timeline
- 2026-05-12 Contingent — ImagineMLS
- 2026-04-24 Listed $169,900 ImagineMLS
- 1981-07-01 Sold (Public Records) $30,000 Public Records
Cash-flow waterfall
monthlySold comps — $/sqft
last 12 mo · ≤1 miLoading sold comps…